
Stepwise adaptations of citrate synthase to survival at
life’s extremes
From psychrophile to hyperthermophile
Graeme S. Bell
1
, Rupert J. M. Russell
2
, Helen Connaris
2
, David W. Hough
1
, Michael J. Danson
1
and Garry L. Taylor
1,2
1
Centre for Extremophile Research, Department of Biology and Biochemistry, University of Bath, UK;
2
Centre for Biomolecular
Sciences, University of St Andrews, St. Andrews, UK
The crystal structure of citrate synthase from the thermo-
philic Archaeon Sulfolobus solfataricus (optimum growth
temperature ¼85 C) has been determined, extending the
number of crystal structures of citrate synthase from differ-
ent organisms to a total of five that span the temperature
range over which life exists (from psychrophile to hyper-
thermophile). Detailed structural analysis has revealed
possible molecular mechanisms that determine the different
stabilities of the five proteins. The key to these mechanisms is
the precise structural location of the additional interactions.
As one ascends the temperature ladder, the subunit interface
of this dimeric enzyme and loop regions are reinforced by
complex electrostatic interactions, and there is a reduced
exposure of hydrophobic surface. These observations reveal
a progressive pattern of stabilization through multiple
additional interactions at solvent exposed, loop and inter-
facial regions.
Keywords: citrate synthase; Sulfolobus; citrate synthase;
thermostability; crystal structure; ion networks.
Comparative structural analysis of the same protein isolated
from mesophiles and thermophiles have highlighted many
structural adaptations that confer protein thermostability
[1–6]. The importance of electrostatic interactions at specific
locations within the structure, and particularly the presence
of ion-pair networks, is a feature that is common to almost
all the hyperthermophilic proteins [7–10], although many
other additional differences such as improved hydrophobic
packing, compactness and additional hydrogen bonds have
been observed in other proteins.
For our analysis we have chosen the enzyme citrate
synthase (CS) (EC 4.1.3.7), which catalyses the condensa-
tion of oxaloacetate and acetyl-CoA to form citrate and
CoA. The enzyme from psychrophilic, mesophilic and
thermophilic sources has been intensively studied both
kinetically [11–13] and structurally [3,14]. Crystal structures
exist for CS from a psychrophilic Antarctic bacterium
Arthrobacter strain DS2-3R (growth optimum ¼31 C)
[15], pig (37 C) [16], and the Archaea Thermoplasma
acidophilum (55 C) [17] and Pyrococcus furiosus (100 C)
[18]. To extend our previous studies we have chosen the
organism Sulfolobus solfataricus, a thermophilic Archaeon
that optimally grows at 85 C. The gene for Sulfolobus
solfataricus CS has been cloned and sequenced [19], and
over-expressed in E. coli. The purified recombinant protein
exists as a homodimer of M
r
¼81,000, with each monomer
comprising 379 amino acids. The following abbreviations
will be used for the CSs, including their optimal growth
temperatures: Arthrobacter: ArCS(31), pig: PigCS(37),
T. acidolphilum: TpCS(55), S. solfataricus:ScCS(85),and
P. furiosus: PfCS(100).
The structure of unliganded SsCS(85) reported in this
paper can now be entered into the temperature ladder of CS
structures, and fills in the gap between the 55 C and 100 C
enzymes. Six CS crystal structures from five host organisms
(Table 1) can now be used for comparative analysis in order
to identify some of the structural features that could confer
(hyper)thermostability in this enzyme family.Ascanbe
seen from Table 1, the organisms span the range of
temperatures at which life is known to exist, and the
inherent stability of each CS, from in vitro measured half-
lives of thermal inactivation [19–21], increases with the
optimum growth temperature of the host cells. The structure
of the SsCS(85) is thus discussed in comparison with the
other CS structures, and trends in structural changes are
correlated with the increasing thermal stabilities across the
homologous series of enzymes. In terms of thermostability,
the enzymes fall into two broad classes based on the
temperature at which the half-life equals 8 min: the psychro-
phile and pig enzymes at the lower end with temperatures of
45 Cand58 C, and the archaeal enzymes at the upper end
with temperatures of 87 C, 95 Cand100C.
MATERIALS AND METHODS
Crystallization and structure solution
Recombinant SsCS(85) was purified as described previously
[19]. Crystallization trials were carried out using the
hanging-drop vapour diffusion method using the Hampton
Research Screens. A single rod-like crystal of approximate
dimensions 2 ·0.1 ·0.1 mm grew in a 6-lL drop contain-
ing 2 lLSsCS(85) (10 mgÆmL
)1
)with10m
M
citrate and
Correspondence to G. Taylor, Centre for Biomolecular Sciences,
University of St. Andrews, St. Andrews, KY16 9ST, UK.
E-mail: glt2@st-and.ac.uk
(Received 3 July 2002, revised 8 October 2002,
accepted 4 November 2002)
Eur. J. Biochem. 269, 6250–6260 (2002) FEBS 2002 doi:10.1046/j.1432-1033.2002.03344.x

CoA, 2 lLof100m
M
Tris/HCl, pH 7.2, containing 17%
(v/v) PEG 8K, and 2 lLof0.1
M
CaCl
2
.Thecrystalgrewin
a partially dried out drop after six months. X-ray data were
collected at room temperature on a 30-cm Mar image plate
detector. Diffraction extended to 2.7 A
˚resolution. The
crystal was translated stepwise perpendicular to the beam to
maximize the completeness of the data and to overcome
radiation damage of the crystal. The data were reduced and
scaled using
DENZO
/
SCALEPACK
[22] (Table 2). The asym-
metric unit of the P2
1
unit cell contains two dimers with a
solvent content of 51%. The structure of SsCS(85) was
solved by molecular replacement using the program
AMORE
[23]. Because the crystallization solutions contained both
citrate and CoA, it was assumed that the closed form of
SsCS(85) had crystallized; therefore, initial attempts were
made to solve the structure using the closed structures of
Pf CS(100) or ArCS(31) as the search model, but this did not
produce any clear solutions. Attempts were subsequently
made using the open structure of the TaCS(55) dimer as the
search model. Using data in the resolution range of 15–6 A
˚
and a Patterson integration radius of 25 A
˚, 50 solutions
from the rotation function were calculated. Using the same
resolution range for the translation search, the top solution
(33rd highest from the rotation search) had a correlation
coefficient (CC) of 32.0 and R-factor of 53.4% (compared
with the next highest peak with a background CC of 23 and
R-factor of 56%). This solution was fixed, and a solution
for the second dimer in the asymmetric unit was identified
(CC of 37.7% and R-factor of 51.9%, compared to the next
highest peak of 31 and 53%, respectively). After a rigid-
body refinement in
AMORE
of the two dimers, the final
solutions had a CC of 56.6 and R-factor of 41.3%. The
failure to find a solution using the closed form of the
homologous enzyme, but a clear solution with the open
forms, strongly suggested that the SsCS(85) had unexpect-
edly crystallised in the open, unliganded form.
Refinement and validation
The restrained refinement of SsCS(85) was performed using
REFMAC
[24]. The initial R-factor in
REFMAC
(after rigid
body refinement) was 48.3% (R
free
¼48.6%) and final
R-factor of 20.8% (R
free
¼28.5%) for all data from 20.0 A
˚
to 2.7 A
˚
1,2 . Tight non crystallographic symmetry (NCS)
restraints for both main-chain and side-chain were used
initially and six cycles of refinement carried after which the
R-factor was 36.3% (R
free
¼40.5%). Keeping the tight
NCS restraints, individual isotropic B-factor refinement was
then carried out, bringing the R-factor down to 24.7% (R
free
31.2%), after which the NCS restraints were gradually
loosened and the four monomers were built independently.
NCS restraints were controlled in
PROTIN
and, during the
refinement procedure, side-chain followed by main-chain
restraints were gradually loosened, with a final round
removing the NCS restraints continuing to lower the R
free
value.
The first two residues at the N-terminus and last seven
residues of the C-terminal arm were not seen in the poorly
defined electron density of these parts of the structure in all
four monomers. One conflict with the sequence data was
residue 57, which had been assigned as arginine and was
found from analysis of the electron density map to be a
proline (this is a totally conserved proline in all the other
known CSs). The position of the small domain with respect
to the large domain in SsCS(85) is the same as previously
observed in TaCS(55) [17]; this together with the absence of
density for substrates in the active site, supports the previous
speculation that the structure is the openform of the
enzyme. After 24 rounds of refinement in
REFMAC
, the final
R-factor was 20.8% (R
free
¼28.5%) (Table 2). The quality
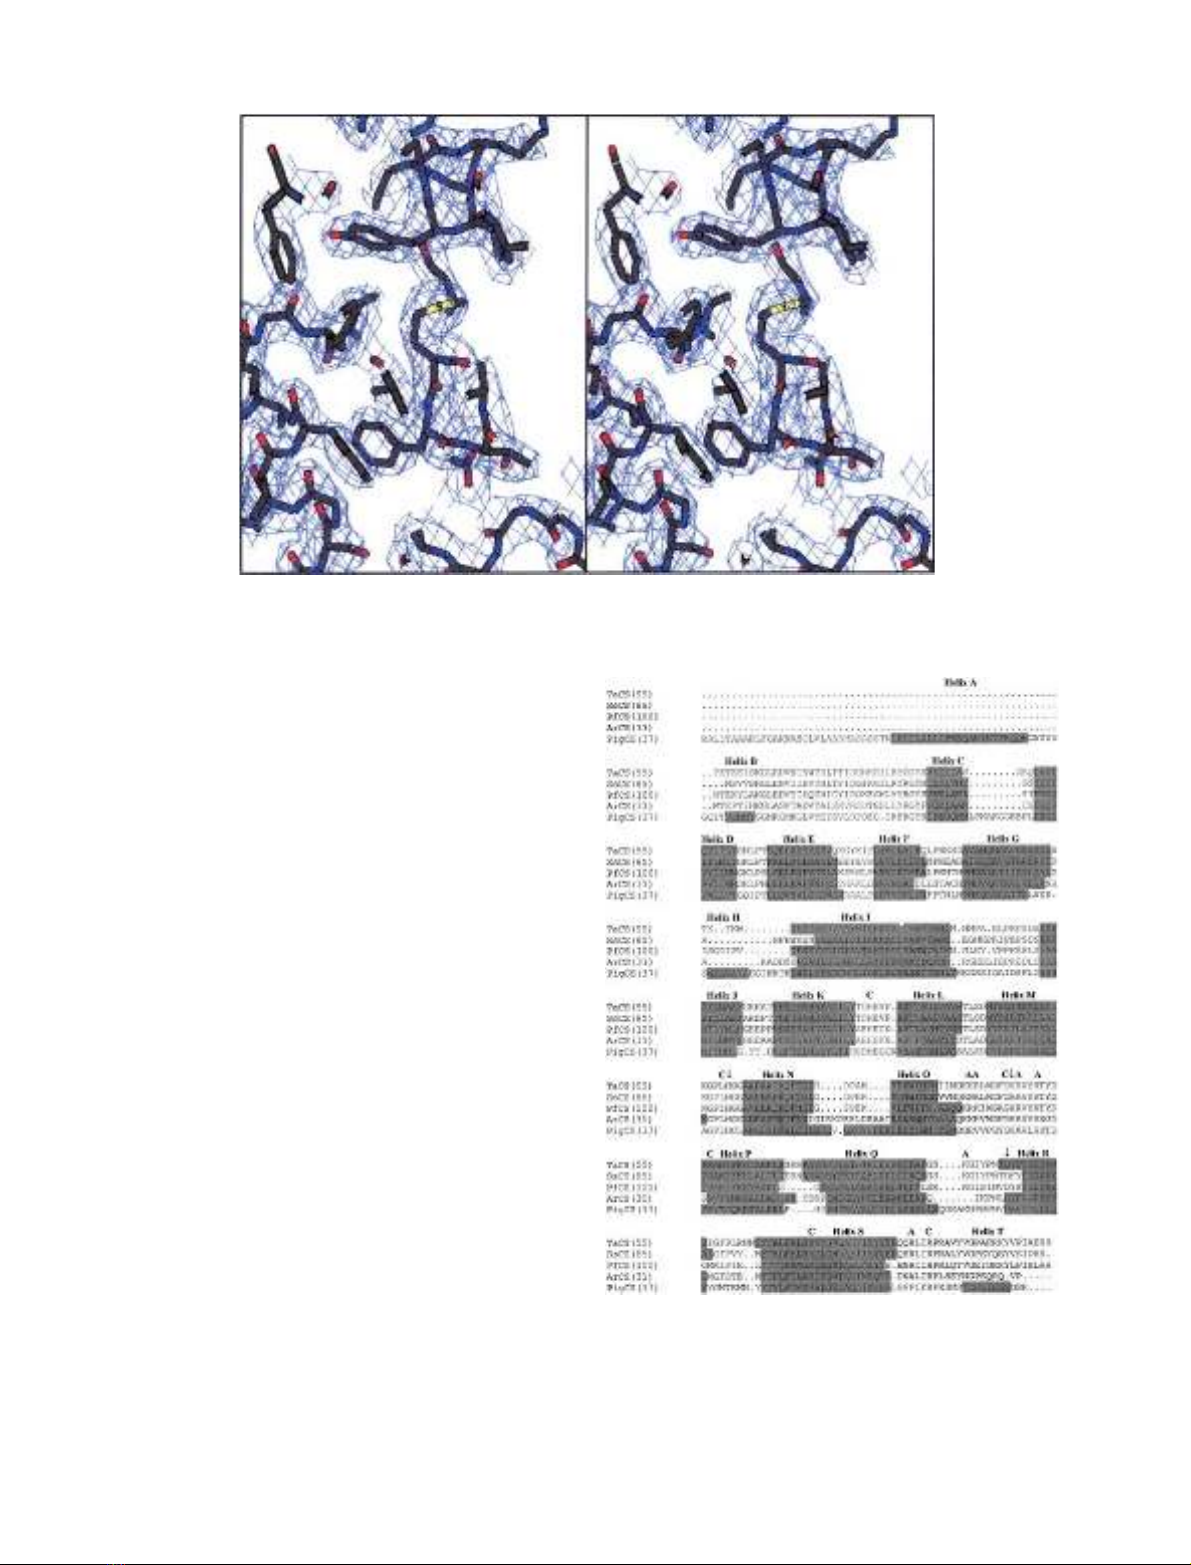
ofthefinalelectrondensityisshowninFig.1.
Table 2. Table displaying native data collected and refinement statistics
for the SsCS. Data in parentheses correspond to the high resolution
data shell (2.82–2.71 A
˚).
Space group P2
1
Unit cell dimensions a ¼77.3 A
˚,b¼97.9 A
˚,
c¼119.3 A
˚,b¼107.6
Resolution limit 2.7 A
˚
Data completeness 88.6% (91.2%)
R
merge
7.2% (22.9%)
I/rI 9.37 (3.25)
Total No. of reflections 148169
Unique reflections 46758
R-factor 20.8%
Free R-factor 28.5%
No. protein atoms 11 742
Rmsd bond lengths (A
˚) 0.009
Rmsd bond angles () 0.032
Table 1. CS structures used for analysis.
Source
organism
Optimum growth
temperature
(C)
CS
Temperature (C) at which
the half-life equals 8 min
Substrates in
crystal structure
Data resolution
(A
˚)
Arthrobacter DS23R 31
a
45 Citrate and CoA 2.1
Pig 37 58 Citrate only
Citrate and CoA
2.7
2.0
Thermoplasma acidophilum 55 87 – 2.5
Sulfolobus solfataricus 85 95 – 2.7
Pyrococcus furiosus 100 100 Citrate & CoA 1.9
a
It should be noted that, although Arthrobacter DS23R was isolated from a habitat temperature of approximately 0 C, this organism
displays a relatively high optimum growth temperature; therefore, although it is described here as psychrophilic, it should perhaps more
correctly be referred to as psychrotolerant.
FEBS 2002 Citrate synthase from psychrophile to hyperthermophile (Eur. J. Biochem. 269) 6251
The Ramachandran plot shows that for the four mono-
mers in the asymmetric unit, 91.3% of residues lie in the
most favoured regions, with only 8.7% in the allowed
regions and no residues appearing in the generously allowed
or disallowed regions (excluding glycine and proline
residues). Atomic coordinates have been deposited in the
Protein Databank with accession code 107x
3.
RESULTS
Overall structural comparisons
All the eukaryotic
4, archaeal and Gram-positive bacteria CSs
are homo-dimeric structures with each monomer consisting
of a large and small domain. In addition, they are almost
entirely a-helical; the pigCS contains 20 a-helices (A-T) with
theenzymefromArCS(31), TaCS(55), SsCS(85) and
PfCS(100) containing 16 a-helices, all of which have an
equivalent in pigCS (helices A, B, H, and T are not present)
(Figs 2 and 3). Of the 16 equivalent helices, the large domain
comprises 11 helices (C-M and S) and the small domain five
helices (N-R). The small domain has been classed as
residues 217–321 inclusive for SsCS(85).
The active sites of CSs comprise residues from both
monomers and therefore CS is only active as a dimer,
stressing the importance of maintaining dimeric integrity as a
prerequisite for activity. Binding of citrate and CoA to the
active site has been discussed in detail for PfCS(100) and
ArCS(31), and the differences with respect to the pig enzyme
noted [15,18]. The SsCS(85) structure has no substrate
bound, but the location of active site residues can be
identified by comparison with the liganded PfCS(100)
structure. The citrate-binding residues comprising three
arginine residues, R267 (helix P), R338 (helix S) and R358¢
(where the prime denotes the residue of the second mono-
mer), and three histidine residues, H183 (loop K-L), H218
(loop M-N) and H258 (loop O-P), are equivalent to those
found in PfCS(100). The binding residues for the three
Fig. 2. Structurally based sequence alignment of the five CSs discussed.
Helices A to T are shaded, and the location of the small domain is
indicated by lowercase sequence letters. The three catalytic residues are
indicated by fl. The three arginines and histidines involved in binding
citrate are marked with a C. The residues involved in binding the three
phosphates of CoA are marked with an A. The sequence numbering is
shownatthestartofeachline.
Fig. 1. Stereo-diagram showing a typical region of the final 2Fo-Fc electron density map contoured at 1 r.
6252 G. S. Bell et al. (Eur. J. Biochem. 269)FEBS 2002
phosphate groups of CoA are likely to be K250 (loop O-P)
and K306 (loop Q-R), R259 and K262 (both loop O-P), with
the third phosphate being co-ordinated by R355¢from the
second monomer. The catalytic residues H218, H258 and
D313 (loop Q-R) are also present in SsCS(85) and are in
a similar position to the PfCS(100) residues. It is likely
therefore that SsCS(85) binds substrates in a similar man-
ner to PfCS(100) and that the mechanism of catalysis is the
same.
The dimer interface of all the CSs is made up of two parts
and comprises residues solely in the large domain; the main
part is the eight a-helical sandwich of four antiparallel pairs
of helices (F, G, M and L), with the second being the
additional interaction of N- and C-terminal regions (Fig. 3).
The pigCS is different from the other four CSs in terms of
the topology of the C-terminal region. In the other four, the
C-terminal arm of one monomer wraps around the other
monomer, clasping the two together [18], and results in
more extensive interactions, including those with the
N-terminus. It is important to note that as the C-terminal
arms of the TaCS(55) and SsCS(85) are not complete in the
structures (see below), there may be additional interactions
present that have not been observed. This also suggests that
the C-terminal arm seems to be ordered only in the presence
of substrates.
Sequence and structural statistics
Pairwise sequence alignments were carried out using the
program
BESTFIT
from the Wisconsin
GCG
sequence analysis
package, and superposition was carried out using the least
squares fit in
O
[25] for fitting of alpha-carbon atoms
(starting from three conserved atoms). These statistics are
listed in Table 3.
Sequence identities between the various CSs for which
3D-structures have been determined range from 20%
[eukaryotic
5vs. bacterial or archaeal) to 60% (SsCS(85)
and TaCS(55)]. These identities are reflected in the root
mean square (RMS) deviations between the alpha-carbons
of the structures, with the most similar structures being the
TaCS(55) and SsCS(85), and with the PfCS(100) and
ArCS(31) pair also showing a very low RMS deviation. As
some structures are in the open conformation and some
have substrates bound, the large and small domains of each
enzyme were compared separately (Table 3); in general,
such an analysis shows the same trend as that for the whole
dimer but the small domains tend to be more highly
conserved. As is suggested later, this may correlate with
differences particularly relating to the dimer interface, to
which the small domain does not contribute, and may reflect
the fact that the majority of the substrate-binding and
catalytic residues are from the small domain.
The molecular mechanisms underlying protein thermal
stability
In our comparison of CS atomic structures from organisms
spanning a wide-range of growth temperatures, the deter-
mination of the SsCS(85) structure fills an important gap
between the enzyme from Thermoplasma (55 C) and
Pyrococcus (100 C). With the structure reported in this
paper, we can now look for trends in the structures that
might correlate with the increasing thermostabilities of these
enzymes. However, the complex nature of the stabilization
of a protein structure lends itself to many types of
comparative analysis, and the results presented below are
those where significant differences exist between the struc-
tures. Other types of analysis (e.g. of hydrogen bonds and
helix capping) have been performed but are not included
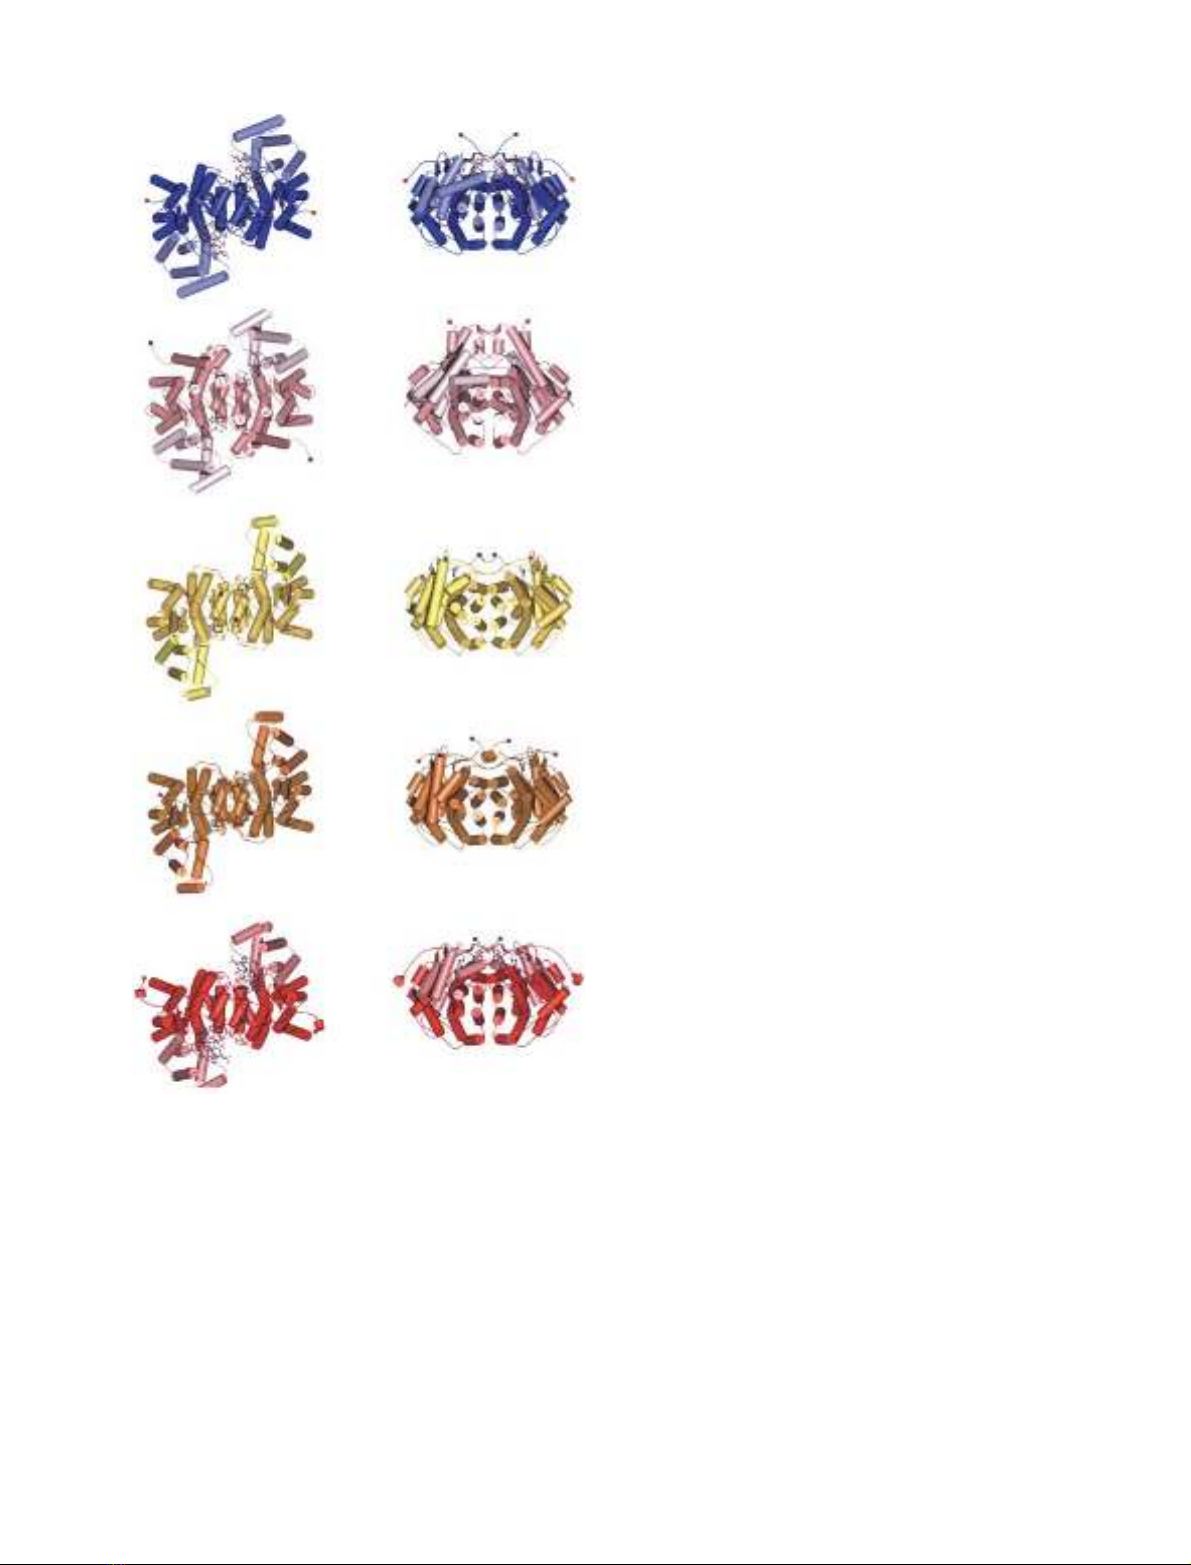
Fig. 3. Schematic drawings of CS. Fromtoptobottom:ArCS(31),
PigCS(37), TaCS(55), SsCS(85) and PfCS(100). The right hand col-
umn represent views obtained by rotating the images in the left hand
column by 90about a horizontal axis. N- and C-terminii are denoted
by blue and red spheres, respectively. The small domains (helices N to
R) are coloured in a lighted shade. Catalytic residues, and citrate and
Co-A where appropriate, are shown in ball-and-stick representation.
All figures were created using
BOBSCRIPT
[51] and
GL
_
RENDER
(L. Esser
and J. Deisenhofer, unpublished results).
FEBS 2002 Citrate synthase from psychrophile to hyperthermophile (Eur. J. Biochem. 269) 6253

due to there being no significant differences between the
different structures.
Compactness and surface characteristics
The accessible surface area was calculated using the program
GRASP
[26] and the volume and cavity detection were
determined using the program
VOIDOO
[27] with a probe
radius 1.4 A
˚and grid spacing of 0.75 A
˚. All calculations for
closed structures were carried out in the absence of substrate,
and the results are summarized in Table 4.
ArCS(31), TaCS(55) and PfCS(100) have very similar
surface areas, with that of SsCS(85) being slightly higher;
however, all four enzymes have a considerably smaller
surface area and volume than the pigCS(37), even when
deleting the first 35 residues from the pig enzyme (these 35
amino acids comprise helices A and B, which are absent in
the other CSs being considered). A similar pattern to the
total accessible surface area (ASA)
6is found when compar-
ing the overall volume, with pigCS(37) having a consider-
ably larger volume than the other CSs (again, even when
calculated with the N-terminally deleted structure).
However, it is also notable that the smallest volume is
exhibited by the psychrophilic CS (8.36 ·10
4
A
˚
3
). All the
CSs have a similar percentage of atoms buried, although the
hyperthermophilic Pf CS(100) exhibits the highest with
54.5%.
Examination of the exposed hydrophobic area shows a
more obvious trend. Despite all the archaeal and bacterial
CSs having a similar overall ASA, there is quite a difference
in hydrophobic exposure when comparing ArCS(31) with
the other CSs; the closed conformation of the ArCS(31) has
7854 A
˚
2
overall exposed hydrophobic area (representing
29% of the total ASA) compared with the closed PfCS(100)
with only 4942 A
˚
2
(18% of total ASA). Thus, on average,
ArCS(31) exposes 23 A
˚
2
per hydrophobic residue compared
with 16 A
˚
2
per hydrophobic residue in PfCS(100). The
total amount (A
˚
2
) of hydrophobic surface area shows a
decrease as the thermostability of the protein increases, a
trend observed in other structural comparisons [4]. SsCS(85)
also follows the trend observed in PfCS(100), with the
elimination of all cavities capable of accommodating a
solvent molecule, indicating that this is a prerequisite for
maintaining integrity at high temperatures. The number of
internal cavities (and their total volumes in A
˚
2
calculated by
VOIDOO
) are 1 (104), 6 (476), 3 (218), 3 (184), 0 (0) and 0 (0)
Table 3. Overall comparison of primary and 3D structures of CSs. In the top half of the table the RMS deviations between Caatoms (in A
˚)aregiven
for complete dimers, the large domain and the small domain, with the number of contributing pairs of Caatoms in parantheses. In the bottom half
of the table, the percentage sequence identities and similarities are shown, the latter in parentheses.
Enzyme
(open)
ArCS(31)
(closed) PigCS(37) PigCS(37) TaCS(55) SsCS(85) PfCS(100)
ArCS(31) – 2.27 (560) 2.12 (630) 1.97 (604) 1.94 (610) 1.32 (719)
1.74 (242) 1.53 (252) 1.57 (259) 1.07 (262)
1.79 (96) 1.59 (90) 1.51 (90) 1.27 (92)
PigCS(37) (open) – – 1.19 (730) 1.95 (651) 1.88 (646) 2.15 (550)
2.16 (533) 2.08 (519) 2.04 (631)
PigCS(37) (closed) 27% (50%) – – 1.81 (233) 1.79 (232) 1.84 (245)
1.60 (82) 1.55 (82) 1.49 (90)
0.87 (719) 2.03 (581)
TaCS(55) 32% (54%) – 22% (48%) – 0.76 (256) 1.66 (247)
0.76 (104) 1.02 (95)
SsCS(85) 34% (55%) – 27% (50%) 59% (76%) – 1.94 (597)
1.53 (245)
1.03 (96)
PfCS(100) 40% (58%) – 31% (53%) 42% (62%) 46% (67%) –
Table 4. Accessible surface area (ASA) and volume statistics of CSs.
CS
ArCS(31)
(closed)
PigCS(37)
(open)
PigCS(37)
(closed)
PigCS(37)
(closed,
N-terminally
deleted)
TaCS(55)
(open)
SsCS(85)
(open)
PfCS(100)
(closed)
ASA ( ·10
4
A
˚
2
) 2.72 3.34 3.20 2.99 2.72 2.82 2.72
No. of atoms calculated for 5784 6888 6884 6344 5722 5879 5961
No. of atoms buried 3044 3469 3601 3307 2955 3014 3248
Atoms buried (%) 52.6 50.4 52.3 52.1 51.6 51.3 54.5
Volume ( ·10
4
A
˚
3
) 8.36 9.96 9.98 9.18 8.71 8.51 8.65
Total area hydrophobic exposed (A
˚
2
) 7854 6654 6246 – 6001 5513 4942
% Hydrophobic of total ASA 29 20 20 – 22 20 18
6254 G. S. Bell et al. (Eur. J. Biochem. 269)FEBS 2002


