2 1
INTRODUCTION
1. Rationale
Vietnam have not conducted reliability and validity validation of the measurement of consumer confidence to identify the items for the calculation of the CCI corresponding to the Vietnamese context. This is the gap that the thesis attempts to fill in.
A Consumer Confidence Index (CCI) is an important economic indicator which is calculated and released by many countries in the world. Katona (1951) argues that a CCI measures consumers’ confidence in an economy. Thus, a CCI not only measures the expected size of a consumer’s future income but also the certainty or uncertainty that is linked to those expectations. A CCI, therefore, reflects psychological aspects of consumers through their optimism and confidence toward the economy, thus affects their consumption behavior. A CCI enables the detection of people's perception of the current and future economic development situation. As a result, there is a need for a comprehensive study to systematize the theory of compilation of CCI and apply it to the specific conditions of Vietnam. In addition, due to a time lag in releasing the statistical data, users's data demands have not met in a timely manner. Given the importance of a CCI as indicated above, as well as its preeminent characteristics, i.e. more timely calculation and release than other quantitative indicators, a CCI will promptly provide information on consumers' expectations to serve the prediction of an economy’s health in the short term.
Stemming from the current situation and the research gap as mentioned above, the thesis "Development of a Consumer Confidence Index in Vietnam" is critical.
2. Objectives and research questions The overall objective of the thesis is to construct a nationally representative CCI for Vietnam.
A CCI is a useful statistical indicator employed to forecast consumer's consumption, providing information for assessing the current and future health of an economy, detecting the turning points of an economy. A CCI can be used to improve the forecast or adjust the short-term forecast of other economic indicators, such as GDP and Consumer Price Index (CPI), etc. In an economy in which household consumption contributes an increasing share in GDP like Vietnam, and final consumption induces a high impact on output and value added of the economy (Ha & Trinh, 2018), the collection and compilation of a CCI is necessary.
international organizations have
In order to achieve the above-mentioned research objective, the thesis tries to answer the following questions: (1) How should a CCI in Vietnam be compiled? with the focus on the questions: what factors are used to measure CCI in Vietnam? What are the components of CCI in Vietnam? What are the most appropriate items for computing a CCI in Vietnam? Which is the best method for calculating a CCI in the Vietnamese setting?; (2) What is the best survey design to construct a nationally representative CCI for Vietnam?; How should the survey sample weight be computed to ensure the sample representation? Approximately 62 countries all over the world have compiled this index. Some introduced handbooks on CCI methodology. Nevertheless, each country applies a different method of computing this index to to be adapted to its specific context (UNSD, 2014). Different calculation methods lead to adjustment of the sample selection, survey method and frequency, field period, and questionnaire, etc. to be suitable with each country’s setting. 3. Research subject and scope
Research subject and scope of the thesis is the Vietnamese consumer confidence and the procedure for development of a CCI in Vietnam. Specifically, the content coverage of the thesis is identified based on research objectives and questions as mentioned above. Accordingly, the thesis focuses on presenting the theoretical foundation of consumer confidence and CCI. Next, Currently, studies on CCI in Vietnam are scarce and reveal shortcomings. The CCI computed by these studies are not nationally representative. Regarding consumer confidence survey, such elements as reporting unit, survey method and time reference used in questions still expose limitations that need to be improved. None of the studies has calculated the survey weight to ensure the national representation of the compiled CCI. Previous studies on the CCI for
4 3
CHAPTER 1
THEORETICAL FOUNDATION AND LITERATURE REVIEW OF CONSUMER CONFIDENCE INDEX
1.1. Theoretical foundation on consumer confidence index the thesis presents the procedures of developing a CCI in Vietnam, starting by developing a procedure for the consumer confidence survey, identifying the factors which measures consumer confidence in Vietnam, selecting the items for measuring a CCI corresponding to the Vietnamese context. On that basis, the thesis proposes the method of computing a CCI for Vietnam. 1.1.1. Concepts To calculate a CCI for Vietnam, the study carried a nationally 1.1.1.1. Concept of consumer confidence representative consumer confidence survey in November 2017. 4. Research methodology
(1) Data collection: including collection of primary and secondary data; (2) Analysis, aggregation, processing and presenting of information and research results; (3) Scale validation and evaluation of the relevance of the CCI. 5. Contributions of the thesis Consumer confidence or consumer sentiment is a broad concept. Although concepts of consumer confidence vary in different studies, the common about consumer confidence drawn from them is that “consumer confidence is a subjective measure of consumers' perceptions and expectations of the general economic conditions and their income or financial status and has relationship with their own consumption.”. - Adjust and validate measurement of consumer confidence suitable to 1.1.1.2. Concept of consumer confidence index the Vietnamese context;
- Propose sample selection for the consumer confidence survey in Vietnam to compute a nationally representative CCI. In addition, the thesis develops a procedure for calculating sample weight for the consumer confidence survey to ensure the better representation of the selected sample. indicator
A Consumer Confidence Index is a statistical indicator used to measure the consumer confidence. Countries in the world have different definitions of CCI, but the common shared by them is that “A Consumer Confidence Index is an important statistical to measure consumers' perceptions and expectations regarding the overall economy (including employment and inflation), individuals'/households' financial situation, savings and/or buying intentions (durable goods) at present and in the future”.
1.1.2. Approaches related to consumer confidence
In the literature, there are two main approaches related to consumer confidence. - Identify the calculation method of the CCI for Vietnam. The thesis goes further to validate the national CCI, regional and urban/rural CCI via comparing the calculated CCI with socio-economic indicators at the national, and regional and urban/rural levels to prove that the proposed index reflects approximately the economic picture of the whole country as well as regions and urban/rural areas of Vietnam. 6. Structure of the thesis
Apart from Introduction, Conclusion, and Appendices, the thesis consists income hypothesis. Under of 3 chapters:
Chapter 1. Theoretical foundation and literature review of a CCI.
Chapter 2. Development of a procedure for consumer confidence survey The first approach is the classical theory of consumption behavior called life- cycle permanent this hypothesis, consumers’ expenditures depend on their permanent income and transitory changes in their income make no impact on consumption. Hence, consumer confidence has no role in predicting actual consumption. and scale for measurement of consumer confidence in Vietnam.
Chapter 3. Calculation method and validation of the proposed CCI for Vietnam. The second approach is psychological motives reflected by Katona’s theory which forms the basis for the compilation of CCI to measure consumer's willingness to buy. In Katona's viewpoint (Katona, 1951; 1960; 1975), consumers'
6 5
survey, there is a need to balance the available resources (costs, manpower) and the quality of the survey. Accordingly, the questionnaire of the consumer confidence survey needs to meet fundamental criteria (with special attention to the survey questions, the length of the questionnaire, the reference period used in the questions) and the survey sample (nationally representative sample survey).
1.1.5.2. Theoretical foundation of development of consumer confidence scale
buying behavior is not only completely determined by objective conditions such as income (ability to buy) but also depends on subjective factors such as attitudes and mood (willingness to buy). An individual’s consumption depends on their confidence in their future financial condition. If attitudes change, consumption will change, even when consumers’ ability to buy is unchanged. Willingness to buy is also affected by unquantifiable or non-economic factors, such as political crises or wars. Accordingly, a decline in confidence can lead to a drop in spending in a way not predicted by economic variables. Katona’s viewpoint is also shared and agreed by Acemoglu and Scott (1994), and Eppright et al. (1998). 1.1.3. Factors measuring consumer confidence
To measure an abstract concept, it is necessary to develop a scale. DeVellis (1991) provides guideline for developing measurement scales with eight-steps. Besides, after obtaining a set of items, it is necessary to continue to conduct exploratory factor analysis (EFA) to determine factors underlying this set of items. Researchers can employ confirmatory factor analysis (CFA) to reaffirm the relevance of the scale with actual data. 1.1.5.3. Principles for constructing a consumer confidence index
When constructing a CCI, it is necessary to ensure the following five principles: Targetting; inheritance; feasibility; consistency and comparability.
1.2. International researches on consumer confidence index
Since consumer confidence is an interaction between economic and psychological factors (Curtin, 2000) and is an abstract concept, the theory of behavioral economics (Katona, 1951) and empirical studies (Matsusaka & Sbordone, 1995; Santero & Westerlund, 1996; Knack & Keefer, 1997; Utaka, 2003; Kwan & Cotsomitis, 2006; Vuchelen, 2004; Gelper và cộng sự, 2007; Van Aarle & Kappler, 2012; Dée & Brinca, 2013; Demirel & Artan, 2017; Curtin, 2000; McIntyre, 2007) show that factors reflecting consumer confidence includes: income, inflation, economic growth, unemployment, savings, purchase of durables. 1.2.1. Consumer confidence surveys and calculation methods of consumer confidence index in the world 1.1.4. Role of consumer confidence index 1.2.1.1. Characteristics of consumer confidence survey
A CCI plays an important role in predicting periods of strong economic volatility, helping to identify people's views on future economic development. A CCI provides important information about expectations. This information is related to the emergence of a wave of optimism or pessimism, which is a critical factor of the business cycle, helping a CCI to forecast consumption from which contributes to forecasting indicators such as GDP and Consumer Price Index (CPI). Consumer confidence survey is a sampling one, only collecting qualitative information related to consumer perceptions of a number of such topics as the Overall economy, consumers' perception of their personal income/financial status, plan for purchases, and/or savings. Therefore, to quantify consumer confidence, the questionnaire of the consumer confidence survey needs to be designed so as to measure consumers' attitudes and expectations of the above topics. The questions are often in the form of qualitative, mostly closed questions, with the answers given in Likert scale, from very positive to very negative. 1.1.5. Theoretical foundation for compilation of consumer confidence index 1.1.5.1. Theoretical foundation of consumer confidence survey
Direct and indirect methods of data collection are applied. The sample frame of the consumer confidence survey is often determined by the method of data collection. The most common sampling method is stratified random sampling. Its sample size is usually smaller than the quantitative surveys. The sample is A CCI is calculated from the results of a consumer confidence survey. Therefore, in order to have a reliable CCI, it is necessary to ensure the quality of the consumer confidence survey. In order to optimize the consumer confidence
8 7
accordance with international recommendations. nationally representative. In terms of the frequency, the consumer confidence survey is often conducted on a monthly, quarterly or biannual basis. 1.4. Lessons learnt and proposed procedure for constructing a consumer confidence index in Vietnam 1.4.1. Lessons learnt from international experiences 1.2.1.2. International experiences in consumer confidence survey and calculation methods of consumer confidence index
From the experiences of conducting consumer confidence surveys and and compilation of consumer confidence index of many countries in the world as well as based on the guidance of the European Commission and UNSD, some lessons can be drawn as follows:
Based on the differences in the use of reference periods accross countries, it is possible to divide the countries that have conducted consumer confidence surveys and compiled a CCI into three main groups as follows: (1) Group 1: Countries using the harmonized European Commission questionnaire; (2) Group 2: Countries using a 12-month and longer reference period; (3) Group 3: Countries using the six-month reference period.
• Consumer confidence survey Survey sample: The sample frame for this survey should be taken from the household list of the population census or statistical registration. The target population is total adults. The sample size of this survey should not be less than 1,000 observations. Regarding sampling selection, it is recommended to use stratified random sampling technique. Also, it is necessary to calculate the survey sample weights after data collection.
The group 1 uses net balance (weighted) method to calculate its CCI. The groups 2 and 3 employ three main methods to calculate their CCI including: net balance (weighted and unweighted), diffusion and relative value. 1.2.2. Guidelines of international organizations on consumer confidence survey The European Commission and the United Nations Statistical Division (UNSD) provide recommendations on the sample frame and sample size, sampling selection, time of survey, measures to increase the rate of respondents; methods to deal with non-response cases; method to calculate weights of the survey, and method to design and use words in the questionnaire. 1.3. Researches on consumer confidence index in Vietnam For the questionnaire, all questions from the European Union Harmonized Program should be used. The reference period used in the questionnaire should be 12 months. Regarding the survey method and timing: it is necessary to determine the survey method suitable with the practical conditions of each country to ensure a high response rate. The timing of the survey should be the same in all countries.
• Compilation of consumer confidence index In the world, there are currently 3 methods of calculating CCI, including: net balance (weighted and unweighted); Diffusion index and Relative value. Net balance: is the difference between positive and negative answering options for each question, measured as percentage points of total answers.
respondents without percentage any the of is Net balance (unweighted): If PP denotes the percentage of respondents having chosen the option “very positive”; P, E and M denote the percentages of respondents having chosen respectively the option positive, neutral and negative; MM is the percentage of respondents having chosen the option “very negative” and N opinion (PP+P+E+M+MM+N=100).
If a question has five different answer options, net balance (unweighted) Three organizations in Vietnam have conducted studies on a CCI. They are: the National Center for Socio-economic Information and Forecast - Ministry of Planning and Investment (NCEIF), ANZ Bank, and Nielsen. Literature review of the research on CCI in Vietnam shows that although certain results have been achieved, studies in Vietnam still reveal limitations. The CCI in these studies was calculated only for Hanoi, or for urban areas, or only represents a group of Internet users due to unrepresentative samples. Wordings and the reference periods in each item used to calculate the CCI also need to be improved. The studies have not yet conducted scale validation to select the appropriate items for compilation of a suitable to the Vietnamese context. In terms of the consumer confidence survey, the sample frame and the survey subject of these studies still reveal shortcomings. None of the researches on CCI in Vietnam has developed a procedure for calculating sample weights to ensure better representation of the CCI in follows the formula:
10 9
Bn = (PP + P) − (M + MM) (1) CHAPTER 2 DEVELOPMENT OF A PROCEDURE FOR If a question has three different answer options, net balance (unweighted) is calculated as follows: CONSUMER CONFIDENCE SURVEY AND SCALE IN VIETNAM Bn = P − M (2) Net balance (weighted): net balance (weighted) is only used for questions with 5 different answer options. The formula is as follows: Bn = (PP + ½P) − (½M + MM) (3) 2.1. Development of a procedure for consumer confidence survey in Vietnam 2.1.1. Rationale for proposal, principles, objectives and requirements for the consumer confidence survey in Vietnam 2.1.1.1. Rationale for proposing a consumer confidence survey in Vietnam
Net balance can vary from -100, when all respondents choose the “very negative” option to +100, when all respondents choose the “very positive” option. When the net balance is higher than 0, the respondents are optimistic. The consumer confidence survey is proposed based on the three reasons: (1) Derived from international experiences; (2) Derived from limitations of the studies in Vietnam; (3) Based on the results of consultations with experts. 2.1.1.2. Principles for organization of consumer confidence survey in Vietnam Diffusion index: is the net balance plus 100. The formula that links the Consumer confidence survey in Vietnam should ensure the following balance to the index is as follows: Dn = Bn + 100 (4)
principles: (1) Feasibility; (2) Consistency; (3) Relevance. 2.1.1.3. Objectives and requirements for the consumer confidence survey in Vietnam
Diffusion index can vary from 0, when all respondents choose the “very negative” option to + 200, when all respondents choose the “very positive” option. When the diffusion index is higher than 100, the respondents are optimistic.
RVn =
(5)
Survey objectives: to collect information related to consumers’ perceptions of their personal income, spending, purchases, and the general economic development situation, changes in prices, and the unemployment situation of the country at present as well as their future expectations or plan to calculate a CCI. Relative value: is the percentage of respondents reporting a “positive” answer divided by the percentage of respondents reporting a “positive” answer adding it to the percentage of respondents reporting “negative”. The formula is the following: Requirements for the survey: Consumer confidence survey needs to satisfy 4
requirements. 2.1.2. Consumer confidence survey to collect data for compilation of the consumer confidence index in Vietnam Depending on the country's settings, CCI is constructed based on from 4 to 10 questions. A CCI is the average of items used to calculate the present situation index and expectations index based on the corresponding calculation methods.
1.4.2. Proposed procedure for constructing a consumer confidence index in Vietnam
This is a nationally representative household sampling survey. The sampling units of the survey are the actual residents in the age ranging from 16 years or older, who decides household spending. Reporting units are the selected households. Data collection lasted for 10 days, from 01 to 10/11/2017. Methods of data collection was direct interview. The sample frame was taken from the 2014 inter-census combined with the 2017 labor force survey. The sample size was allocated to ensure national representation. In terms of the sample size: 1,110 adults aged 16 and older were selected. The thesis used a combination of multi- stage sampling strategy with random selection (systematic and simple). The procedure of constructing a CCI in Vietnam follows five steps as follows. Step 1: Overview of theoretical foundation and empirical studies; Step 2: Development of a procedure for consumer confidence survey; Step 3: Development of a scale for measuring consumer confidence; Step 4: Validation of consumer confidence scale; Step 5: Compilation of CCI and evaluation of the relevance of the index.
12 11
2.2. Development and validation of a scale for measuring consumer confidence index in Vietnam 2.2.1. Development of consumer confidence scale The questionnaire was sent to enumerators in the selected provinces together with the Guidelines on how to record the questionnaire 10 days before the survey. Enumerators have deep professional knowledge, good interviewing skills, especially extensive experience in date collection. Response rate reached 100%. 2.2.1.1. Consultation with experts for scale development 2.1.3. Procedure for calculation of sample weights and respondent profiles 2.1.3.1. Procedure for calculation of sample weights
Consultation with experts aimed at: (1) helping researchers reaffirm the definition of the phenomenon; (2) evaluating the items’ clarity and conciseness; (3) pointing out ways of tapping the phenomenon that researcher have failed to include.
The sample weights are calculated following three steps: (1) Calculating designed weight based on the probability of selecting the sampling units of each sample stratum; (2) Calculating the corrected weight according to the population structure (weighting according to the proportion of the studied population); (3) Calculate the general weight. 2.1.3.2. Respondent profiles • Consultation with experts about the consumer confidence scale The thesis used the consumer confidence questionnaire of the European Commission as rough scale, including six dimensions: (1) Overall economy; (2) Income; (3) Employment; (4) Commodity prices; (5) Purchases; (6) Savings. Data collected from the fieldwork allow to calculate sample weights by region, urban/rural and gender of the respondents. Table 2.1. Demographic profile of respondents Before weighting After weighting
• Results of in-depth interviews with experts Findings from the in-depth interviews revealed that consumer confidence in Vietnam should include six dimensions as the international standards. They were classified in the descending order as follows: (1) Individual income; (2) Employment situation; (3) Overall economy; (4) Commodity prices; (5) Purchase/Repair/Travel; (6) Savings. Most of the experts agreed that a CCI for Vietnam should comprise both present situation and expectations components. Moreover, six dimensions should be used in both components. Regarding reference period used in the items, most experts advised the use of last 12 month and next 12-month period as reference. However, some experts also proposed to supplement a number of items with reference period of last 3 years and next 3 years for several items. Therefore, such dimensions as individual income, overall economy and employment situation both had reference period of last 12 months and next 12 months as well as last 3 years and next 3 years.
2.2.1.2. Asking a group of people who were similar to actual survey respondents
Total Region Red River Delta Northern Midlands and Mountains North Central and South Central Coast Central Highlands South East Mekong River Delta Urban/rural Urban Rural Gender Male Female Number (Persons) 1110 240 180 180 120 210 180 555 555 546 564 Percent (%) 100,0 21,6 16,2 16,2 10,8 18,9 16,2 50,0 50,0 49,2 50,8 Number (Persons) 1110 256 139 236 64 203 212 393 717 535 575 Percent (%) 100,0 23,0 12,5 21,3 5,8 18,3 19,1 35,4 64,6 48,2 51,8 Source: Authors’ calculation. Findings from the in-depth interviews were used to create a questionnaire for a pilot survey with a small sample of 143 consumers in several provinces and cities. The objective of this pilot survey was to check the meaning and clarity of the questions.
14 13
2.2.2. Validation of consumer confidence scale
GC4 Expected electricity price over next 12 months
2.2.2.1. Methods of scale validation
Savings
TK1 Saving interest rates over next 12 months
TK2 Opportunity to save at present
TK3 Ability to save over next 12 months
The thesis assessed the internal reliability of the scale by using Cronbach alpha; Exploratory Factor Analysis (EFA) and Confirmatory Factor Analysis (CFA) were employed to assess measurement validity.
TK4 Household saving situation at present
2.2.2.2. Results of validation of consumer confidence scale
MS1 Appropriate moment to make major purchases at present
Purchase, repair, travel
MS2 Plan for major purchases over next 12 months
MS3 Plan for travelling over next 12 months
MS4 Plan for purchase or building of house over next 12 months
MS5 Plan for home improvements or renovations over next 12 months
Source: Authors’ suggestion.
All of the items belonging to six dimensions, including individual situation, overall economy, commodity prices, income, employment purchase/repair/travel, and savings identified from the in-depth interview with experts were used in the scale validation of consumer confidence to identify the most suitable items to construct CCI for Vietnam. As shown in Table 2.2, the initial scale that measured consumer confidence in Vietnam comprised six dimensions with 25 items totally.
Table 2.2. Measurement of consumer confidence
Topic
Code
Items
TN1 Change of individual income over the last 3 years
Individual income
TN2 Change of individual income over the last 12 months
TN3 Expected change of individual income over next 3 years
TN4 Expected change of individual income over next 12 months
KT1 Change of general economic situation over the last 3 years
Overall economy
KT2 Change of general economic situation over the last 12 months
• Reliability assessment The thesis applied Cronbach alpha method for preliminary reliability assessment of items. The results showed that Cronbach alphas of dimensions (except the dimension “Savings”) were good, ranging from 0.68 to 0.93. Specifically, Cronbach alpha of “Individual income” was 0.86, “Overall economy” was 0.85, “Employment opportunity” was 0.93, “Prices” was 0.72, and Purchase/Repair/Travel was 0,68. In the dimension “Savings”, item TK1 "Saving interest rates over next 12 months" and TK2 “Opportunity to save at present” were dropped one by one due to low corrected item-total correlation (< 0.3) and higher Cronbach alpha if item deleted than Cronbach alpha of the dimension. Hence, 23 items of 6 dimensions remained.
KT3 Expected change of general economic situation over next 3 years
KT4 Expected change of general economic situation over next 12
months
• Validity assessment - Results of EFA
TV1 Employment situation over the last 3 years
Employment situation
TV2 Employment situation over the last 12 months
TV3 Expected employment situation over next 3 years
TV4 Expected employment situation over next 12 months
Prices
GC1 Evolution of commodity prices over last 12 months
GC2 Expected evolution of commodity prices over next 12 months
GC3 Expected gas price over next 12 months
23 items remaining after reliability assessment were subjected to EFA. A six-factor solution emerged at first. Items TK3 and TK4 of the dimension “Savings”, items GC3 and GC4 of the dimension “Prices”, and items MS1, MS2 and MS3 of the dimension “Purchase/Repair/Travel" were dropped due to low factor loading and/or cross-loading. Therefore, 16 items remained and 5 factors emerged, the five-factor solution explained 66.6% of the total variance. 16 items of the 5 factors had factor loadings greater than the threshold of 0.7 (except TN4 had factor loading of 0.64), showing that items were really
16 15
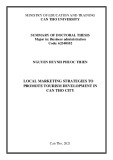
In addition, the results showed that all values of MSV were smaller than those of AVE, and values of square root of AVE in the diagonal were greater than factor’s correlation coefficients. Therefore, the divergent validity of the scale was reached. Two factors "Prices" and "Purchase" showed their uni- dimension. The results are presented in Figure 2.1 below. important in factors and items had high reliability. In addition, Cronbach alpha of each factor was satisfactory (> 0.7 and < 0.95), which allowed to conclude that the scale was appropriate for measuring consumer confidence index in Vietnam. These factors were named as follows: Factor 1: Employment; Factor 2: Individual income; Factor 3: Overall economy; Factor 4: Prices; Factor 5: Purchase.
In addition, the thesis conducted EFA with these 16 items for each region to check validity reliability at the regional level. The EFA results showed that when disaggregating to the regional level, almost all of the items had high factor loadings (> 0.5), except for Region 2 with two items KT1 and KT3 of lower than 0.5 factor loadings, and there was no cross-loading. This shows that the factors are different even at the regional level. This helps confirm the data set conducted from the consumer confidence survey and the consumer confidence scale are reliable. - Results of CFA
16 items of 5 factors extracted from EFA were subjected to CFA to check the consistency from EFA. The fit indices in the initial results of CFA were not met. Specifically: CMIN/DF = 12.596 > 5; GFI = 0.880, TLI = 0.867, IFI = 0.896, and CFI = 0.895 which are all < 0.9; AGFI = 0.826 > 0,8 and RMSEA = 0.102 > 0.08. After linking residuals of items in each factor, the results of CFA exhibited an acceptable level of fit for the measurement models as presented in Table 2.3. Table 2.3. Results of level of fit for measurement model
χ2
df
χ2/df GFI AGFI TLI
IFI
CFI SRMR RMSEA
398.423
82
4.859 0.956 0.927 0.956 0.970 0.970 0.025
0.059
Figure 2.1. Results of the second CFA for consumer confidence scale Source: Authors’ calculation. Source: Authors’ calculation.
2.2.3. Assessment of the results of scale validation
Composite reliability (CR) of all factors was greater than 0.7 (Roussel et al., 2002), indicating that the scale reliability was ensured. Average Variance Extracted (AVE) of all factors was greater than 0.5 and standardized factor loadings of all items were greater than 0.7 and statistical significant, meaning that convergent validity of the scale was good (Fornell & Larcker, 1981). The results of the scale validation showed that scale of consumer confidence in Vietnam consisted of 5 factors, including: (i) Individual income; (ii) Overall economy; (iii) Employment; (iv) Prices; and (v) Purchase. Compared to international standards and the initial 6 factors
18 17
CHAPTER 3:
CALCULATION METHOD AND VALIDATION OF THE PROPOSED CONSUMER CONFIDENCE INDEX FOR VIETNAM 3.1. Calculation method of consumer confidence index in Vietnam
3.1.1. Proposed options for calculation of consumer confidence index in Vietnam "Purchase" were related factor the of to
identified from the in-depth review, factor "Savings" was inappropriate for the Vietnamese context. Moreover, in comparison with the previous studies on CCI in Vietnam, i.e. studies conducted by NCEIF, ANZ Bank and Nielsen, the results of scale validity in this study showed that one new factor, which was "prices", was found. For "Purchase" factor, when using the data set collected from the author’s consumer confidence survey, two items house purchase/building/improvements/renovations, which were different from those related to the assessment of the moment to buy durable goods used by other Vietnamese research organizations (ANZ and Nielsen).
The results of scale validation show that consumer confidence in Vietnam is measured by five dimensions with 16 items. There are many options of combining 16 validated items to calculate a CCI for Vietnam. When proposing the options for computing a CCI, the thesis will separate items of a 3-year reference period from items with the same content but of a 12-month reference income, Overall economy, and period for such factors as Individual Employment. The thesis then combines these items with those of other factors which have 12-month reference period, such as Prices and Purchase into the same calculation option. For the factor “Purchase”, only one of the two items of this factor is used in the calculation of CCI for Vietnam with the argument that if a person has chosen to buy or build a house, there is very little possibility he or she repairs/renovates a house and vice versa since houses are valuable assets. With the combination as explained above, the thesis proposes 8 options for calculating a CCI for Vietnam. 3.1.2. Computation of a consumer confidence index in Vietnam
The thesis applies all three calculation methods which are currently used to compute a CCI, including: net balance (weighted and unweighted), diffusion, and relative value to apply in Vietnam. The thesis compiled overall CCI, present situation index, and expectations index following the 8 proposed options.
3.1.3. Comments on methods used to calculate a consumer confidence index for Vietnam based on different options
For all 8 proposed options for calculating a CCI, some conclusions can be drawn: Firstly, the results show that, after using sample weight, the overall CCIs calculated based on the three calculation methods are lower than before. This indicates that there are differences of CCIs before and after employing
20 19
respondents' educational level is still far behind that of developed countries, the use of weighted net balance is not suitable. Thirdly, the unweighted calculation method is, in nature, similar to the diffusion index method which is being used by other countries in Southeast Asia. The use of unweighted net balance helps ensure international comparability of the proposed CCI with Southeast Asian countries. sample weight. Secondly, similarities of all three calculation methods can be found. All methods of calculating CCIs reflect consumers' optimism. Thirdly, there is a difference between CCIs calculated from items of 12-month reference period compared to those calculated from items of 3-year reference period. Fourthly, there are differences of CCIs according to calculation methods. Fifthly, CCIs calculated based on weighted net balance are always different from those of other calculation methods. 3.2. Analysis and validation of the proposed consumer confidence index in Vietnam 3.1.4. Proposed methods for calculating a consumer confidence index for Vietnam 3.2.1. Analysis and validation methods
For national CCI: the thesis compares the overall index, the present situation index and the expectations index with the economic picture presented through such socio-economic indicators as GDP growth rate, CPI, and unemployment rate of working-age laborers to see if the CCI reflects correctly the actual national economic status. Among the 8 calculation options, the thesis proposed to choose the unweighted net balance calculation method which combined 8 items of 4 factors, i.e. Individual income, Overall economy, Employment and Prices with reference periods of the last 12 months and the next 12 months, in which 4 items belong to the present situation index and 4 items belong to the expectations index. The thesis made such a choice for the following reasons:
In order to analyze and assess the relevance of regional and urban/rural CCIs, the thesis examines the differences of CCIs according to different sub- groups. After that, the thesis compares CCIs with socio-economic indicators in the respective sub-groups. Firstly, all of the items used to calculate a CCI should have the reference period of the last 12 months and the next 12 months 12 to ensure the stability of respondents' answers, eliminate the seasonal factor, as well as ensure the international comparability the calculated CCI. 3.2.2. Validation of the proposed consumer confidence index for Vietnam 3.2.2.1. Validation of the national consumer confidence index The overall CCI, present situation index, and expectations index were 18.8%; 17.8% and 19.7%, respectively. All reflect consumers' optimism.
Secondly, the literature review indicated that although two items of the factor “Purchase” proved their relevance to the Vietnamese setting, they were not used to calculate CCIs in other countries. This is because these two items were used to monitor the purchase/repair/renovation of houses in other countries. For a developing nation like Vietnam, care should taken in using these two items in calculating a CCI as houses are valuable assets and thus not everyone can buy, repair, or renovate them. If these two items are used to compute a CCI, the results can be biased. the same
If comparing the present situation index and expectations index compiled from the consumer confidence survey with data on GDP growth rate, unemployment rate of the working-aged laborers, and CPI, it could be seen that indexes of the present situation index's items and expectations index's items trend with the corresponding socio-economic data. revealed Specifically, Vietnam GDP growth rate in 2017 was 6.81%, higher than that in 2016 (6.21%). This coincided with respondents' assessment of better Vietnam's economic performance in 2017 in the present situation index. Data on GDP growth rate in 2018 reached 7.08%, the highest GDP growth rate in the last 11 Thirdly, the unweighted net balance was proposed to compile Vietnam’s CCI for its predominance over other calculation methods. Firstly, more than half of the countries in the world are using this method. Secondly, the formula for calculating a CCI based on weighted net balance shows that a CCI is very sensitive to the extreme answers. In the current Vietnamese setting, when the
22 21
years. This helped explain why consumers were so optimistic of the economy over the next 12 months.
Regarding the unemployment rate, data revealed that in almost all regions, an improvement in 2017 employment was found (except for South East where witnessed an increase in unemployment rate of working-aged laborers). This explained why respondents felt optimistic about employment situation compared to the previous 12 months. Moreover, the three regions with the lowest CCI (North Central and South Central Coast, South East, and Mekong River Delta) also had higher unemployment rate of working-age laborers than other regions. This was the reason behind the fact that although consumers in these three regions were optimistic about the employment situation, their levels of optimism was lower than those of consumers in others.
In terms of consumers’ perceptions of employment situation and commodity prices, it was clearly shown that their opinions were consistent with data on unemployment rate of working-aged laborers and CPI. Specifically, both indexes of employment situation in current and future demonstrated respondents’ optimism of present and future employment situation (18.7% and 19.8%, respectively). Data on unemployment rates of working-aged laborers in 2017 was 2.24%, lower than 2.30% in 2016. Also, CPI data showed that the CPI in 2017 was higher than that in 2016 (3.53% versus 2.66%), CPI in 2018 also reflected increasing trend when standing at 3.54%, higher than 3.53% of 2017. It can be said that data were consistent with consumers’ assessment of increasing commodity prices. 3.2.2.2. Validation of regional and urban/rural consumer confidence indexes Regional CPI data in 2016 and 2017 also indicated that except for Northern Midlands and Mountains, other regions witnessed an increase of CPI in 2017 as compared to 2016. This was consistent with consumers’ assessment of increasing commodity prices over the last 12 months. Additionally, three regions with the lowest CCI were also those which had higher CPI than others. • By region • By urban/rural
CCIs calculated from the consumer confidence survey show that the overall CCIs of urban and rural areas are 11.1% and 23.0%, respectively. The present situation index and expectations index of the urban areas are 10.1% and 12.1%, respectively. These two respective indexes of the rural areas are 22.0% and 23.9%, respectively.
The results of calculating regional CCIs from the consumer confidence survey showed that the CCI was highest in the Central Highlands (39.5%), followed by the Northern Midlands and Mountains (38.4%), the Red River Delta (33.8%), Mekong River Delta (14.4%), South East (8.0%), and lowest in North Central and South Central Coast (-1.5%). The one-way ANOVA test results showed that the CCIs were statistically different at a confidence interval of 95% across the six regions of Vietnam.
The result of the independent-samples T-test show that with the current sample, at the 5% significance level, the CCI of urban areas is significantly smaller than that of rural areas.
The thesis then compared regional CCIs with region-disaggregated GDP growth rate, unemployment rate of working-aged laborers, and CPI. The two regions with the lowest present situation indexes - North Central and South Central Coast region, and South East region -had the lowest change of GDP growth rate in 2017 over 2016 compared to other regions (0.44% and 0.57%, respectively). Central Highlands, Red River Delta, and Northern Midlands and Mountains were the three regions with the highest present situation indexes and they were also the regions with the highest change of GDP growth rates in 2017 over 2016 (1.72%, 1.36%, and 0.9% respectively).
To compare urban and rural CCIs with urban/rural CPI, it can be seen that in 2017 CPI of the urban areas were higher than that of rural areas (103.74 compared to 103.32). Since the prices in urban areas increased more than those in rural areas, the perceptions of the urban people about the price increases were different from those of the rural people. It was this factor that contributes to the lower CCI in urban areas. In terms of employment situation, data from the consumer confidence surveys showed that people in rural areas were more optimistic when assessing the employment situation at the present time compared to the previous 12 months and in the future compared to the current
24 23
CONCLUSION
The thesis has completed and solved the following contents:
time. Data released by the General Statistics Office showed that the unemployment rate of working-aged laborers in urban areas was higher than that in rural areas (3.23% compared to 1.84% in 2016; 3.18% compared to 1.7% in 2017, 3.10% compared to 1.74% in 2018).
(1) Present the theoretical foundation and literature review of domestic and international studies related to consumer confidence and methods of calculating consumer confidence index. 3.3. Assessment of the results of computation of CCI for Vietnam and recommendations (2) Develop a procedure for consumer confidence survey. 3.3.1. Assessment of the results of computation of CCI for Vietnam (3) Develop and validate consumer confidence scale in Vietnam. (4) Propose a method of calculating a CCI in Vietnam. (5) Calculate a CCI in Vietnam and analyze and validate the relevance of the proposed CCI. From the analysis and assessment of the relevance of the proposed CCI for Vietnam presented in sections 3.2.2.1 and 3.2.2.2, it can be seen that the proposed CCI reflects approximately the socio-economic picture as shown through such indicators as GDP growth rate, CPI and unemployment rate of working-aged laborers at both national and regional or urban/rural levels. 3.3.2. Recommendations and solutions for calculation of a CCI in Vietnam
The thesis proposes recommendations related to: (1) The consumer confidence survey; (2) Methods of calculating a CCI; (3) Use of the results of the consumer confidence survey; (4) Policies for economic development through demand stimulus.
(6) The thesis proposes recommendations, including: to increase the sample size to be able to conduct sample weight for respondents' age group, and occupation, etc; study and apply CAPI and Big data in data collection; To add consumer confidence survey to the national statistical survey program; To aassign a unit responsible for the consumer confidence survey to calculate the monthly CCI. When there is a time-serie data on CCI, these data should be used to test the correlation between CCI and related socio-economic indicators to determine the business cycle as well as the turning point of the economy. Besides, the thesis suggests that data on business confidence index and consumer confidence index should be employed for short-term forecasts. The data collected from the consumer confidence survey should be further analyzed by demographic or economic characteristics in order to deeply see the impact of these characteristics on the health of the economy.