TNU Journal of Science and Technology
229(03): 51 - 58
http://jst.tnu.edu.vn 51 Email: jst@tnu.edu.vn
THE QUALITY OF ECONOMIC GROWTH IN THE MEKONG DELTA
THROUGH SOME MACROECONOMIC INDICATORS
Nguyen Hoang Trung1,2*
1University of Economics and Law, Viet Nam National University Ho Chi Minh City
2Dong Thap University
ARTICLE INFO
ABSTRACT
Received:
03/8/2023
The article studies the quality of economic growth in the Mekong Delta
through macroeconomic indicators, including economic growth,
income, unemployment rate, poverty rate, life expectancy, mortality
rate, and environment. The study is based on secondary data taken from
the General Statistics Office 2021, the main analysis method is
descriptive statistics, with the analysis of mean, absolute and relative
differences in GDP indicators, income disparity, unemployment rate,
poverty rate, death rate. The results show that the quality of economic
growth is still mainly growth by scale, not growth in depth, the
indicators showing stability and sustainability are not really
satisfactory. Specifically, the unemployment rate is still increasing,
people's health is not in good condition, and environmental pollution is
increasing. The research results provide the basis for suggesting
policies in order to improve the quality of economic growth for the
Mekong Delta.
Revised:
19/9/2023
Published:
19/9/2023
KEYWORDS
Quality of economic growth
Poverty
Mekong Delta
Environment
Income
CHẤT LƯỢNG TĂNG TRƯỞNG KINH TẾ VÙNG ĐỒNG BẰNG
SÔNG CỬU LONG QUA MỘT SỐ CHỈ TIÊU KINH TẾ VĨ MÔ
Nguyễn Hoàng Trung1,2
1Trường Đại học Kinh tế - Luật, Đại học Quốc gia Thành phố Hồ Chí Minh
2Trường Đại học Đồng Tháp
THÔNG TIN BÀI BÁO
TÓM TẮT
Ngày nhận bài:
03/8/2023
Bài viết nghiên cứu chất lượng tăng trưởng kinh tế vùng Đồng bằng sông
Cửu Long thông qua các chỉ tiêu kinh tế vĩ mô, bao gồm tăng trưởng
kinh tế, thu nhập, tỷ lệ thất nghiệp, tỷ lệ nghèo, tuổi thọ, tỷ lệ tử vong,
môi trường. Nghiên cứu dựa trên dữ liệu thứ cấp lấy từ Tổng cục Thống
kê 2021, phương pháp phân tích chủ yếu là thống kê mô tả, với việc phân
tích sự khác biệt trung bình, tuyệt đối và tương đối của các chỉ tiêu GDP,
chênh lệch thu nhập, tỷ lệ thất nghiệp, tỷ lệ hộ nghèo, tỷ lệ tử vong. Kết
quả cho thấy chất lượng tăng trưởng kinh tế chủ yếu vẫn là tăng trưởng
theo quy mô, chưa tăng trưởng theo chiều sâu, các chỉ tiêu thể hiện tính
ổn định, bền vững chưa thực sự khả quan. Cụ thể, tỷ lệ thất nghiệp vẫn
gia tăng, sức khỏe người dân không được tốt, ô nhiễm môi trường ngày
càng gia tăng. Kết quả nghiên cứu làm cơ sở đề xuất các chính sách
nhằm nâng cao chất lượng tăng trưởng kinh tế cho vùng Đồng bằng sông
Cửu Long.
Ngày hoàn thiện:
19/9/2023
Ngày đăng:
19/9/2023
TỪ KHÓA
Chất lượng tăng trưởng kinh tế
Đói nghèo
Đồng bằng sông Cửu Long
Môi trường
Thu nhập
DOI: https://doi.org/10.34238/tnu-jst.8486
Email: nhtrung@dthu.edu.vn

TNU Journal of Science and Technology
229(03): 51 - 58
http://jst.tnu.edu.vn 52 Email: jst@tnu.edu.vn
1. Introduction
The quality of economic growth is a major issue that has attracted the attention of many
domestic and foreign researchers. A study in sub-Saharan Africa suggested that good growth
quality is strong, stable, sustainable growth, increased productivity, and good social outcomes
such as improved living standards for people [1]. This is based on an extensive literature that
discusses different aspects of growth and their importance, such as the sustainability of growth
[2], [3], the volatility of growth [4], [5], and the sectoral and poverty reduction aspects [6]. This
shows that good growth quality is not only at a high level, but also important to improve living
standards and welfare, and create better job opportunities. Therefore, how growth is generated is
crucial for its sustainability and for accelerating job creation and poverty alleviation.
Another study argues that quality growth is high, stable, sustainable, and socially friendly [7].
Following this approach, they developed a growth quality index that focuses on the nature of
growth and the social dimension of growth in relation to poverty reduction and environmental
protection. Recent studies on the quality of economic growth, building upon the findings of
previous research, have conducted a broader analysis, revealing more insights into the nature of
economic growth's quality with considerations for both environmental sustainability and the
mitigation of inequality [8]. These factors are also mentioned in the studies [9] - [11],
emphasizing the significance of environmental preservation and equality in the context of
economic growth's quality.
The above studies show that there are many criteria for measuring the quality of economic
growth. Within the scope of this article's research, we solely focus on analyzing several indicators
related to growth, income, employment, life expectancy, and the environment. This provides an
overview of the economic growth quality of the Mekong Delta.
The Mekong Delta holds a very important position in politics, economy, society, defense,
security, and trade with the Association of Southeast Asian Nations (ASEAN). It has a natural
area of 39,734 km2, accounting for 12.2% of the country's area, and a population of about 18
million people, accounting for 19% of the country's population. The Mekong Delta has about 150
district-level units, more than 1,000 commune-level administrative units, and nearly 10 million
farming households; its economic scale is expanding, reaching about 970 trillion dong in 2020,
accounting for 11.95% of the country's gross domestic product (GDP). Its gross domestic product
(GRDP) per capita reached 56.02 million VND/person/year, and the rate of trained workers
reached 62.8%. It is the largest granary of rice and aquatic products and fruit production in the
country, contributing 31.37% of GDP of the whole agricultural sector and more than 50% of rice
production, 65% of aquaculture production, 70% of fruit, 95% of exported rice, and 60% of
exported aquatic products. It plays an important role in ensuring national food security and
export. At the same time, the region has a lot of potential for oil and gas and renewable energy,
such as wind energy, solar energy, and tidal energy. It also has a system of rivers and canals
interlaced [12]. However, the development of the Mekong Delta has not been commensurate with
the potential, advantages, and investment of the State; the infrastructure has not met the
development requirements; the high-quality human resources have not been properly invested;
and the standard of living has not been met. People's material and spiritual resources are still
limited compared to some regions. Currently, the Mekong Delta is facing many challenges,
especially from the impact of climate change, exploitation and use of water upstream, internal
weaknesses of small production, lack of cooperation and association, infrastructure inadequate in
response to large-scale production requirements, lack of logistics infrastructure for agriculture,
inadequate and ineffective forms of production organization, agricultural cooperatives,
unpredictable market fluctuations with green consumption trends requiring higher and higher
safety standards. The bottlenecks in infrastructure are being invested in, but are still slow to be
put into operation, making the region without new resources for development. In addition, the
TNU Journal of Science and Technology
229(03): 51 - 58
http://jst.tnu.edu.vn 53 Email: jst@tnu.edu.vn
Mekong Delta has been more severely affected by the COVID-19 pandemic than the national
average and always has many potential risks. Therefore, a full analytical assessment is needed to
suggest policies to improve the quality of economic growth for the Mekong Delta. The article
assesses the present quality of economic growth in the Mekong Delta by utilizing crucial
economic indicators. This assessment subsequently forms a foundation for devising policies
aimed at enhancing the quality of growth within the Mekong Delta.
2. Methodology and data
2.1. Methodology
The primary methodology utilized in the article involves descriptive statistics and the average
analysis of criteria such as income and life expectancy. This approach serves to depict the
representative nature of income and life expectancy among the population in the Mekong Delta.
Additionally, the study amalgamates the analysis of absolute and relative fluctuations in GDP,
poverty rates, inequality, unemployment rates, crude death rates, and environmental indicators. The
goal of this comprehensive analysis is to discern the evolving trends of these target variables, with
the overarching aim of assessing the quality of economic growth in the Mekong Delta region.
The criteria selected for this analytical process are succinctly summarized from the studies
presented in the introduction, as these factors collectively constitute the elements that shape the
quality of economic growth. The data obtained from these analyses is visually presented through
graphs spanning multiple years. Following this, the data is systematically aggregated and
extrapolated to formulate policies based on the outcomes of the analysis.
2.2. Data
The data used in the article are mainly secondary data, collected from two sources: the
General Statistics Office in 2021 and the Statistical Yearbook 2021 of the provinces in the
Mekong Delta. The collected indicators include GDP, capital, labor, economic restructuring,
income and inequality, education, health, and environment from 2017 to 2021.
3. Results and discussion
3.1. Economic growth in the Mekong Delta region
Based on calculations by Vietnam's General Statistics Office, the economic growth of the
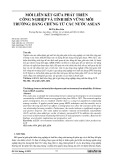
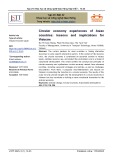
Mekong Delta is depicted in Figure 1, utilizing the GDP changes from 2017 to 2021 as a reference.
Figure 1. GDP growth of the Mekong Delta in the period from 2017 to 2021
(Source: Vietnam Statistical Yearbook 2021)
During the span between 2017 and 2018, the economy of the Mekong Delta exhibited
remarkable growth. The structure of agricultural production shifted towards increasing fisheries
and fruits and reducing rice, gradually forming large-scale concentrated production areas
1
7.63368
7.26022
2.15474
0.37280
-2
0
2
4
6
8
10
2017 2018 2019 2020 2021
GDP (%)
TNU Journal of Science and Technology
229(03): 51 - 58
http://jst.tnu.edu.vn 54 Email: jst@tnu.edu.vn
specializing in the cultivation of key agricultural products (shrimp, pangasius, rice, fruit) in
association with processing and consumption technology along the agricultural value chain. The
plan to restructure the industry was initially implemented in the right direction and effectively,
focusing on developing green, low-emission industries and improving the value of agricultural
products through promoting the processing industry. Many localities had actively implemented a
number of economic models suitable to nature, applying high technology and adapting to climate
change. The economy of the Mekong Delta region, which had slowed down prior to 2019, had
suffered a severe shock from the COVID-19 pandemic. The growth rate dropped sharply from
7.26% in 2019 to only 2.15% in 2020, and further fell to -0.37% in 2021, while the whole
country still maintained a growth rate of +2.6%. Thus, in terms of economic growth, the Mekong
Delta had been more severely affected by the COVID-19 pandemic than the whole country, due
to its specific economic structure. Firstly, although it is not a modern economy, the proportion of
services in the GRDP structure of the Mekong Delta is even higher than that of the whole
country, even in the worst of times during the COVID-19 pandemic. Secondly, the inherent
weakness of the Mekong Delta's industrial sector has hindered the region's economic growth
from reviving. In 2021, the industrial sector dropped drastically (-2.26%), much lower than the
4.05% growth rate of the whole country. Third, the biggest economic bright spot of the Mekong
Delta is the agricultural sector, which maintained positive growth rates in 2020 and 2021, at
2.02% and 1.57% respectively. However, the agricultural sector alone was not enough to revive
the economy of the Mekong Delta because the other two sectors - together accounting for more
than 70% of the GDP of the Region - both grew negatively at a rather deep level.
3.2. Income
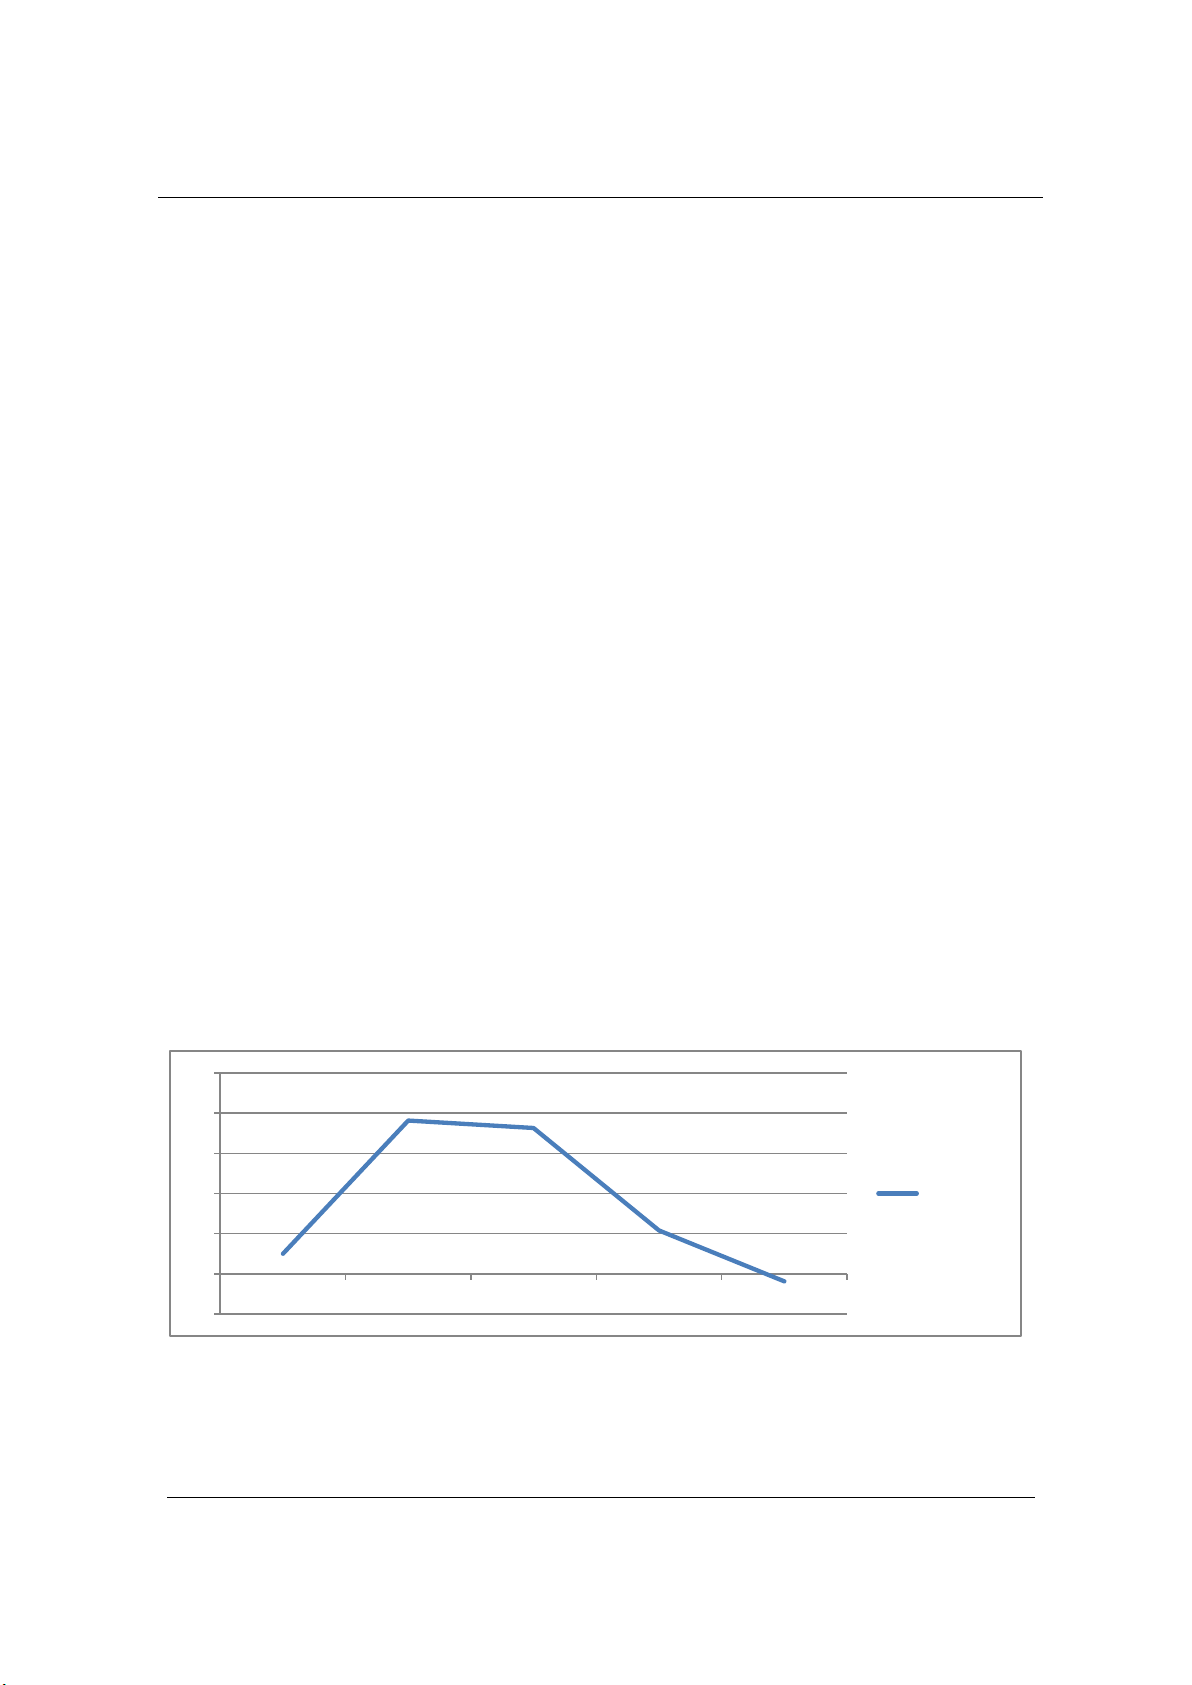
3.2.1. The income of employees working in enterprises
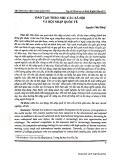
A good economic growth is reflected in many indicators, including the income of workers.
Figure 2 shows that the average income over the years tended to increase, indicating an increase
in scale. However, when considering the growth rate over the years, there was a decreasing trend.
Figure 2. Average monthly income of employees (Unit: million VND)
(Source: Vietnam Statistical Yearbook 2021)
In 2017, there was an increase of 14.03% compared to 2015, followed by an increase of
9.34% in 2018 compared to 2017, in 2019 4.20% compared to 2018, and in 2020 4.17%
compared to 2019. This is due to the fact that the current laborers in the Mekong Delta were
mostly untrained; only about 7% of the total population was at university level, compared with
63% of the whole country, which shows that the training problem and the level of human
resources in the Mekong Delta were very low.
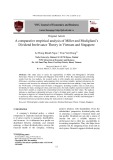
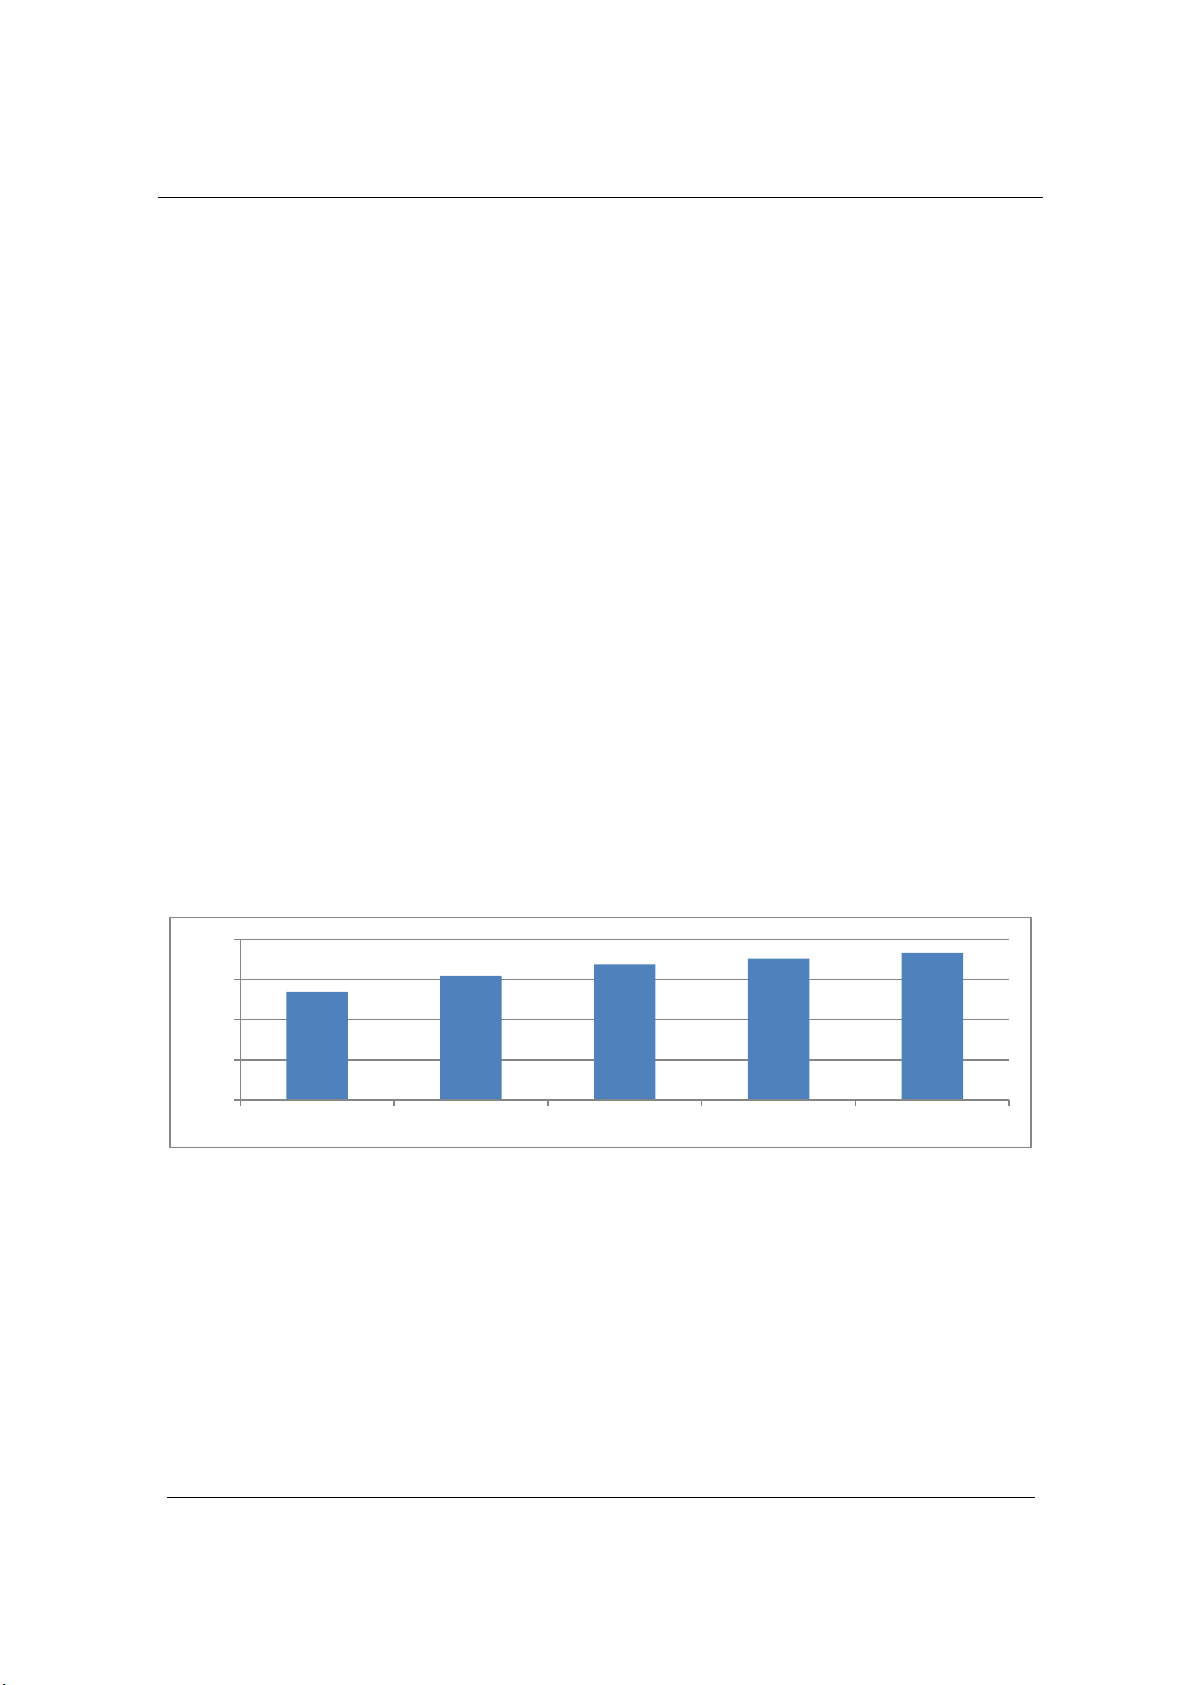
3.2.2. Income disparity
The income gap between the highest and lowest quintiles of regions and the whole country is
illustrated in Figure 3. The results show that the Mekong Delta region had a lower gap compared
to the whole country and ranks fourth compared to other regions.
5380 6178 6755 7039 7333
0
2000
4000
6000
8000
2015 2017 2018 2019 2020
TNU Journal of Science and Technology
229(03): 51 - 58
http://jst.tnu.edu.vn 55 Email: jst@tnu.edu.vn
Figure 3. Income disparity of the Mekong Delta in 2021
(Source: Vietnam Statistical Yearbook 2021)
The Mekong Delta benefits from its distinctive geographical characteristics, fostering
agricultural development and resulting in a lower income disparity. This environment enables
individuals to generate income by creating jobs, even if they are not employed by state agencies
or businesses. When considering economic progress across the localities within the Mekong
Delta, the disparity is comparatively reduced compared to other regions.
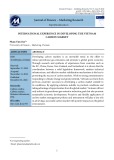
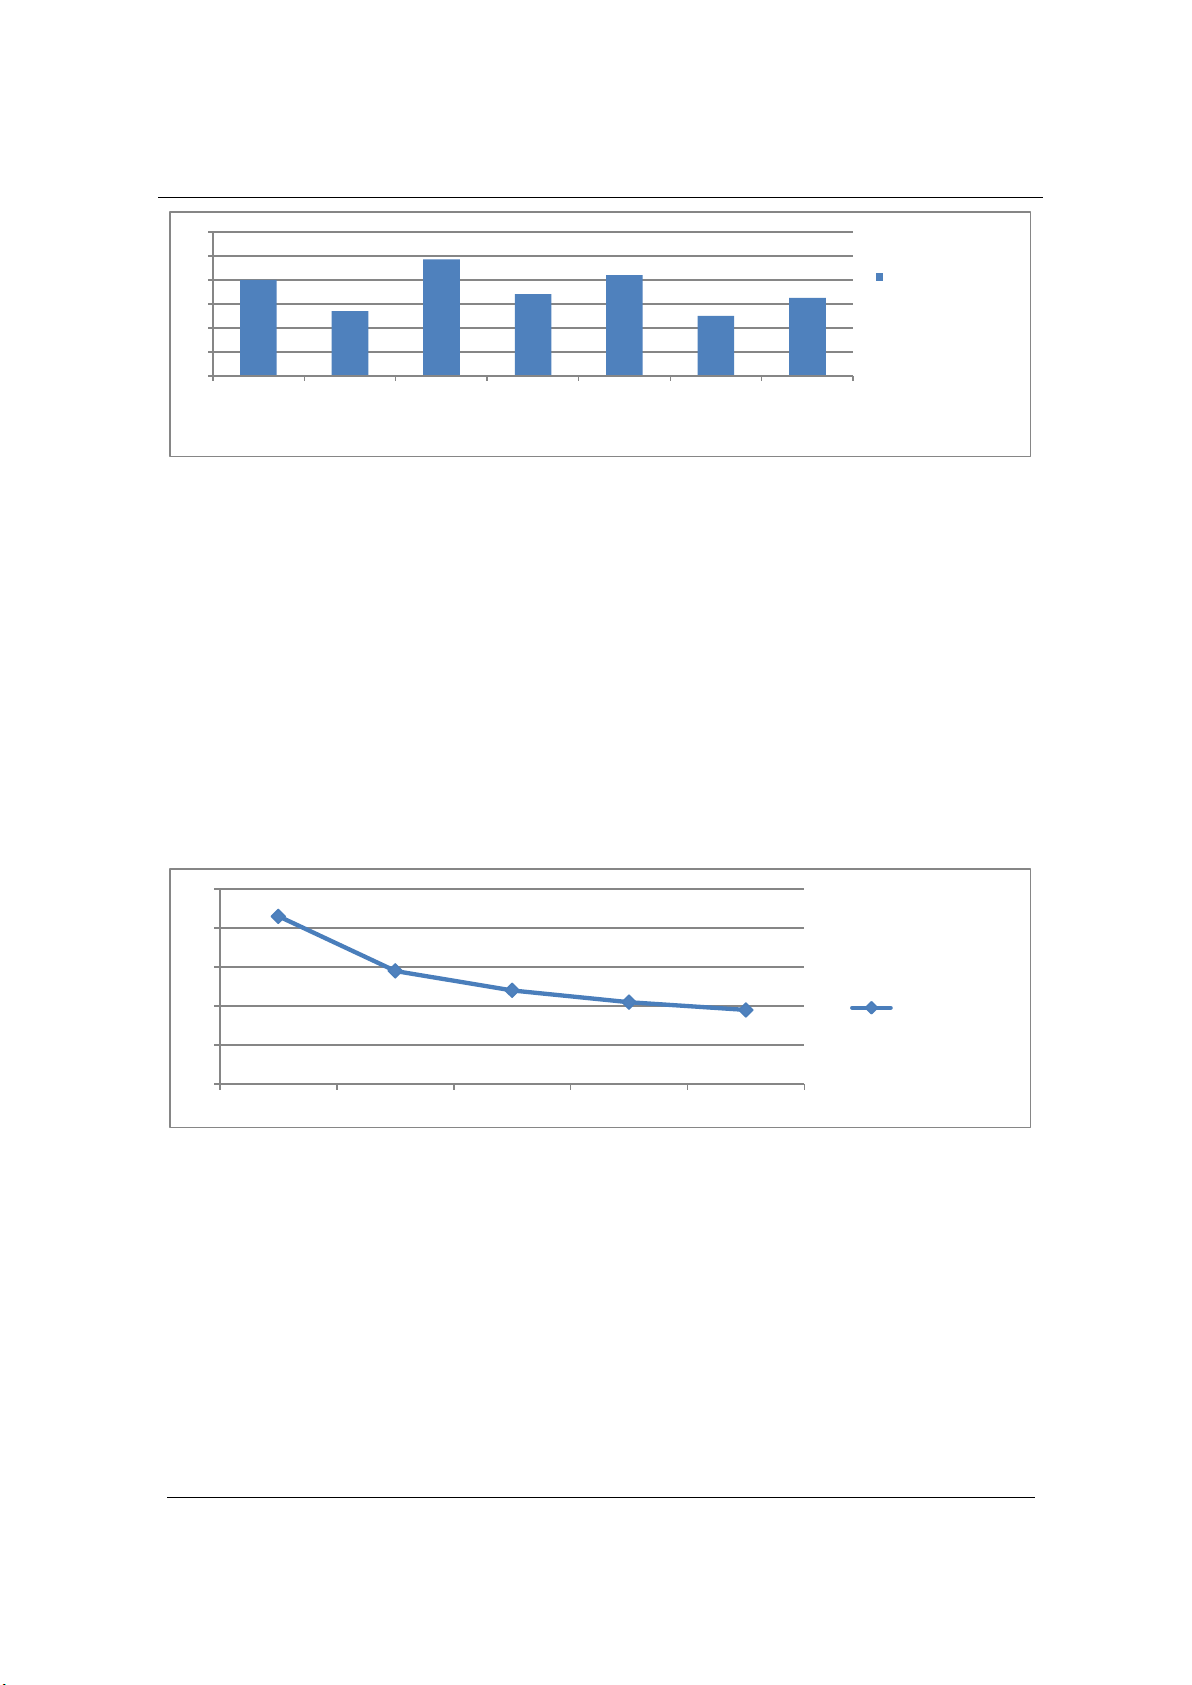
3.3. The rate of households in poverty
By adhering to the Party's and State's policies and resolutions, the authorities of Mekong
Delta's provinces and cities have continuously devised context-appropriate solutions. These
measures encompass a diversified range of support to empower the impoverished in augmenting
their earnings and achieving stability in their livelihoods. Consequently, the Mekong Delta has
witnessed a significant reduction in its multidimensional poverty rate (measured by the extent of
poverty), plummeting from 8.6% in 2016 to 3.8% in 2021 (Figure 4).
Figure 4. Rate of multidimensional poverty in the Mekong Delta
(Source: Vietnam Statistical Yearbook 2021)
Enact the policies and resolutions set forth by the Party and State, various policies have been put
into action to bolster employment opportunities, extend business loans to individuals, provide
training in production techniques, and implement comprehensive solutions. These encompass
policies relating to healthcare, education, housing, clean water, hygiene, and information
communication. Furthermore, several localities have taken on the task of guiding individuals toward
cultivating high-value, economically sustainable crops. This proactive approach aims to establish
resilient livelihoods for rural inhabitants, enabling them to break free from the cycle of poverty.
3.4. The unemployment rate of the Mekong Delta region
The unemployment rate in urban areas is higher than in rural areas and higher than in the
whole region; the reason for this is because urban areas are densely populated, with high
8
5.4
9.7
6.8
8.4
5
6.5
0
2
4
6
8
10
12
Viet Nam Red river
delta
Northern
Midlands and
Mountains
North Central
and Central
Coast
Highlands South East Mekong
Delta
Income difference
between highest and
lowest quintile
(times)
8.6
5.8
4.8 4.2 3.8
0
2
4
6
8
10
2016 2018 2019 2020 2021
multidimension
al poverty rate