
http://www.iaeme.com/IJM/index.asp 43 editor@iaeme.com
International Journal of Management (IJM)
Volume 7, Issue 6, September–October 2016, pp.43–50, Article ID: IJM_07_06_006
Available online at
http://www.iaeme.com/ijm/issues.asp?JType=IJM&VType=7&IType=6
Journal Impact Factor (2016): 8.1920 (Calculated by GISI) www.jifactor.com
ISSN Print: 0976-6502 and ISSN Online: 0976-6510
© IAEME Publication
A STUDY OF FINANCIAL LITERACY AND ITS
IMPACT ON CUSTOMER SATISFACTION WITH
SPECIAL REFERENCE TO BANKS OF BAGALKOT
DISTRICT
Prof. P. K. Gupta
Research scholar, Kousali Institute of Management Studies,
Karnatak University Dharwad, India.
Dr. U. M. Kinange
Professor, Kousali Institute of Management Studies,
Karnatak University Dharwad, India.
ABSTRACT
Financial literacy in simple words is the knowledge about various financial products. Financial
literacy is considered to be an important tool to achieve financial inclusion and hence inclusive
growth. It enables an individual to understand his financial need and hence plan accordingly. The
knowledge of financial concepts is essential for personal financial planning. The S&P Global Fin
Lit Survey shows that Country-level financial literacy ranges from 13% to 71%. Hence the main
objective of this study is to measure the financial literacy of the respondents.
In this study a set of research questions were asked to the respondents to identify the impact of
financial literacy on customer satisfaction towards banking services. It was found that level of
financial literacy was low among the respondents and there is no significant impact of financial
literacy on overall customer satisfaction.
Key words: Financial literacy, financial inclusion, and customer satisfaction.
Cite this Article: P. K. Gupta and Dr. U. M. Kinange, A Study of Financial Literacy and its Impact
on Customer Satisfaction with Special Reference to Banks of Bagalkot District. International
Journal of Management, 7(6), 2016, pp. 43–50.
http://www.iaeme.com/IJM/issues.asp?JType=IJM&VType=7&IType=6
1. INTRODUCTION
The Organization for Economic Co-operation and Development (OECD) has defined financial literacy as
“a combination of awareness, knowledge, skill, attitude and behavior necessary to make sound financial
decisions and ultimately achieve individual wellbeing”.
Financial literacy in simple words is the knowledge about various financial products. Financial literacy
is considered to be an important tool to achieve financial inclusion and hence inclusive growth. It enables

P. K. Gupta and Dr. U. M. Kinange
http://www.iaeme.com/IJM/index.asp 44 editor@iaeme.com
an individual to understand his financial need and hence plan accordingly. Therefore the knowledge of
financial concepts is essential for personal financial planning.
The research conducted by various organisations indicated low level of financial literacy across the
globe. The S&P Global Fin Lit Survey found that worldwide only 33.33% of the adults are financial
literate. Further only 27% of the adults are financial literate in Asia. The policy makers across the globe
have expressed concerns about the low level of financial literacy. Hence in 2008, the Organisation for
Economic Co-operation and Development (OECD) has created an International Network on Financial
Education (INFE) to tackle the issue of financial literacy by creating an international platform for policy
makers.
Customer satisfaction is a frequently used term in marketing. It is a measure of how products and
services of a company meet customer expectation. “Customer satisfaction is the key for many banks to
survive in competition” (Mistry, D. S. H., 2013).
2. REVIEW OF LITERATURE
2.1. Financial Literacy
Volpe et al. (2002) measured investment literacy of 530 online investors and found that level of investment
literacy varied with people’s education, experience, age, income and gender. Men respondents had higher
investment literacy when compared to women respondents.
Cole et al. (2008) measured the level of financial literacy and its relationship to demand for financial
services in India and Indonesia. The study indicated a strong relationship between financial literacy and the
demand for financial products.
Al-Tamimi and Kalli (2009) assessed the financial literacy of the UAE investors. The results indicate
that the financial literacy of respondents is far below the needed level. The study also found that financial
literacy is affected by income level, education level and workplace-activity.
Almenberg and Soderbergh (2011) investigated the relationship between financial literacy and
retirement planning of Swedish adults. It was found that there exist a significant difference in financial
literacy between planners and non-planners. Financial literacy level was found lower among older people,
women and those with low education or earnings.
2.2. Customer Satisfaction
Padhy, P. K., & Swar, B. N. (2009) made an empirical study of major quality improvement initiatives
recently undertaken by two banks. The primary aim of the study was to enhance the understanding of
service quality and to identify models that can be employed by the managers in service industry. The
researcher investigated the role that technology played in banking and its impact on the delivery of
perceived service quality. The SERVQUAL measuring instrument was used for the research. Three groups
of banks (Private-ICICI and Axis Bank; Public - SBI and PNB; & Foreign Bank – Citi bank) were selected
for the study, which was conducted in Orissa. Primary data was collected from a sample of 440
respondents on judgmental basis of which 300 useable questionnaires were analyzed. It was found that
service quality in public sector banks in India is poor. On the selected five dimensions foreign banks
followed by private sector banks performed better than public sector banks.
Dawar (2013) made an attempt to identify the main factors that influence the customer satisfaction in
retail banking. A comparative research design has been chosen to elucidate the determinants of Customer
Satisfaction. Factor Analysis was used for data analysis. The researcher applied KMO (Kaiser-Meyer-
Olkin) and Bartlett's Test to the collected data. Kaiser-Meyer-Olkin Measure of Sampling Adequacy test
shows the value of .814. The researcher concluded his study by identifying factors that may be used by the
bankers of small town to identify drive customer loyalty out of customer satisfaction.

A Study of Financial Literacy and its Impact on Customer Satisfaction with Special Reference to Banks of
Bagalkot District
http://www.iaeme.com/IJM/index.asp 45 editor@iaeme.com
Nippatlapalli, A. R. (2013) conducted a study to identify the factors that influences the customer
behavior of SBI and to study the Satisfaction of customers towards the bank. The study was undertaken at
Kavali region of Andhra Pradesh state with a sample size of 200. It was found that the customers were less
aware about online transactions facilities provided by the bank. Further it was observed that the 84% of the
Respondents were satisfied on financial transactions of the Bank.
3. OBJECTIVES OF THE STUDY
• To measure the level of financial literacy among the respondents.
• To measure the customer satisfaction of respondents.
• To study the impact of financial literacy on customer satisfaction towards banking services.
4. RESEARCH METHODOLOGY
The title of the study is “A Study of Financial Literacy and its Impact on Customer Satisfaction with
Special Reference to Banks of Bagalkot District”. The Research Methodology is a blend of primary and
secondary data.
The questionnaire drafted by FINRA Investor Education Foundation consisting of five-questions is
considered to test financial literacy and the questionnaire of Sabir, R. I., et al. 2014 has been considered for
determining the customer satisfaction, with some modifications to accomplish the objective of this study.
The data was analysed using means and combined means.
4.1. Data Collection
• Secondary Data: The secondary data includes an analysis of research works carried out on financial literacy
in the past.
• Primary Data: The primary data is collected using a questionnaire to translate the defined research objective.
4.2. Sampling Framework
• Population –Bagalkot district of Karnataka
• Sampling Unit – Members of Self Help Groups
• Sampling Method – Random sampling.
• Sample size: 60.
5. ANALYSIS AND INTERPRETATION
The required data has been collected by way of a questionnaire and it has been analyzed and interpreted
with the help of tables with relevant descriptions.
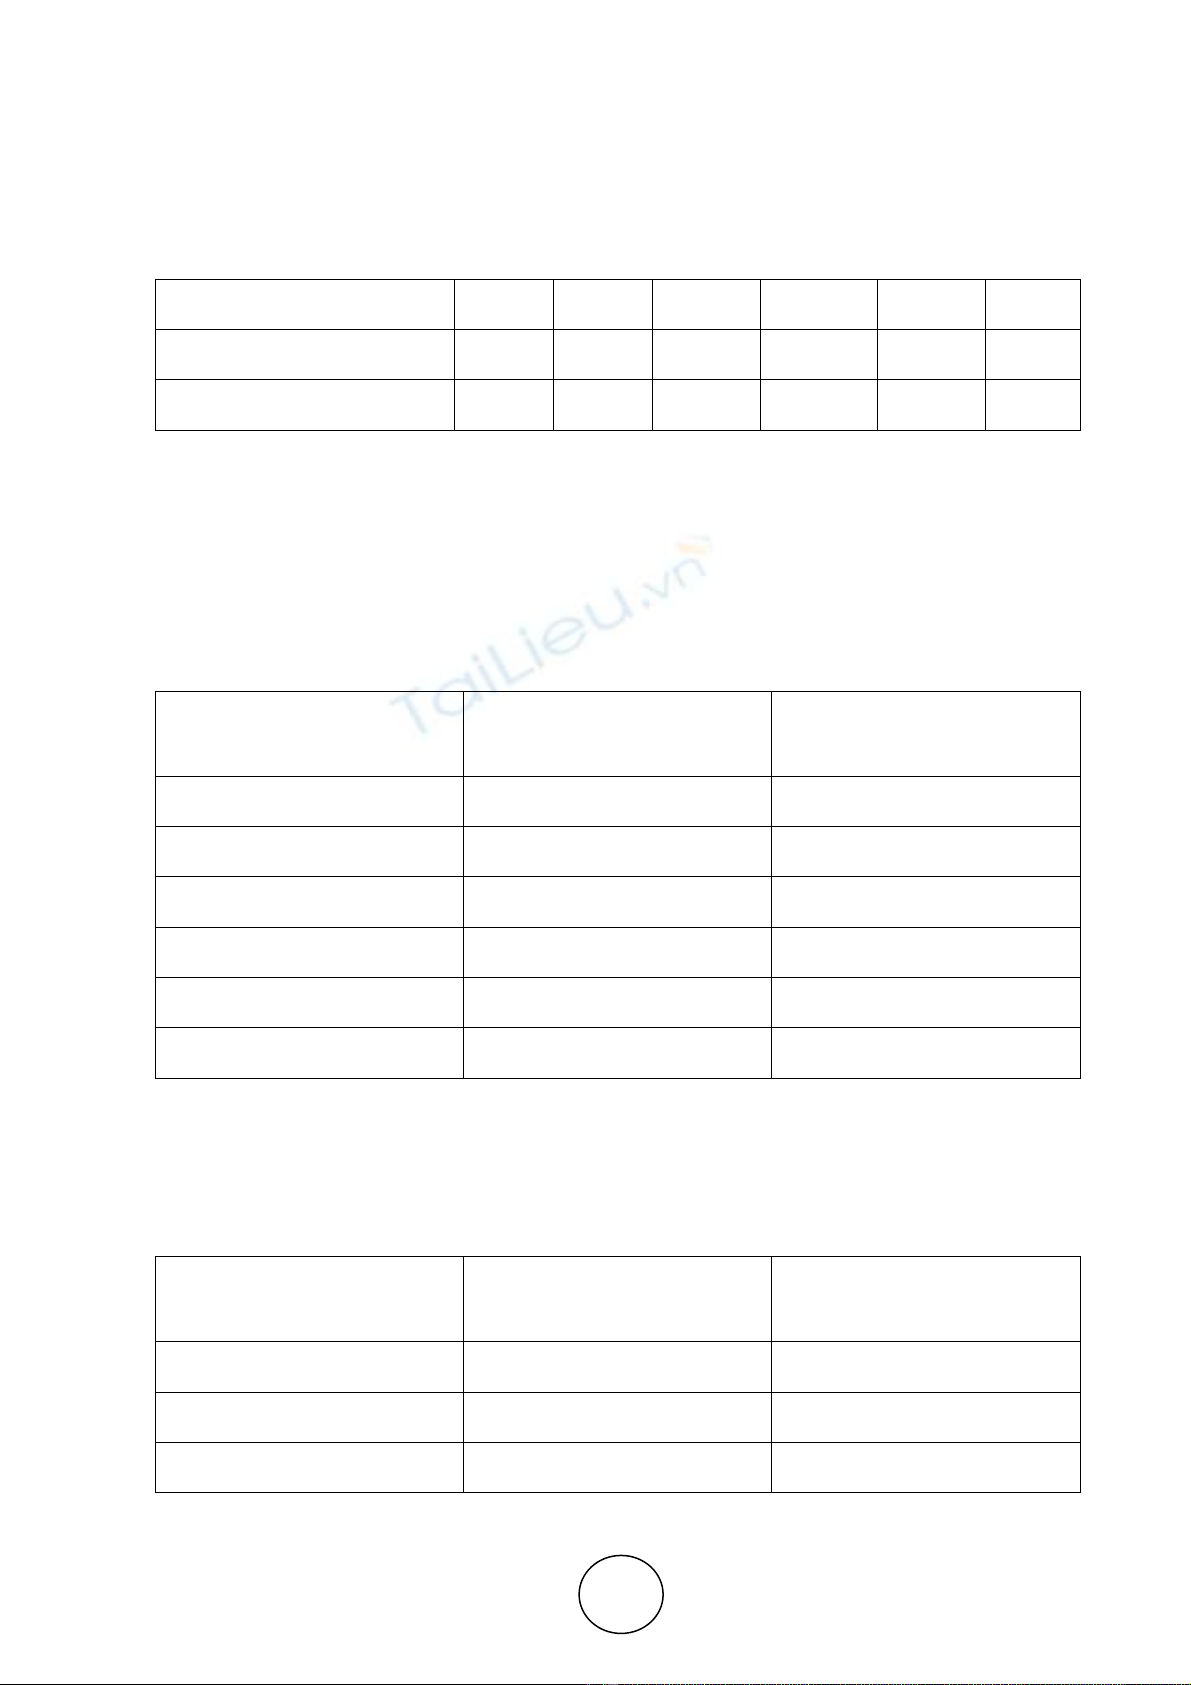
Table 1 Demographic Variables
Demographic Variables No. of Respondents Percentage
Gender
Male
Female
11
49
18.33
81.67
Age
Under 20
21 – 30 years
31 – 40 years
41 – 50 years
50-60 years
60 and Above
0
3
15
21
16
5
0
5
25
35
26.67
8.33

P. K. Gupta and Dr. U. M. Kinange
http://www.iaeme.com/IJM/index.asp 46 editor@iaeme.com
Educational Level
Primary
Secondary
Higher Secondary
Undergraduate
Graduate
Post Graduate
32
9
7
0
12
0
53.33
15
11.67
0
20
0
Profession:
Business
Service
Student
House wife
Others
13
17
4
17
9
21.67
28.33
6.67
28.33
15
Monthly Income (Rs.)
Below 10,000
10,000 - 20,000
20,000 - 50,000
50,000 – 75,000
75,000 – 100,000
100,000 – 200,000
200,000 – 400,000
400,000 and above
30
12
4
2
2
0
7
3
50
20
6.67
3.33
3.33
0
11.67
5
Duration of Bank Accounts
Operated by the Respondents
Less than 1 Year
1-3 Years
3-5 Years
5-10 Years
More than 10 years
1
11
15
30
3
1.67
18.33
25
50
5
Frequency of Using Banking
Services
Daily
Once in a week
Once in 2 weeks
Once in 3 weeks
Once in a Month
0
1
1
9
49
0
1.67
1.67
15
81.67
The table 1 reveals that 49 (81.67%) respondents surveyed were females and 11(18.33) were male.
Most of the respondents 21 (35%) belong to the age group of 41 to 50 years. The literacy level speaks the
full facts a) Primary level - 32 (53.33%), b) Secondary level - 9 (15%), c) higher secondary level - 7
(11.67%), d) under graduate level – 0 (0 %), and e) graduate level – 12 (20%). Among the occupational
categories, 17 (28.33%) respondents were house wife, 17 (28.33%) were in service, 13 (21.67%) are
businessmen, 4 (6.67%) were student and 9 (15%) belonged to other categories.
The income wise classification showed that the 30 (50%) were in below Rs 10,000 group. 12 (20%)
were in the 10,000 to 20, 000 group, 4 (6.67%) were in the 20,000 to 50,000 group, 2 (3.33%) were in the
50,000 to 75,000 group, 2 (3.33%) were in the 75,000 to 100,000 group, 7(11.67%) in 2,00,000 to 4,00,000
group and 3 (5%) belongs to the group of 4,00,000 and above.
Only 1 (1.67%) respondent was dealing with bank for less than one year, 11 (18.33%) were having
account between 1-3 year, while 15 (25%) were dealing with this bank for 3 to 5 years. 30 (50%) were
account holders for 5 to 10 years and 3 (5%) were dealing with the bank for more than 10 years. Out of the
60 respondents selected for study, no respondent used banking services daily, 1 (1.67%) respondent used
A Study of Financial Literacy and its Impact on Customer Satisfaction with Special Reference to Banks of
Bagalkot District
http://www.iaeme.com/IJM/index.asp 47 editor@iaeme.com
banking once in a week, 1(1.67%) respondent used banking once in two weeks, 9 (15%) were banking
once in three weeks, and 49 (81.67%) were banking once in a month.
Table 2 Percentage of respondents giving correct answer on financial literacy questions.
No. of Correct Answer 0 1 2 3 4 5
Number of Respondents 10 14 14 12 5 5
Percentage of Respondents 16.67 23.33 23.33 20 8.33 8.33
Table No. 2 shows that 5 (8.33%) respondents have answered all the questions correctly. Further 5
(8.33%) respondents have answered four of the questions correctly, 12 (20%) respondents have answered
three questions correctly, 14 (23.33%) have answered only 2 questions correctly. 14 (23.33%) of the
respondents have answered only one question correctly. 10 (16.67%) of the respondents answered all the
questions in a wrong way. Hence only 22 (36.67%) respondents have given correct answer for minimum
three questions and are considered to be having higher level of financial literacy when compared to
remaining 38 (63.33%) respondents.
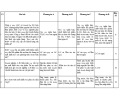
Table 3 Perceptions of Customers about banks Tangibility
Dimensions Respondents with high
Financial Literacy Level
Mean
Respondents with low
Financial Literacy Level
Mean
Premises 4.27 4.45
Technology 4.50 4.37
Employee Dress 4.14 4.13
Complete Information 3.82 3.82
Bank Statement 3.82 3.85
Combined Mean 4.11 4.06
The data in Table-3 brings to light the difference in the perceptions of the customers on tangibles. The
data reveals that the combined mean of respondents with high financial literacy level is 4.11 and with low
financial literacy level is 4.06. It clearly shows that level of financial literacy has very low impact on the
tangibility factor of customer satisfaction.
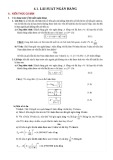
Table 4 Perceptions of Customers about banks reliability factor
Dimensions Respondents with high
Financial Literacy Level
Mean
Respondents with low
Financial Literacy Level
Mean
Service of bank 4.00 3.92
Handling a problem 3.73 3.58
Satisfied with bank service 3.50 3.63
![Vay vốn Agribank: Điều kiện và thủ tục [mới nhất]](https://cdn.tailieu.vn/images/document/thumbnail/2020/20200720/mami89/135x160/7951595232152.jpg)


![Đề thi giữa học kì Tài chính tiền tệ: Tổng hợp [Năm]](https://cdn.tailieu.vn/images/document/thumbnail/2026/20260513/hoacattuong2026/135x160/81291778835177.jpg)


%20--%3e%3cdefs%3e%3cstyle%3e%20.st0%20{%20fill:%20%23fff;%20}%20.st1%20{%20fill:%20%237800fa;%20}%20%3c/style%3e%3c/defs%3e%3cpath%20class='st1'%20d='M117.78,12.18H43.11c2.9,3.47,4.65,7.94,4.65,12.82,0,5.6-2.3,10.66-6.01,14.29h76.02l7.22-13.56-7.22-13.56Z'/%3e%3cg%3e%3cpath%20class='st0'%20d='M53.58,26.17h-.59v-1.46h.59v-4.96h2.83c1.78,0,2.67.94,2.67,2.82v5.76c0,1.87-.89,2.81-2.67,2.81h-2.83v-4.96ZM55.36,21.37v3.34h1.1v1.46h-1.1v3.34h1.01c.61,0,.91-.37.91-1.1v-5.93c0-.74-.3-1.1-.91-1.1h-1.01Z'/%3e%3cpath%20class='st0'%20d='M65.99,31.14h-1.8l-.31-2.07h-2.19l-.31,2.07h-1.64l1.82-11.39h2.62l1.82,11.39ZM65.28,18.04c-.25.46-.51.77-.75.94-.21.15-.47.22-.79.22-.26,0-.57-.07-.92-.22l-.38-.15c-.14-.05-.26-.07-.37-.07-.3,0-.53.18-.71.54l-.91-.68c.25-.46.51-.77.75-.94.21-.14.48-.21.79-.21.26,0,.57.07.92.21l.38.15c.14.05.26.07.37.07.3,0,.53-.18.71-.54l.91.68ZM61.91,27.52h1.73l-.87-5.76-.87,5.76Z'/%3e%3cpath%20class='st0'%20d='M74.53,26.89v1.52c0,1.91-.89,2.86-2.67,2.86s-2.67-.95-2.67-2.86v-5.93c0-1.91.89-2.86,2.67-2.86s2.67.95,2.67,2.86v1.11h-1.69v-1.22c0-.75-.31-1.12-.93-1.12s-.93.37-.93,1.12v6.15c0,.74.31,1.11.93,1.11s.93-.37.93-1.11v-1.63h1.69Z'/%3e%3cpath%20class='st0'%20d='M81.4,31.14h-1.8l-.31-2.07h-2.19l-.31,2.07h-1.64l1.82-11.39h2.62l1.82,11.39ZM75.9,19.2l1.52-1.91h1.71l1.51,1.91h-1.61l-.76-.95-.75.95h-1.61ZM77.32,27.52h1.73l-.87-5.76-.87,5.76ZM83.1,15.99l-1.76,1.91h-1.26l1.17-1.91h1.86Z'/%3e%3cpath%20class='st0'%20d='M84.86,19.75c1.78,0,2.67.94,2.67,2.82v1.48c0,1.87-.89,2.81-2.67,2.81h-.85v4.28h-1.79v-11.39h2.64ZM84.01,21.37v3.86h.85c.58,0,.87-.36.87-1.08v-1.71c0-.71-.29-1.07-.87-1.07h-.85Z'/%3e%3cpath%20class='st0'%20d='M93.51,19.75c1.78,0,2.67.94,2.67,2.82v1.48c0,1.87-.89,2.81-2.67,2.81h-.85v4.28h-1.79v-11.39h2.64ZM92.66,21.37v3.86h.85c.58,0,.87-.36.87-1.08v-1.71c0-.71-.29-1.07-.87-1.07h-.85Z'/%3e%3cpath%20class='st0'%20d='M98.8,31.14h-1.79v-11.39h1.79v4.88h2.03v-4.88h1.83v11.39h-1.83v-4.88h-2.03v4.88Z'/%3e%3cpath%20class='st0'%20d='M105.36,24.55h2.46v1.62h-2.46v3.34h3.09v1.63h-4.88v-11.39h4.88v1.63h-3.09v3.18ZM108.17,17.29l-1.76,1.91h-1.26l1.17-1.91h1.86Z'/%3e%3cpath%20class='st0'%20d='M112.2,19.75c1.78,0,2.67.94,2.67,2.82v1.48c0,1.87-.89,2.81-2.67,2.81h-.85v4.28h-1.79v-11.39h2.64ZM111.35,21.37v3.86h.85c.58,0,.87-.36.87-1.08v-1.71c0-.71-.29-1.07-.87-1.07h-.85Z'/%3e%3c/g%3e%3ccircle%20class='st1'%20cx='25'%20cy='25'%20r='20'/%3e%3cpath%20class='st0'%20d='M32.78,19.27c2.92,0,4.43,2.55,5.28,5.33l.71,2.17c.14.38-.33.75-.71.75h-5.61c.19-.33.24-.71.09-1.08l-.75-2.45c-.43-1.32-.99-2.64-1.79-3.77.75-.57,1.65-.94,2.78-.94h0ZM25,18.38c3.25,0,4.9,2.78,5.89,5.89l.76,2.45c.14.42-.33.8-.8.8h-11.69c-.42,0-.94-.38-.8-.8l.75-2.45c.99-3.11,2.64-5.89,5.89-5.89h0ZM25,11.35c1.74,0,3.11,1.37,3.11,3.11s-1.37,3.11-3.11,3.11-3.11-1.41-3.11-3.11,1.41-3.11,3.11-3.11h0ZM17.27,19.27c1.08,0,1.98.38,2.73.94-.8,1.13-1.37,2.45-1.74,3.77l-.8,2.45c-.14.38-.05.75.09,1.08h-5.56c-.42,0-.9-.38-.75-.75l.71-2.17c.9-2.78,2.41-5.33,5.33-5.33h0ZM17.27,12.91c1.51,0,2.78,1.27,2.78,2.83s-1.27,2.83-2.78,2.83-2.83-1.27-2.83-2.83,1.27-2.83,2.83-2.83h0ZM32.78,12.91c1.56,0,2.78,1.27,2.78,2.83s-1.23,2.83-2.78,2.83-2.83-1.27-2.83-2.83,1.27-2.83,2.83-2.83h0ZM27.07,28.56v.09c0,.57-.24,1.08-.61,1.46h0v.05c-.38.33-.9.57-1.46.57s-1.08-.24-1.46-.61h0c-.38-.38-.61-.9-.61-1.46v-.09h1.41v.09c0,.19.05.38.19.47v.05c.09.09.28.19.47.19s.38-.09.47-.19v-.05c.14-.09.24-.28.24-.47t-.05-.09h1.41ZM30.99,28.56v.09c0,1.65-.66,3.16-1.74,4.24-1.08,1.08-2.59,1.79-4.24,1.79s-3.16-.71-4.24-1.79l-.05-.05c-1.04-1.08-1.7-2.55-1.7-4.2v-.09h1.41v.09c0,1.27.47,2.4,1.27,3.25h.05c.85.85,1.98,1.37,3.25,1.37s2.4-.52,3.25-1.37c.85-.8,1.37-1.98,1.37-3.25v-.09h1.37ZM34.99,28.56v.09c0,2.78-1.13,5.28-2.92,7.07-1.79,1.79-4.29,2.92-7.07,2.92s-5.23-1.13-7.07-2.92c-1.79-1.79-2.92-4.29-2.92-7.07v-.09h1.41v.09c0,2.4.94,4.53,2.5,6.08,1.56,1.56,3.72,2.5,6.08,2.5s4.52-.94,6.08-2.5c1.56-1.56,2.5-3.68,2.5-6.08v-.09h1.41Z'/%3e%3c/svg%3e)