TẠP CHÍ KHOA HỌC - ĐẠI HỌC ĐỒNG NAI, SỐ 29 - 2023 ISSN 2354-1482
106
A NEW FUZZY TIME SERIES MODEL BASED ON HEDGE
ALGEBRA TO FORECAST BITCOIN
Hoang Tung
Dong Nai University
Email: tungaptechbd@gmail.com
(Received: 1/10/2023, Revised: 14/11/2023, Accepted for publication: 18/12/2023)
ABSTRACT
The fuzzy time series model has become a research topic attracting attention
because of its practical value in the field of time series forecasting, specifically, it is
useful for time series with small observations or the one of strong fluctuations. This
paper introduces a fuzzy time series model based on hedge algebra with a new formula
for calculating forecasting values. The Bitcoin time series is employed for testing the
model's performance. Experimental results show that the new model gives better
forecasting results than the ARIMA model, which has been popular for a long time.
Keywords: Time series, Forecasting, Fuzzy time series, Hedge Algebras,
ARIMA, Bitcoin
1. Introduction
In practice, there are many time
series that do not have a large enough
number of observations. This may be
because this time series is newly formed
or because it has not been collected in
the past. Besides, there are also many
time series that fluctuate very strongly,
and their historical value quickly
becomes obsolete, making the number
of meaningful observations for the
forecast not much.
(Wang, 2011), (Arumugam &
Anithakumari, 2013), and (Senthamarai
& Sakthivel, 2014) show that, in many
time series with a small number of
observations, the fuzzy time series
model often gives quite good
forecasting results, even better than the
ARIMA model, which is given for good
forecasting results.
Besides fuzzy sets, Hedge Algebra
is another approach used for developing
fuzzy time series models. Fuzzy time
series models following this approach
show quite good forecasting power,
comparing experimental results, they
give better forecasting results than
many models using the fuzzy set
approach.
(Tung et al., 2016) is the first study
that presents a fuzzy time series model
based on Hedge Algebra. According to
the approach of this study, the values of
time series that need forecasting, c(t),
will be quantified by the fuzzy
linguistic terms (terms) forming the
fuzzy time series f(t). Then, these fuzzy
terms, instead of being quantified by
fuzzy sets, are quantified by Hedge
Algebra. Specifically, each term is
quantified by a fuzzy interval and a
semantic core. Each such fuzzy interval
is treated as an interval over the
universe of discourse of c(t).
Continuing this research direction,
(Tung et al., 2016) propose using Hedge
Algebra including only two hedges to
generate qualitative terms, instead of
having to search for suitable Hedge
Algebras. As a result, this study
introduced a new way of generating

TẠP CHÍ KHOA HỌC - ĐẠI HỌC ĐỒNG NAI, SỐ 29 - 2023 ISSN 2354-1482
107
terms that provide more reasonable
intervals, contributing to improving
forecasting quality. Besides, this study
also proposes to use the average value
of historical values over the intervals to
calculate the forecasting value.
(Tung & Thuan, 2019) introduces
how to use difference series to improve
the forecasting quality of HA based
fuzzy time series model. Accordingly,
instead of forecasting the c(t), the
difference series, vc(t), is forecasted.
This study argues that vc(t) carries more
information than c(t) so may better
reflect the motion law of c(t). In
addition, the study also proposes a new
way of generating terms compared to
previous studies. Experimental results
show that this study gives quite positive
results.
(Thuan & Tung, 2020) applies
groups of relationships over time to
calculate forecasting value. (Thuan &
Tung, 2020) applies the PSO algorithm
to optimize the parameters of Hedge
Algebra. The forecasting results on
some time series of these studies show
that the Hedge Algebra approach to
building fuzzy time series models is a
positive direction.
According to (Petronio et al., 2016),
interval forecasting is a form of
forecasting that provides forecasting
intervals, instead of point ones, that
may contain future values of c(t). There
are not many studies that use fuzzy time
series models to provide this kind of
forecasting.
This study follows the mentioned
studies to build a model by inheriting
the terms generation method of the
study (Tung & Thuan, 2019) and
applying a new formula for computing
forecasting values. The new model is
tested for forecasting power on the
Bitcoin time series, one of the highly
volatile time series. The model also
provides forecasting intervals.
The rest of the paper is organized as
follows: Section 3 presents some
concepts used to build the model.
Section 4 presents the model-building
steps. Section 5 presents the
experimental results. Section six, the
final section, presents some conclusions
of the paper.
2. Preliminary
2.1. Fuzzy time series
In this section, we refer to (Song &
Chissom, 1993) to briefly review some
definitions of the Fuzzy time series.
Definition 1
Let Y(t) (t = …, 0, 1, 2, …), a
subset of R1, be the universe of
discourse on which fi(t) (i = 1, 2, …) are
defined and F(t) is the collection of
fi(t) (i =1, 2, …). Then F(t) is called
FTS on Y(t) (t=…, 0, 1, 2, …).
Definition 2. The relationship
between F(t) and F(t - 1) can be
presented as F(t - 1)→ F(t). If let Ai =
F(t) and Aj = F(t - 1); the relationship
between F(t) and F(t - 1) is represented
by Ai→ Aj, where Ai and Aj refer to the
left-hand side and the right-hand side of
the FLR.
Definition 3. Let F(t) be a FTS. If
F(t) is caused by F(t - 1) or F(t - 2) or ·
· · or F(t - m + 1) or F(t - m) then this
FR is represented by F(t - m) → F(t) or
· · ·; F(t - 2) → F(t) or F(t - 1)→ F(t)
and is called a first-order FTS model.
2.2. Hedge Algebras
This section refers to (Ho & Long,
2007) to present some basic concepts in

TẠP CHÍ KHOA HỌC - ĐẠI HỌC ĐỒNG NAI, SỐ 29 - 2023 ISSN 2354-1482
108
Hedge Algebras. These are applied to
the model presented in the next section.
Definition 4. The HA is defined by
AX = (X, G, C, H, ≤), X is a set of terms,
G= {c+, c-} is the set of primary
generators, c+ and c- are, respectively,
the negative and positive term belongs
to X, C ={0, 1, W} is a collection of
constants in X, H is the set of hedges, H
= H+ ∪ H-, whereH+, H- is,
respectively, the set of all positive and
negative hedges of X; “≤” is a
semantically ordering relation on X.
Each hedge is considered a unary
operator. When applying h ∈ H to x, we
obtain hx ∈X. The positive hedges
increase semantic tendency and vice
versa with negative hedges. It can be
assumed that H-= {h-1<h-2< ... <h-q} and
H+= {h1<h2< ... <hp}.
H(x) is the set of terms u∈X, u =
hn…h1x, with hn,…, h1∈H, generated
from x by applying the hedges of H.
If X and H are linearly ordered sets,
then AX = (X, G, C, H, ≤) is called
linear hedge algebras, furthermore, if
AX is equipped with two additional
operations ∑ and Φ that are,
respectively, infimum and supremum of
H(x), then it is called complete linear
hedge algebras (ClinHA).
Definition 5. Let AX = (X, G, C, H,
≤) be a ClinHA. An fm: X → [0,1] is
said to be a fuzziness measure of terms
in X if:
(1). fm(c−)+fm(c+) = 1 and
( ) ( )
hHfm hu fm u
, for ∀u∈X; in this
case fm is called complete;
(2). For the constants 0, W, and 1,
fm(0) = fm(W) = fm(1) = 0;
(3). For ∀x, y ∈ X, ∀h ∈ H,
( ) ( )
( ) ( )
fm hx fm hy
fm x fm y
, this proportion does not
depend on specific elements; therefore,
it is called the fuzziness measure of the
hedge h and denoted by μ(h).
Proposition 1. For each fuzziness
measure fm on X, the following
statements hold:
(1). fm(hx) = μ(h)fm(x), for every x
∈ X;
(2). fm(c−) + fm(c+) = 1;
(3).
)()(
0, cfmchfm
ipiq i
, c
∈{c−, c+};
(4).
)()(
0, xfmxhfm
ipiq i
;
(5).
1)(
iq i
h
and
pi i
h
1)(
, where α, β > 0 and α +
β = 1.
Definition 6. The fuzziness interval
of the linguistic terms x ∈ X, denoted by
ℑ(x), is a subinterval of [0,1], if |ℑ(x)| =
fm(x) where |ℑ(x)| is the length of fm(x),
and recursively determined by the
length of x as follows:
(1). If length of x is equal to 1
(l(x)=1), that mean x ∈ {c-, c+}, then
|ℑ(c-)| = fm(c-), |ℑ(c+)|= fm(c+) and ℑ(c-)
≤ ℑ(c+);
(2). Suppose that n is the length of x
(l(x)=n) and fuzziness interval ℑ(x) has
been defined with |ℑ(x)| = fm(x). The set
{ℑ(hjx)| j ∈ [-q^p]}, where [-q^p] = {j | -
q ≤ j ≤ -1 or 1 ≤ j ≤ p}, is a partition of
ℑ(x) and we have: for hpx ≤ x, ℑ(hpx) ≤
ℑ(hp-1x) ≤ … ≤ ℑ(h1x) ≤ ℑ(h-1x) ≤ … ≤
ℑ(h-qx); for hpx = ≥ x, ℑ(h-qx) ≤ ℑ(h-q+1x)
≤ … ≤ ℑ(h-1x) ≤ ℑ(h1x) ≤ … ≤ ℑ(hpx).

TẠP CHÍ KHOA HỌC - ĐẠI HỌC ĐỒNG NAI, SỐ 29 - 2023 ISSN 2354-1482
109
3. Proposed method
Input: c(t) is the time series to
forecast;
Output: Forecasting values of c(t)
Model setting phrase (Tung &
Thuan, 2019):
Step 1: Determine the number of
terms to use for qualitative. The symbol
for this number is k;
Step 2: Determine the universe of
discourse c(t), U = [Dmin – D1, Dmax
+ D2], where Dmin, Dmax, D1, and D2
are respectively the lowest and highest
historical values of c(t) and the values
are chosen to ensure that future values
of c(t) all belong to U.
Step 3: Use AX = (X, G, C, H, ≤) to
generate terms, where H includes two
hedges, h-1 and h+1; G = {c-, c+}.
Let p be a FiFo list, Lo and Hi are
the generators, respectively, and t is an
integer variable.
Add Lo and Hi to p;
t=2;
Repeat until t >= k
{
Let x be a term variable;
If p is not empty, then x
takes the value of the first
element of p;
else break the loop;
If the fuzziness interval of x
does not include any element of
c(t) {
t = t-1;
continue;
}
Let u be an integer variable whose
initial value is 0;
Use h-1 and h+1 operate x to produce
two terms, h-1x, and h+1x;
Calculate the fuzzy interval of h-1x
and h+1x;
If the fuzzy interval of h-1x or h+1x
contains any value of c(t), increase h by
one;
If h equals 2, then t=t+1;
If all elements of p include all
historical values or include only one
historical value, then break the loop;
}
Step 4:
Let f(t) be the set of fuzzy terms,
initially f(t) = ∅;
For each y value of c(t)
If y belongs to the fuzzy interval
of the term v generated in Step 3, then
put y in f(t).
Step 5:
Establish relationships Ai → Aj
corresponds to two consecutive terms of
f(t).
Group each relationship with the
same opposite side into a relation
group. For example, suppose we have
relations: Ai → Aj, Ai → Am, Ai → Aj,
then we have the relation group Ai →
Aj(2)Am(1). Here (2), and (1)
respectively, the number of occurrences
of Aj and Am in the relations with the
left side is Ai.
Forecasting phrase:
For the time series c(t) at time tt,
the forecast value of c(t) at time tt+1 is
calculated as follows:
- Determine the first difference
values of c(t), call these values the
difference series v(t). Let h be the total
number of elements of c(t).
TẠP CHÍ KHOA HỌC - ĐẠI HỌC ĐỒNG NAI, SỐ 29 - 2023 ISSN 2354-1482
110
- If c(tt) belongs to the fuzziness
interval of Ai, then find the relation
group whose left side is Ai, for
example, Ai → Aj(p)Am(q). Then the
forecast value is calculated according to
the formula:
+
- If the relation group has the left
side Ai but the right side is ∅, then the
forecasted value is TB(Ai) + .
4. Experimental results
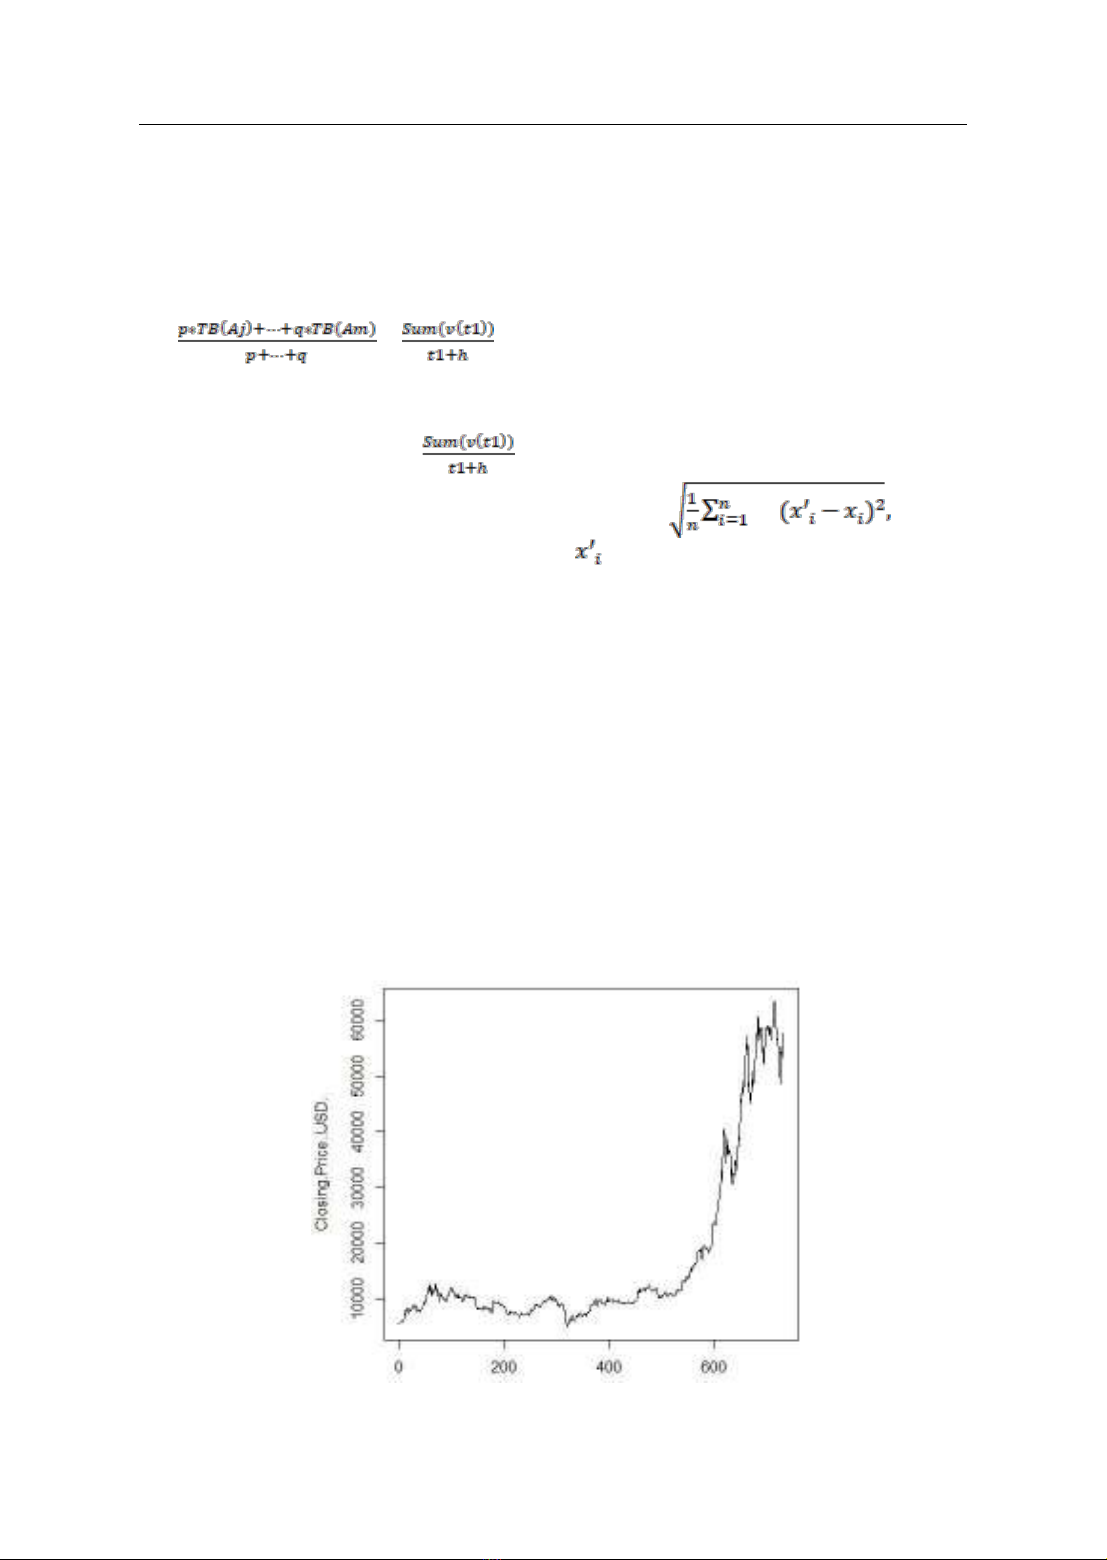
The Bitcoin time series, recording
the values at the time point of closing
the transaction, is used for testing the
forecasting accuracy of the proposed
model. Besides, the forecasting capacity
of this model is also compared to the
ARIMA model one, the most
commonly used model in time series
forecasting.
This paper uses different value
ranges of the Bitcoin time series as the
experimental data set. The first range is
selected from May 3, 2019, to May 2,
2021, this range is named Bit1; the
second range is named Bit2 which is
taken from May 2, 2020, to May 2,
2021; The third range is named Bit3,
which records data from May 2, 2020,
to July 27, 2020.
R's auto.arima function is used to
determine the forecast value of Bitcoin
by interval and point. The interval
forecasting values (Lo, Hi) when using
ARIMA have 95% confidence.
To estimate the accuracy of the
forecasts, this paper uses the index
RMSE = where
is the predicted value, xi is the
historical value, and n is the number of
forecasted values.
In order to evaluate the accuracy of
the forecast results. This paper proposes
2 evaluation criteria:
(1) The forecast interval must
contain the value of the future time
series.
(2) The forecast interval has a
length, Hi (High) - Lo (Low), the
shorter the better.
Forecast Result of Bit1
Fig 1: Bitcoin from May 3, 2019, to May 2, 2021