HPU2. Nat. Sci. Tech. Vol 03, issue 01 (2024), 20-29.
HPU2 Journal of Sciences:
Natural Sciences and Technology
journal homepage: https://sj.hpu2.edu.vn
Article type: Research article
Received date: 18-10-2023 ; Revised date: 22-11-2023 ; Accepted date: 01-12-2023
This is licensed under the CC BY-NC 4.0
20
Time series analysis and applications in data analysis,
forecasting and prediction
Le-Hang Le*
University of Economics - Technology for Industries (UNETI), Hanoi, Vietnam
Abstract
Time series analysis is an essential field in data analysis, particularly within forecasting and prediction
domains. Researching and building time series models play a crucial role in understanding and predicting
the temporal dynamics of various phenomena. In mathematics, time series data is defined as data points
indexed in chronological order and have a consistent time interval between consecutive observations. This
can include data such as daily stock prices, annual national income, quarterly company revenue, and more.
The advantage of time series data is that it can capture the state of a variable over time. In contrast, the
world is constantly changing, and phenomena rarely remain static they typically exhibit variations over
time. Therefore, time series data has highly practical applications and is used in various fields, including
statistics, econometrics, financial mathematics, weather forecasting, earthquake prediction,
electroencephalography, control engineering, astronomy, telecommunications, and signal processing.
ARIMA, which stands for Auto Regressive Integrated Moving Average, is a widely used time series
forecasting method in data science. It is a popular model for analyzing and predicting time-dependent data
points. ARIMA combines autoregression, differencing, and moving averages to capture different aspects of
time series data. In this paper, we study ARIMA, which is a significant model for analyzing and predicting
time series data.
Keywords: Time series, data analysis, forecasting, prediction, arima
1. Introduction
A time series is a collection of values recorded at different points in time and can be used to
describe changes over time. Examples of time series include monthly sales volume, daily stock prices,
hourly temperatures, and daily COVID-19 infection counts.
* Corresponding author, E-mail: lehang1102@gmail.com
https://doi.org/10.56764/hpu2.jos.2024.3.1.20-29

HPU2. Nat. Sci. Tech. 2024, 3(1), 20-29
https://sj.hpu2.edu.vn 21
A time series is a sequence of values recorded over time, where each value in the time series is
associated with a specific timestamp [1], [2]. Time series data is commonly used to model and forecast
variables that change over time, such as stock prices, temperature, sales, and many other variables. It
involves using historical data to predict future values [3]–[7]. This can be applied in various fields,
including finance, weather forecasting, and energy consumption. Time series allows you to examine
trends and changes over time, identify factors causing variations, and extract useful information. It can
be used to validate assumptions about data, such as correlation and seasonality [8]–[13].
2. Meterials and Methods
2.1. Time series
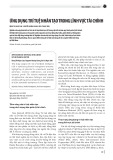
Figure 1. The trend component. (a) The trend of data reduction of food, fuel and fertilizer indices.
(b) The trend of data increase of food.
Time series data can also be used to predict sudden events or unexpected changes in data, such as
anomalies or outliers. To work with time series data, appropriate methods and tools are needed, such
as the ARIMA (Autoregressive Integrated Moving Average) model, recurrent neural networks
(RNNs), Long Short-Term Memory (LSTM) networks, or programming languages and libraries like
Python with pandas and scikit-learn [1], [2].
Singular Value Decomposition (SVD) is an important method in linear algebra and data
processing. It allows the decomposition of a not necessarily square matrix into the product of three
special matrices: a unitary matrix U, a diagonal matrix Σ, and another unitary matrix, the transpose of
U (U*). Below is the definition, properties, and a specific example of the SVD method [1]–[3].

HPU2. Nat. Sci. Tech. 2024, 3(1), 20-29
https://sj.hpu2.edu.vn 22
Trend Component: It signifies the upward or downward direction of data points in a time series.
The trend component is often depicted on a graph as a straight line or a smooth curve, Figure 1. A time
series data without a trend component (meaning it doesn't exhibit an apparent increase or decrease) is
considered stationary around its mean value [4]–[6].
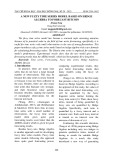
Figure 2. Representing changes in a time series over intervals.
Seasonal Component: This component represents the cyclic variation in the values of y calculated
over short time periods. For example, the number of children with respiratory illnesses tends to
increase during peak cold seasons in our country [7]–[9]. Figure 2 provides a representation of changes
in a time series over intervals.
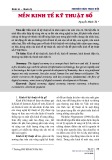
Figure 3. Representing the cyclical pattern in a time series.
Cyclic Component (Long-term): It reflects the long-term increase or decrease in the time series
data revolving around the trend. Identifying cyclic components in long-term time series data can be
challenging. Figure 3 provides a representation of the cyclical pattern in a time series. Figure 4
illustrates the time series in statistics.

HPU2. Nat. Sci. Tech. 2024, 3(1), 20-29
https://sj.hpu2.edu.vn 23
Random Component: This is the opposite of cyclic components. The random component accounts
for irregular fluctuations in the time series data and is often unpredictable. These fluctuations are
typically caused by external factors [10]–[15].
Figure 4. Time series in statistics.
According to time series diagram
t
Y
represents the quantitative value over time calculated at time
t, through which we can determine the following models:
Additive model:
t t t t t
Y T S C I .
Multiplicative model:
t t t t t
Y T S C I .
Where: T is the Trend component; S is the Seasonality component; C is the Cyclical component; I
is the Irregular component.
If the cyclical and seasonal components do not affect the overall level of the time series, it is
advisable to use the additive model. Conversely, the multiplicative model is used if the seasonal
component depends on the trend and cycle.
2.2. Characteristics of Time Series Data
The characteristics of time series data can be better understood by examining real-world examples
from various fields (for example, Figure 4). Below is an example of quarterly profits for Johnson &
Johnson.
Figure 5 depicts the quarterly profit chart for each share of Johnson & Johnson, provided by
Professor Paul Griffin from the University of California's School of Management. This data includes
84 quarters (equivalent to 21 years) from the first quarter of 1960 to the last quarter of 1980. The goal
is to build a time series model by observing key patterns in the past. In this case, we can observe a
general upward trend and regular fluctuations added to the trend, seemingly repeating over the
quarters.

HPU2. Nat. Sci. Tech. 2024, 3(1), 20-29
https://sj.hpu2.edu.vn 24
Figure 5. Johnson & Johnson's Quarterly Profits.
Figure 6. Financial Time Series Data.
Figure 6 provides an example of financial time series data, depicting the daily changes (or
percentage changes) of the New York Stock Exchange (NYSE) from February 2, 1984, to December
31, 1991. In the graph, we can easily observe the market crash that occurred on October 19, 1987. The
data in Figure 6 is a typical illustration of financial data. The time series average is stable, with an
average return approximately equal to zero. However, the data's volatility (or standard deviation)
varies over time. In fact, the data exhibits clustering of volatility cycles, meaning that periods of high
volatility tend to cluster together. An important issue in the analysis of such financial data is
forecasting the future volatility of returns. To address this issue, models like the ARCH and GARCH
models were developed by Engle Bollerslev, as well as the stochastic volatility models of Harvey,
Ruiz, and Shephard. Differencing is a crucial step in the ARIMA model. It is used to remove non-
linearity and trends in time series data for analysis. The differencing process transforms the original
data into a new time series with the aim of minimizing data dependency on previous time points [10],
[12], [15], [16].