MINISTRY OF EDUCATION AND TRAINING UNIVERSITY OF
ECONOMICS HO CHI MINH CITY
--------------
--------
MAI XUAN DAO
RELATIONSHIP AMONG GOVERNMENT EXPORT SUPPORT,
PERCEIVED EXPORT STIMULI, PERCEIVED EXPORT
BARRIERS AND EXPORT PERFORMANCE IN VIETNAMESE
SMES EXPORTING AGRICULTURAL PRODUCTS TO ASEAN+3
Major: Commercial Business
Code: 9340121
SUMMARY OF ECONOMIC DOCTORAL DISSERTATION
Hochiminh City - 2021
The research was conducted and completed: at University of Economics Ho Chi Minh city
Scientific instructors:
Assoc. Prof. Dr. Le Tan Buu
Dr. Ngo Thi Ngoc Huyen
Reviewer 1: …………………………………………
Reviewer 2:………………………………………….
Reviewer 3: …………………………………………
The dissertation will be defended at University of Economics Ho Chi Minh City at…………………………………………….
The dissertation can be found at the following library:
……………………………………………………………….
LIST OF THE AUTHOR’S PUBLICATIONS RELATED TO THE DISSERTATION
University level scientific research work:
Mai Xuan Dao, Nguyen Thi Cam Loan, Tran Thi Lan Nhung (2020).
Relationship among perceived export barriers, firm characteristics and
ASEAN+3 market selection. The case of Vietnamese small and medium-
sized agricultural exporting enterprises. University of Finance and
Marketing scientific research work. Work manager.
Journal:
Le Tan Buu, Mai Xuan Dao (2020). The effect of perceived export stimuli
on ASEAN+3 export market selection from Vietnamese small and medium-
sized agricultural exporting enterprises. Journal of Finance and Marketing,
55, 49-62.
International Conference:
1. Le Tan Buu & Mai Xuan Dao (2019). Effect of perceived external
Issues
export motives and barriers on ASEAN+3 export market selection: The case of small and medium-sized agricultural exporters in Vietnam. The 2nd International Conference on Contemporary in Economics, Management and Business - CIEMB 2019. November 26th – 27th, 1631-1652.
2. Le Tan Buu, Mai Xuan Dao & Dang Thi Thanh Mai (2020). The
relationship among government support programs, perceived export stimuli
and export performance: the case of Vietnamese small and medium-sized agricultural enterprises exporting to ASEAN+3. The 3rd International Conference on Contemporary Issues in Economics, Management and Business - CIEMB 2020. November 18th – 19th, 1625-1642.
3. Mai Xuan Dao, Nguyen Thi Thuy Giang, Tran Thi Lan Nhung & Ta
Hoang Thuy Trang (2020). Effect of perceived export stimuli and export
barriers on export performance: the case of Vietnamese agricultural SMEs
exporting to ASEAN+3. International Conference on Finance – Accounting
for promoting Sustainable Development in Private Sector – FASPS 2020. December 10th, 2020.
1 CHAPTER 1: INTRODUCTION
1.1. The necessity of research problems
1.1.1. Derived from practical needs
Since 2012, Vietnam has shifted from a trade deficit to a trade surplus.
However, Vietnam has a trade deficit in some markets, especially the
ASEAN+3 with about 60 billion USD in the recent four years 2017, 2018,
2019 and 2020 (The author calculated from the Ministry of Industry and Trade
import and export report data in 2018, 2019, 2020 and Customs statistics
2021b). Besides, as an agricultural country, agricultural products are
traditional exports of Vietnam and ASEAN+3 are the main export markets.
The problem of trade deficit with ASEAN+3 can be solved by finding ways
to boost agricultural exports of Vietnamese SMEs to this market group. In
addition, the increase in ASEAN+3 export also creates jobs for the majority
of the population, suitable for SMEs with limited resources which have
difficulties to export to far distance markets. To achieve this, it is necessary to
understand which perceived export stimuli and barriers are hindering their
export performance to ASEAN+3. In addition, according to the White paper
SMEs (2017), Vietnamese SMEs have internal and external difficulties, so
Government export support programs are needed for them. Whether firms
appreciate the benefits of Government export support in contributing to
increase stimuli, reduce export barriers for firms, affecting export
performance or not, should also be studied.
1.1.2. Derived from the theory gap
There are many foreign studies on the direct and indirect relationship between
Government export support and firm export performance. In the indirect
relationship, perceived export barrier is the mediator variable just studied by
Karakaya and Yannopoulos (2012) and there are not any studies of perceived
export stimuli as mediator variable. For domestic studies related to the
dissertation, the review shows that there is a lack of quantitative studies on the
relationship among Government export support, perceived export stimuli,
perceived export barriers, export performance and test the relationship among
these factors. Therefore, it shows the practical needs and the theoretical needs
2
to fill the research gaps when the foreign and domestic studies have not yet
tested the relationship among Government export support, SMEs perceived
export stimuli, perceived export barriers and export performance in a
developing country, with a transitional economy as Vietnam.
1.2. Research objectives
First, building a relationship model among Government export support,
perceived internal export stimuli, perceived external export stimuli, perceived
internal export barriers, perceived external export barriers and export
performance and testing on these relationships.
Second, test on the relationship differences among the model factors based on
firm characteristics.
Third, suggesting some managerial implications for SMEs and some policy-
makers.
1.3. Research object and scope
Research object is the relationships among Government export support,
perceived internal export stimuli, perceived external export stimuli, perceived
internal export barriers, perceived external export barriers and export
performance.
Subjects in the qualitative research are Board of director members in official,
direct agricultural exporting SMEs to ASEAN+3, representatives of state
management agencies related to agricultural products and export promotion,
some scientists are lecturers. Respondents in quantitative research are
directors/deputy directors, chief/deputy export sales managers or staff who
have more than 5 years of working experience in the surveyed firms.
The theoretical scope is to approach the perceived export stimuli and barriers
based on internal stimuli, external stimuli, internal barriers and external
barriers; Government export support based on groups of support programs;
export performance based on subjective scale. The research was conducted in
the North, Central, Highlands and South of Vietnam. The research time for
qualitative research was in 2019.
1.4. Research methodology
3
Research methodology is qualitative and quantitative. Qualitative research
was conducted through in-depth interviews and focus group to adjust the
scales to suit the research context. Quantitative research is conducted through
Smart-PLS software with 120 SMEs surveyed to preliminarily evaluate the
measurement model in the pilot quantitative research, 257 SMEs surveyed for
measurement model evaluation, structural equation model and multi-group
analysis at the formal quantitative research.
1.5. The significance of the research
Theoretical significance
Simultaneous test on the relationships among Government export
support, perceive export stimuli, perceived export barriers and export
performance.
The perceived export stimuli play the role of the mediator variable is
the inheritance and research development from Karakaya and Yannopoulos
(2012).
Test on direct relationship between perceived export stimuli and
perceived export barriers and the indirect relationship between the
Government support and perceived export barriers via perceived export
stimuli.
Government export support affects perceived export barriers under
the approach in groups of support programs and internal, external barriers
which are new compared to previous studies.
Adjusting the Government export support measurement for
agricultural products from Leonidou et al. (2011).
Practical significance
Research context is new in Vietnam.
Study is conducted in specific field which is export agricultural
products. Samples are in all areas in Vietnam.
Some managerial implications are suggested for SMEs exporting
agricultural products to ASEAN+3 and the policy-makers.
4
1.6. The structure of the dissertation
In addition to the preamble and appendixes, the dissertation consists of 5
chapters as follows: Chapter 1: Introduction; Chapter 2: Literature review and
research model; Chapter 3: Research methodology; Chapter 4: Research
results; Chapter 5: Conclusion and research implication.
CHAPTER 2: LITERATURE REVIEW AND RESEARCH MODEL
2.1. Theoretical background
Crick and Spence (2005), Coviello and Cox (2006), Damoah (2011) argued
that the export behavior of SMEs is quite complex, so it is impossible to base
on a single theory to explain but need to use a combination of SME export
behavior theories including 5 theories below.
2.1.1. Resource-based view theory (RBV)
Barney's RBV theory (1991) is most commonly used. According to Barney
(1991), firms should assess whether a resource is (1) valuable, (2) rare, (3)
difficult to imitate or (4) can be replaced or not. If resources are well exploited,
firms will increase their competitive advantage and performance. Firms are
perceived that their own resources can create the internal stimuli or internal
barriers to export.
2.1.2. Stage theory (Uppsala model)
The Uppsala theory (Johanson & Vahlne, 1977, 1990) implies that the more
knowledge and experience accumulated by a firm, the more
internationalization it expands, the more likely it is to overcome barriers and
create stimuli to export which achieve better export performance.
2.1.3. Network model
According to Johanson and Mattsson (1988) network theory, it provides
knowledge, market information, facilitates which stimulate firm to export,
develop and maintain their business. Firms establish, maintain and develop
relationships with involved parties in their businesses, if they are good, they
will be perceived as internal stimuli and if they are not good, they will be
perceived as internal export barrier.
5
2.1.4. The International New Ventures theory (INVs)
INVs are defined as business organizations that have built a competitive
advantage from applying resources and selling products in many countries
since they were established (Oviatt & McDougall, 1994). The INVs theory
helps to explain the firm characteristics influence established for international
business (orientation, vision, and preference for international activities) that
the internal factors affect their export performance.
2.1.5. Contingency theory
Lawrence and Lorsch (1967) argues that SMEs internationalization behavior
is dynamic and diverse because it mostly depends on the firm's capabilities
and partly on the external environment. The favorable external environmental
factors will be perceived as external export stimuli and the adverse external
environmental factors will be perceived as external export barriers.
In addition, this study also researches on SMEs related to Government export
support which often applies institutional theory as previous studies
(Szyliowicz & Galvin, 2010; Oparaocha, 2015; Martineau & Pastoriza, 2016).
2.1.6. Institutional theory
This research approaches institutional theory in a formal way (suggested by
North, 1990) or according to regulations (suggested by Scott, 1995).
Accordingly, Government support is considered as formal institutions or
regulations to guide businesses, provide knowledge, experience, reduce
uncertainties... to achieve good performance.
2.2. Research model constructs
2.2.1. SMEs: Approach to Decree 39/2018/ND-CP, but only based on the
average number of insured employees, not on revenue or capital because firms
are not willing to disclose financial business data.
2.2.2. Perceived export stimuli: is the firm perception of the factors that
influence a firm's decision to initiate, continue, or develop exports (Leonidou,
1995a & Morgan, 1997). This study approaches to internal stimuli and
external stimuli (Leonidou, 1995a).
2.2.3. Perceived export barriers: is the firm perception of limitations that
hinder a firm's ability to initiate, continue, or develop business in foreign
6
markets (Morgan & Katsikeas, 1997; Leonidou, 2004). This study approaches
to internal barriers and external barriers (Leonidou, 1995b).
2.2.4. Government export support: Government export support is programs
with the purpose of creating export understanding, encouraging and reducing
export barriers for business (Seringhaus & Rosson, 1991). Leonidou et al.
(2011) studied higherachy construct with lower components of information
support, education and training support, trade facilitation support and financial
support.
2.2.5. Export performance: Export performance is the result of firms'
international sales and is measured in terms of export sales, export profits, and
changes in sales or profits (Shoham, 1998). This study approaches subjective
measurement based on the satisfaction of firms on export performance.
2.3. Review of empirical studies
Literature review shows that there are studies showing a positive effect
between perceived export stimuli and export performance, the negative effect
between perceived export barriers and export performance (Boubbakri et al.,
2013; Hemmati et al., 2018; Gerschewski & Rose, 2020). However, there are
also some studies with opposite results (Pett, 2004) or not any relationship
exists (Boubbakri et al., 2013). Several studies of the direct effect of
Government export support on export performance have shown mixed results
of either positive or non-significance. In the indirect relationship between
export support and export performance, studies show a variety of mediator
variables, in which, the perceived export stimuli has not been studied, the
perceived export barriers just were studied by Karakaya and Yannopoulos
(2012).
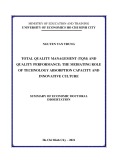
2.4. Hypothesis
Based on the theoretical background and some related empirical studies,
research hypotheses and research models are proposed as follows:
H1a: There is a positive relationship between Government export support and
perceived internal export stimuli.
H1b: There is a positive relationship between Government export support and
perceived external export stimuli.
7
H2a: There is a negative relationship between Government export support and
perceived internal export barriers.
H2b: There is a negative relationship between Government export support and
external export barriers.
H3: There is a positive relationship between Government export support and
export performance.
H4a: There is a positive relationship between perceived internal export stimuli
and export performance.
H4b: There is a positive relationship between perceived external export
stimuli and export performance.
H5a: There is a negative relationship between perceived internal export
barriers and export performance.
H5b: There is a negative relationship between perceived external export
barriers and export performance.
P: There are relationship differences among factors in the research model. P1:
the firm geographical areas; P2: firm size; P3: performance years; P4: export
business years; P5: export mode; P6: selected export markets; P7: the variety
of export products.
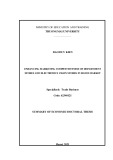
2.5. Research model
2.5.1. Theoretical research model
8
Figure 2.6: Proposed research model Source: Author’s proposal
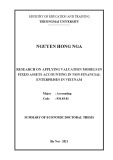
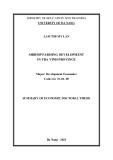
2.5.2. Competitive research model
There are more 4 hypotheses
H6a: There is a negative relationship between perceived internal export
stimuli and internal export barriers.
H6b: There is a negative relationship between perceived internal export
stimuli and external export barriers.
H6c: There is a negative relationship between perceived external export
stimuli and internal export barriers.
H6d: There is a negative relationship between perceived external export
stimuli and external export barriers.
9
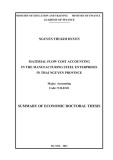
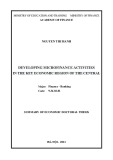
Figure 2.7: Proposed competitive research model Source: Author’s proposal CHAPTER 3: RESEARCH METHODOLOGY 3.1. Research process
Figure 3.1: Research process Source: Author’s proposal
10
3.2. Constructing scales
According to Martinović and Matana (2017), previous studies researched
many export barriers, so it is necessary to choose suitable export barriers for
the research context. Jalali (2013) also argues that each study has different
perspectives to specify barriers, especially related to specific industry and
geographical area. Therefore, the scale of perceived export stimuli and barriers
cannot inherit the specific scale of any authors, but must select the export
stimuli and barriers that are suitable for the research context related to
Vietnamese SMEs exporting agricultural products to ASEAN+3. Therefore,
the author has synthesized the scale of SMEs' perceived export stimuli and
barriers from previous studies to conduct qualitative research to determine the
scales to suit the research context. For the Government export support scale,
the author inherits the scale from Leonidou et al. (2011). For the scale of
export performance, the author inherits the subjective measurement from
Katsikeas et al. (1996).
3.3. Qualitative research
After summarizing the scales from previous studies, qualitative research was
conducted through in-depth interviews with representatives of some SMEs
exporting agricultural products, some representatives of state management
agencies and the scientists, focus group with representatives of some SMEs
exporting agricultural products. At the end of the in-depth interviews and
focus group, the scales were formed as follows:
Table 3.7: Scale of perceived internal export stimuli
IS Sources Perceived internal export stimuli
IS1 Special managerial interest/urge to penetrate X market
special IS2 Utilization of managerial talent Leonidou (1995a); Katsikeas (1996); Leonidou (1998); Trimeche (2002); Westhead et al. (2002). (1995a); Katsikeas Leonidou (1996), OECD (2009); Revindo (2016), Vassilios (2017).
IS3 Face to face interview Products meet X market demand
11
for
IS4 extra Potential sales/profits from exporting to X (1995a); Katsikeas Leonidou (1996); Leonidou (1998); Westhead et al. (2002).
IS5 Potential for extra growth from exporting to X
Leonidou (1995a); Katsikeas (1996), Leonidou (1998); Westhead et al. (2002) IS6 Close relationship in business Focus group Source: Adjusted results from the scales of previous studies
Table 3.8: Scale of perceived external export stimuli ES Sources Perceived external export stimuli
ES1 High demand in X market
ES2 Stable politics in X market
Leonidou (1995a); Morgan (1997); OECD (2009); Revindo (2016). Vassilios (2017) Leonidou (1995a); Katsikeas (1996); Trimeche (2002) ES3
ES4
Leonidou (1995a); Morgan (1997); OECD (2009); Revindo (2016) Face to face interview ES5
in FTAs ES6
ES7 Relaxation of foreign rules and regulations in X market in with comparison European/American markets Close physical proximity to X market X market culture is similar to Vietnamese culture Tariff reduction member countries Favorable foreign exchange rates Katsikeas & Piercy (1993); Leonidou (1995a); Katsikeas (1996). Leonidou (1995a); Katsikeas (1996), OECD (2009); Akomea et al. (2014), Revindo (2016) Source: Adjusted results from the scales of previous studies
Table 3.9: Scale of perceived internal export barriers IB Perceived internal export Sources barriers
IB1 Lack of experience/knowledge in X market
IB2 Inadequate/untrained personnel for exporting
IB3 Limited working capital to support exports Dean et al. (2000); Suarez-Ortega (2003); Leonidou (2004); Tesfom & Lutz (2006); Kahiya (2015). Leonidou (1995b); Morgan & Katsikeas (1998); Dean et al. (2000); Leonidou (2012); (2000); Milanzi Kahiya (2015). Leonidou (1995b); Leonidou (2000); Leonidou Suarez-Ortega (2003);
IB4 Gathering data/information about X market
rules and IB5 Strict foreign regulations in X market
IB6 Lack of trademark
12 (2004); Jalali (2013); Radojevic et al. (2014); Kahiya (2015). Leonidou (1995b); Leonidou (2000); Da Silva & Da Rocha (2001); Leonidou (2004); Predrag et al. (2014); Kahiya (2015); El Makrini (2015). Leonidou (1995b); Kaleka & Katsikeas (1995); Leonidou (2000); Da Silva & Da Rocha (2001); Leonidou (2004); Makrini (2015); Wijayarathne & Perera (2018). Face to face interview Leonidou (1995b); Leonidou (2004); Milanzi (2012); Radojevic et al. (2014); Wijayarathne & Perera (2018).
IB7 Offering competitive prices in X market
Source: Adjusted results from the scales of previous studies
Table 3.10: Scale of perceived external export barriers EB Sources
Face to face interview EB1 Perceived external export barriers Lacking of vertical link in agricultural value chain
EB2 High interest rate
(2001);
EB3
High domestic production - export costs (raw materials, space rental, electricity, water, gasoline, traffic jams, logistics, storage...)
EB4 Informal costs (Corruption) in home country
Lack of efficient home government export EB5
assistance/incentives
EB6 Unfavorable and changeable home country’s export rules and regulations Dean et al. (2000); Shaw & Darroch (2004); Kahiya (2015). Leonidou (1995b); Da Silva & Da Rocha Suarez-Ortega (2003); Leonidou (2004); Chaudhari et al. (2012); Dean (2015); Makrini (2015). Face to face interview Kaleka & Katsikeas (1995); Morgan & Katsikeas (1997); Leonidou (2000); Khorana et al. (2010). Morgan & Katsikeas (1998); Leonidou (2000); Da Silva & Da Rocha (2001); Leonidou (2004); Radojevic et al. (2014); Makrini (2015); Wijayarathne & Perera (2018). Leonidou (2000); Suarez-Ortega (2003); Leonidou (2004); Milanzi (2012); Radojevic et al. (2014); Kahiya (2015).
13
EB7 Health, safety, quality & technical standards in X market
in X EB8 Stiff competition market
EB9 Different foreign customer habits/attitudes
Face to face interview Dean et al. (2000); Leonidou (2000); Crick (2002); Leonidou (2004); Patterson (2004); Korneliussen & Blasius (2008); Pinho & Martins (2010); Kahiya (2015). Leonidou (1995b); Morgan & Katsikeas (1998); Leonidou (2000); Da Silva & Da Rocha (2001); Suarez-Ortega (2003); Leonidou (2004); Jalali (2013); Radojevic et al. (2014); Kahiya (2015) Leonidou (1995b); Leonidou (2000); Da Silva & Da Rocha (2001); (2003); Suarez-Ortega Leonidou (2004); Pinho & Martins (2010); Kahiya (2015); Makrini (2015). Tor Korneliussen & Jörg Blasius (2008). EB10
Mangal & et al. (2012). in EB11 The risk of being sued by the customers in X* market apply who country safeguard measures, anti- dumping tariff Intellectual property rights foreign protection markets Source: Adjusted results from the scales of previous studies
Table 3.11: Scale of Government export support Government export support GS IP Information-Related Programs
IP1 Information about foreign market opportunities in market X IP2 Specific information about doing business with a particular firm
IP3 Provision of marketing information/advice
IP4 Export publications (export newsletters, special reports, mailing lists, and directories…)
EP Education- and Training-Related Programs EP1 Organization of export seminars, conferences, workshops… EP2 Free training programs specializing in exporting EP3 Provision of counseling advice on export business TP Trade Mobility–Related Programs
14
TP1 Assistance in participating in trade shows/exhibitions
TP2 Participation in trade missions which can have an inward (e.g., inviting in foreign markets foreign businesspeople, reporters, or others) or outward (e.g., visiting X markets)
TP3 Support by trade offices abroad TP4 Being supported in trademark set up TP5 Being supported in innovation, quality improvements
TP6 Being supported in patent registration, geographical indication for agricultural products
FP Financial Aid–Related Programs FP1 Being supported in export credit FP2 Being supported in preferential loans with low interest rates FP3 Being capital borrowed from SMEs development fund Source: Adjusted results from Leonidou et al. (2011)
Table 3.12: Scale of export performance Export performance
No EXP1 Satisfaction with export sales in 3 recent years EXP2 Satisfaction with export market share in 3 recent years EXP3 Satisfaction with export profit in 3 recent years Source: Katsikeas et al. (1996) 3.4. Preliminary quantitative research
Higher-order component (GS) includes lower-order component IP, EP, TP,
FP. Among them IP, TP have not yet met discriminant validity which are
needed to remove some items. ES6, IB5, IB7 are needed to remove to meet
convergent validity. However, the author decided to keep all of them and will
continue to check them in the formal quantitative research.
3.5. Formal quantitative research Objective, subject, sample size and the implementation are presented
15
CHAPTER 4: RESEARCH FINDINGS
4.1. Characteristics of research samples
Table 4.1: Characteristics of research samples Characteristics Percentage (%) Area
Number of participants 39 62 156 North Centre and Highland South 15 24 61
69 23 178 60 size of Firm (Number employees)
of
Number performance years
Number of export business years
Export mode
kind of 8 31 37 13 19 41 39 8 12 50 50 39 10 8 43 60 19 80 96 33 48 105 99 22 31 129 128 101 24 21 111 153 Export market to selected answer the survey questions The variety of export products kinds of 40 104 Below 50 From and above 50 to below 100 From 100 to below 200 Below 5 years From 5 to 10 years From 11 to 15 years Above 15 years Below 5 years From 5 to 10 years From 11 to 15 years Above 15 years Manufacture-export Trade-export Asean Korea Japan Chine One commodity Various commodity
Source: Author’s calculation 4.2. Evaluation of the measurement model
- Higher-order component (GS) includes lower-order component: IP, EP, TP,
FP which satisfy the reliability, convergent validity and discriminant validity.
- Higher-order component (GS) with the remaining constructs in the model
IS, EXP satisfy the reliability, convergent validity and discriminant validity.
ES, IB, EB have not yet met convergent validity. In order to meet the standard,
16
the following items should be removed: ES3, ES6, ES7, IB1, IB6, EB2, EB9
and IB4.
4.3. Evaluation of Structural equation model
4.3.1. Evaluation of theoretical research model
(1) Collinearity assessment: the estimated structure model does not have
collinearity.
(2) Structural model path coefficients: Direct effects: 4 hypotheses are
accepted, including H1a, H1b, H3, H4a. 5 hypothesis are rejected, including
H2a, H2b, H4b, H5a, H5b. Indirect effects: There is a total indirect effect of
GS on EXP but just via IS.
adj: R2 =0,31; R2 adj =0,296.
(3)
(4) Coefficient of determination R2 and R2 Effect size f2: there are no effect of ES, IB, EB on EXP, moderate
effect of IS on EXP, GS on IS, ES, EB and EXP, small effect of GS on IB.
(5) Blindfolding and Predictive relevance Q2: Q2 of IS, ES, GS, IB, EB,
and EXP are all greater than 0 indicating the predicted correlation of the path
model for the dependable variable EXP.
(6) Effect size q2: q2 effect of GS on IS, ES, IB, EB are small; GS on EXP,
IS on EXP are nearly moderate; ES, IB, EB on EXP are small or no effect.
4.3.2. Evaluation of competitive research model
(1) Collinearity assessment: the estimated structure model does not have
collinearity.
(2) Structural model path coefficients: Direct effects: the same as
theoretical research model. In addition, 2 hypotheses H6a and H6c in
competitive research model are accepted. H6b and H6d are rejected. Indirect
effects: Beside the same result as theoretical model, there is also an indirect
adj: R2 =0,31; R2 adj =0,296.
(3)
(4)
relationship between GS and IB via IS and ES. Coefficient of determination R2 and R2 Effect size f2: there are no effect of ES, IB, EB on EXP, small effect of GS on IB, EB; ES on IB, EB; moderate effect of GS on IS, ES, EXP; IS on
IB, EB and EXP.
17
(5)
Blindfolding and Predictive relevance Q2: Q2 of IS, ES, GS, IB, EB, and EXP are all greater than 0 indicating the predicted correlation of the path
model for the dependable variable EXP.
(6)
Effect size q2: q2 effect of GS on IS, ES, IB, EB are small; GS on EXP, IS on EXP are nearly moderate; ES, IB, EB on EXP are small or no effect; IS
on IB, EB are small; ES on IB, EB are very small.
The results of competitive model test are the same as theoretical model test.
Beside that, there are additional of 2 hypotheses are accepted so competitive
model is more appropriate to explain the reality. Therefore, the competitive
model are applied instead of the theoretical model.
4.4. Multi-group analysis
The test results show that there are only differences in some relationships
among firms by (1) geographical areas: North vs South (GS-> EXP), South vs
Central, Highland (IS-> EXP), North vs South (IS->IB), South vs Central,
Highland (GS->IS->EXP); (2) number of performance years: from 11 to 15
years vs below 5 years (ES->IB), from 5 to 10 years vs below 5 years
(GS->ES), from 11 to 15 years vs from 5 to 10 years (IS->EXP); (3) number
of export business years: below 5 years vs above 15 years (GS->ES); (4)
export mode (IS->IB); (5) export market: ASEAN vs China (GS->EXP).
4.5. Summary of hypothesis test result
Conclusion
Hypothesis Relationshi
Bootstrap
VIF
p
H1a (+)
GS->IS
0,249***
1,000
H1b (+)
GS->ES
1,000
0,289***
0,000 Accepted
Rejected
H2a (-)
GS->IB
1,107
0,213 ns
0,002
Rejected
H2b (-)
GS->EB
1,107
0,144 ns
0,021
H3 (+)
GS->EXP
1,171
0,294***
0,000 Accepted
H4a (+)
IS->EXP
1,666
0,419***
0,000 Accepted
Rejected
H4b (+)
ES->EXP
1,529
-0,008 ns
0,901
[0,150; 0,356] [0,155; 0,4] [-0,189; 0,28] [0,158; 0,359] [0,151; 0,413] [0,277; 0,529] [-0,134; 0,107]
Table 4.21: Summary of hypothesis test results P- β value 0,000 Accepted
Rejected
H5a (-)
IB-> EXP
1,247
18 0,068 ns
0,295
Rejected
H5b (-)
EB-> EXP
1,33
-0,003 ns
0,96
Accepted
H6a (-)
IS->IB
1,42
-0,267***
0,000
Rejected
H6b (-)
IS->EB
1,42
0,283 ns
0,000
Accepted
H6c (-)
ES->IB
1,454
-0,164**
0.023
Rejected
H6d (-)
ES->EB
1,454
0,14 ns
0.056
[-0,084; 0,203] [-0,128; 0,122] [-0,388; -0,095] [0,125; 0,42] [-0,288; -0,004] [-0,014; 0,275]
R2
EXP=0,31; R2
ES=0,084; R2
IB=0,142;
R2
IS=0,062; R2 R2
f2
EB=0,195 GS->ES=0,091; f2 GS->IB= 0,048; GS->EXP=0,098; f2
IS->EXP=0,152;
IB-> EXP=0,005; f2
EB->EXP=0,000;
IS->EB=0,07; f2
ES->IB=0,022; f2
ES->EB=0,017;
GS->IB= 0,057;
Q2
q2
GS->ES= 0,039; Q2 GS->EXP= 0,195 GS->ES=0,041; q2 GS->EXP= 0,06; q2
GS->IB= 0,018; IS->EXP=0,086;
IB->EXP=0,0025; q2
EB->EXP=-0,0025;
IS->EB=0,03; q2
ES->IB=0,0042;
f2 GS->IS=0,066; f2 f2 GS->EB=0,023; f2 f2 ES->EXP= 0,000; f2 IS->IB=0,058; f2 f2 GS->IS =0,03; Q2 Q2 GS->EB= 0,093 Q2 Q2 GS->IS=0,031; q2 q2 GS->EB=0,006; q2 q2 ES->EXP=-0,00124; q2 q2 IS->IB=0,024; q2 q2 q2 ES->EB=0,0066
β 0,508
Relationship GS->EXP
P-value 0,005
Multi-group analysis (PLS-MGA) Expectation P6a
Conclusion Partial difference
Geographi cal areas
IS -> EXP
0,511
0,016
Firm characteristics North vs South North: β =0,665***; South: β =0,157* South vs Central, Highland
IS->IB
-0,471
South: β=0,551***; Central, Highland: β=0,04ns 0,025 North vs South
0,142
0,014
North: β =-0,593***; South: β =-0,121 ns South vs Central, Highland
GS->IS ->EXP
Firm size
ES->IB
-0,728
0,042
P6b P6c
Rejected Partial difference
South: β=0,142***; Central, Highland: β=0ns from 11 to 15
19
Number of performance years
0,323
0,049
0,045
-0,568
IS->EXP
GS->ES
-0,344
0,036
GS->ES
P6d
Partial difference
IS->IB
-0,337
Number of export business years
P6e
Partial difference
Export mode
GS->EXP
0,005
0,417
P6f
Partial difference
Export market
Rejected
years vs below 5 years 11 to 15 years: β=-0,645**; below 5 years: β=0,082 ns from 5 to 10 years vs below 5 years 5 to 10 years; β=0,459*** ; below 5 years: β=0,136 ns 11 to 15 years vs 5 to 10 years 11 to 15 years: β=-0,006ns; 5 to 10 years: β=0,562*** Below 5 years vs above 15 years Below 5 years: β=0,222*; Above 15 years: β=0,566** 0,028 Export manufacture: β=-0,459***; Export trade: β=-0,122 ns ASEAN vs China ASEAN: β=0,471***; China: β=0,053ns
P6g
The variety of export products
Source: Author’s calculation
20
Note: **, *** corresponds to 5% and 1% significance levels; ns (non- significant): not statistically significant
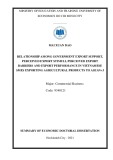
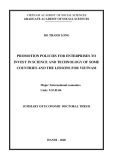
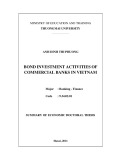
Firms’ geographical areas multi-group analysis (GS->EXP: North vs South; IS->EXP: South vs Central, Highland; IS->IB: North vs South; GS->IS->EXP: South vs Central, Highland) Number of performance years multi-group analysis (ES->IB: 11 to 15 years vs below 5 years; GS->ES: 5 to 10 years vs below 5 years; IS->EXP: 11 to 15 years vs 5 to 10 years) Number of export business years multi-group analysis (GS->ES: below 5 years vs above 15 years) Export mode multi-group analysis (IS->IB) Export market multi-group analysis (GS->EXP: ASEAN vs China)
Figure 4.1: Result of evaluation of structural equation model (including GS ‘s lower-order component) Source: Processing results from the author's survey data
4.6. Discussion 4.6.1. The effects of each construct in the research model
21
• There is a direct and indirect relationships between Government export
support and export performance that is similar to some studies by Ali and
Shamsuddoha (2007), Haddoud et al. (2017), Wang et al. (2017). The direct
effect of Government export support on export performance is stronger than
the indirect effect (β = 0.294 vs. β = 0.108). This result is different from
Karakaya and Yannopoulos (2012). The existence of an indirect relationship
has shown that the Government export support increases stimuli, reduces
export barriers, thereby contributing to the increase in the firm export
performance despite the indirect effect is smaller than direct effect. However,
only the perceived internal export stimuli make sense in this indirect effect.
The Government export support does not reduce the perceived export barriers
in order to contribute to the increase in export performance. This is discussed
with experts and is explained by the fact that Vietnamese SMEs have tried to
overcome export barriers even though they have not yet been able to access
Government support programs.
Government export support positively affects perceived internal and
external export stimuli with approximately equal effects (β=0.249 and β=
0.289). This is similar to some studies by Crick and Jones (2000), Brewer
(2001), Mencinger (2003).
It does not exist relationships among Government export support and
perceived internal, external export barriers. This shows that firms do not
appreciate the Government support to help them overcome internal and
external export barriers. This result is different from Karakaya and
Yannopoulos (2012), Shamsuddoha and Ndubisi (2009) studies.
There is a positive relationship between perceived internal export
stimuli and export performance which is similar to research by Stoian (2010),
Gilaninia et al. (2013), Anil et al. (2016) but differs from these authors'
research when there is no relationship between perceived external export
stimuli and export performance. With the effect of 0.419, it shows that firms
highly appreciate the perceived internal export stimuli which affect the results
of their export activities. Perceived external export stimuli do not affect export
performance. Through discussions with some experts, it is explained that the
22
external export stimuli are not important factors affecting the export
performance but for the business, in order to be successful in export activities,
the factors of firm resources and capability have a more important decisive
role.
It does not exist relationships among perceived internal, external
export barriers and export performance. According to firm ideas, although
they perceive some export barriers, when they are exporting to selected
markets, it means they realize more benefits than the difficulties they have and
try to overcome barriers to achieve export performance. This is also consistent
with Vida and Fairhurst (1998), Maharajh and Heitmeyer (2005), Anil et al.
(2016), Adu-gyamfi (2013), Sinkovics (2018), Jones (2018), Haddoud et al.
(2018).
Only the perceived internal export stimuli has a negative impact on
perceived internal export barriers and the perceived external export stimuli has
a negative impact on perceived internal export barriers. This is also consistent
with the RBV theory when firms possess unique resources, they can overcome
difficulties and barriers to success. The research results also show that there is
an indirect relationship between Government export support and the perceived
internal export barriers via perceived export stimuli.
4.6.2. The relationship differences in the research model based on survey
sample characteristics
- There is no differences in relationships among firms by firm size and the
variety of export products. There are some differences among firms by some
geographical areas, number of performance years, number of export business
years, export mode and export market. This result is similar to a single
relationship study as Suva and Rocha (2001) who found that firm
characteristics do not affect some perceived export barriers. Crick (1998),
Kneller and Pisu (2007) found that firm size does not affect the perceived
export barriers. Yannopoulos and Kefalaki (2010) found that exporting
experience does not affect the perceived export barriers. This result is partly
similar to the Malca et al. (2019) when it shows that there is no difference in
the relationships between Government support, internal resources and
23
performance by firm size, experience, export markets, business sectors and
the firm has the export department or not.
CHAPTER 5: CONCLUSION AND RESEARCH
IMPLICATION
5.1. Conclusions
Based on the background theory and empirical studies, the theoretical research
model and competitive model have been set up. Among 13 relationship
hypotheses, 6 hypotheses are accepted and 7 hypotheses are rejected which
meet the first objective. With the second research objective, the results of
testing the differences based on firm characteristics show that there are not
relationships differences among firms by size and the variety of the products.
The research results support the view that Government export support
increases the perceived export stimuli as resources and business capacity
increase due to the support, which in turn leads to success in export
performance (Czinkota, 1994). Thus, Government export support affects
export performance directly and indirectly through firm perceived internal
valuable resources. In addition, another result shows that although there is not
the direct relationship between the Government support and the perceived
internal export barriers, there is an indirect relationship between these two
factors via the perceived internal and external export stimuli.
5.2. Some managerial implication suggestions
Implication 1: From the relationship between the perceived internal export
stimuli and the export performance, firms need to improve their own
resources.
Implication 2: From the relationships among Government export support and
the perceived internal, external export stimuli, its export performance and
indirect relationship between Government support and the perceived internal
export barriers, firms should increase the use of support programs.
Implication 3: From the relationship between the Government export support
and the perceived external export stimuli, there is a need to increase
information support in export markets.
24
Implication 4: From the relationship between the Government export support
and the export performance, effective support programs should be provided.
Implication 5: From the relationship between the Government export support
and perceived internal export stimuli, it is necessary to provide a variety of
export support packages to increase firm resources.
Implication 6: From the test results showing the differences in some
relationships among firms with different characteristics, it shows the need in
designing support programs based on specific characteristics of each
businesses groups and specific groups of firms need special efforts to increase
firm resources.
5.3. Research limitations and directions for further research
Research limitations
- Sample size: Due to limited accessibility to the board of director members,
the sample size of this study was only 257 samples.
- Sampling method: due to limitation to approach the board of director
members, the sampling method of this study is convenience and snowball
sampling which are not good to have a completely exact result.
- Sample in qualitative research: due to the lack of relationship and difficulty
to access state management officials whose duties related to export support
programs, it is lacked of many practical ideas from these experts.
Directions for further research
- It is necessary to increase the sample size and select the sample quota evenly
across areas and use better sampling methods.
- Research on knowing and using Government support programs to draw more
realistic policy implications.
- Research on the moderator role of Government export support can increase
the impact of perceived export stimuli on export performance, and reduce the
impact of perceived export barrier on export performance.
- It is necessary to further study other firm internal and external factors that
affect the firms export performance.