MINISTRY OF EDUCATION AND TRAINING DEPARTMENT OF DEFENSE
MILITARY MEDICAL UNIVERSITY
HUYNH VAN KHOA
CHARACTERISTICS OF IMMUNE DISORDERS AND RESULTS OF PULSE METHYLPREDNISOLONE THERAPY IN SEVERE SYSTEMIC LUPUS ERYTHEMATOSUS
Specialization: Internal Medicine
Code: 9720107
SUMMARY OF DOCTORAL THESIS
HA NOI – 2018
THE THESIS WAS COMPLETED AT:
MILITARY MEDICAL UNIVERSITY
Full name of supervisor:
1. Associate Pr LE ANH THU
2. Associate Pr LE THU HA
Review 1: Associate Pr Nguyen Dang Dung
Review 2: Associate Pr Phan Quang Doan
Review 3: Associate Pr Dang Hong Hoa
The dissertation will be protected before the Board of thesis
dissertation at the Military Medical University
By the day month year
Can study thesis at
National Library of Vietnam
Library of Military Medical University
1
FOREWORDS
Systemic lupus erythematosus is a chronic disease characterized by a wide variety of clinical manifestations characterized by the production of autoantibodies that cause disorders of the immune system. Systemic lupus erythematosus can occur at any age, including children and older adults, but the incidence rate of women suffering from the disease accounts for 90% of the cases.
Clinical manifestations of the progression of the disease are usually in the skin, joints, hematology, organ damage (kidney, cardiovascular, respiratory ...). Severe internal organ damage is the direct or indirect cause of death. The use of highdose intravenous (pulse therapy) methylprednisolone for cases of flare severe systemic lupus erythematosus lifethreatening and many studies have shown to be effective.
In Vietnam, there are no studies that adequately assess the efficacy and safety of this therapy, especially in cases where lupus is a progressive multiorgan lesion. So we conducted this study with the following objectives: 1. Study some characteristics of immune disorders, analysis of association with target organ damage and activity level (SLEDAI score) in patients with severe systemic lupus erythematosus. 2. Evaluation of treatment outcome of pulsed methylprednisolone therapy combined with baseline treatment after 12 weeks in patients with severe systemic lupus erythematosus. Thesis structure
(cid:0)
The thesis has: forewords (3 pages), chapter 1: overview (40 pages), chapter 2: research subjects and methods (19 pages), chapter 3: research results (36 pages), chapters 4: Discussion (30 pages), and conclusions (2 pages), Recommendations (1 page)
(cid:0) In the thesis there are: 48 tables, 5 graphs, 2 diagrams.
(cid:0) The thesis has 167 references, including 16 in Vietnamese, 150
2
in English, 1 French.
3
CHAPTER 1 OVERVIEW
1.1. Autoimmune antibodies The autoimmune antibodies and their pathological evidence in patients with lupus are described in the table below: specific antibody Frequency % Main clinical manifestations
70 80 AntidsDNA Kidney, skin
60 90 Anti –Nucleosome Kidney, skin
30 40 Anti Ro
15 20 Anti – La Skin, kidneys, Fetal cardiovascular problem Fetal cardiovascular problem
1030 Anti – Sm Kidney disease
33 50 20 30 AntiNMDA receptor Anti–Phospholipid Encephalopathy Circumcision, miscarriage
20 α Anti Actinin Kidney disease
Anti C1q 40 50 Kidney disease
1.2. Immune characteristics in patients with SLE
Reduction of C3, C4 complement is a common manifestation of lupus erythematosus. The disorder of the immunoglobulin in patients with SLE is very diverse and depends on the level of activity of the disease. 1.3. Evaluations of progression and severe SLE manifestations 1.3.1. SLEDAI (Systemic Lupus Erythematosus Disease Activity Index) SLEDAI reviews consist of 24 components. SLEDAI scores range from 0 to 105 points Descriptor Score 8
4 2 Seizure, psychosis, organic brain syndrome, visual disurbance, neuropathy involving a cranial nerve, lupus headache, cerebrovascular accident, vasculitis Arthritis, Myositis, Casts, Hematuria, Proteinuria, Pyuria New malar rash, alopecia, mucous membranes, pleurisy, pericarditis, low complement, increased DNAbinding
4
Fever, thrombocytopenia, leukopenia 1 Evalation process value by SLEDAI Activity level SLEDAI score
Not active SLEDAI = 0
minor active SLEDAI 1 – 5
Average active SLEDAI 610
Severe active
Very severe active SLEDAI 1119 SLEDAI (cid:0) 20
1.3.2. Evaluation of severe organ damage (cid:0)
(cid:0)
(cid:0)
(cid:0) Lupus nephritis had nephrotic syndrome, reduced creatinine clearance> 25% during 3 months of followup. Proteinuria> 2g / day for 3 months of followup, glomerulonephritis progressing rapidly. Severe autoimmune hemolysis (Hb <7g / dl and Coombs test or Screening test (+)), severe thrombocytopenia <50 G / l and no response to high dose corticosteroid therapy. There are neurological or psychiatric disorders and there is evidence of brain damage on MRI. Interstitial lung disease, alveolar hemorrhage (cid:0) Myocarditis (cid:0)
Optic neuritis, retinal hemorrhage, multiple organ damage simultaneously. 1.4. Treatment of severe SLE
In many severe SLE, corticosteroid basic doses do not respond to treatment. Pulse Methylprednisolone (MP) therapy is usually indicated with or without other immunosuppressive agents.
1.5. Mechanism active of Corticosteroid in SLE (cid:0) Mechanism of action of corticosteroids in autoimmune disease through 2 processes is antiinflammatory and immunosuppressive. Corticosteroids inhibit the following: lymphocyte, neutrophil, monocyte, IL1stimulated T cells, Bcell transformations, IgG production, bioactive monocytes, cytokine production.
5
(cid:0)
Intravenous hight dose corticosteroid therapy (pulse MP): Usually used with very high doses of methylprednisolone (2501000 mg) intravenously for 3 consecutive days. This therapy is usually prescribed for severe SLE.
1.6. Research for the pulse MP (cid:0)
De GlasVos JW and colleagues studied pulse MP for severe lupus nephritis. (cid:0)
(cid:0) (cid:0) (cid:0)
Kovacs, Trevisani studied pulse MP lupus erythematosus with CNS involvement. Isenberg and colleagues studied the pulse MP for lupus activity Doan Van De studied pulse MP for severe lupus Pham Huy Thong studied pulse MP for severe lupus nephritis CHAPTER 2 SUBJECTS AND METHODS OF THE STUDY
2.1. SUBJECTS OF THE STUDY 2.1.1. Subjects of study: 112 patients were diagnosed with systemic lupus erythematosis based on ACR criteria in 1997 and showed severe progression was treated and monitored at Cho Ray hospital in HCMC from May/ 2011 through December 2015. 80 patients in 112 patients received pulse MP. 2.1.2. Criteria for selecting patients (cid:0) (cid:0) (cid:0) (cid:0) SLE diagnosis according ACR 1997 Severe SLE diagnosis according to Petri M SLEDAI scores ≥ 12 points And at least one of the internal organs is damaged as follows: Lupus nephritis with nephrotic syndrome: edema, proteinuria ≥ 3.5 g / 24 hours, hypoalbuminemia, hyperlipidemia
Lupus with central nervous system (CNS) involvement: Clinical manifestations of central nervous system invovement and cerebral MRI have typical brain lesions due to lupus. Eliminate neurological manifestations caused by other causes
Severe anemia due to autoimmune hemolysis: Hb <7 g / dl and direct Coombs (+) or screening test with presence of autoantibody. Severe pulmonary lesions due to lupus: haemorrage alveola or interstitial pneumonitis due to lupus, not due to bacterial infection or
6
tuberculosis
Acute myocarditis due to lupus.
7
2.1.3. Exclusion criteria (cid:0)
Patients with systemic lupus erythematosus are progressing but are not eligible for pulsed methylprednisolone therapy. (cid:0)
Patients with contraindication for pulse MP: peptic ulcer progressive, diabetes mellitus, poor contral hypertension, patients with severe electrolyte disturbances, severe glaucoma, patients pregnant. (cid:0) (cid:0) Patients are using other immunosuppressive drugs Patients with severe infection or progressive TB.
2.2. METHODS OF THE STUDY 2.2.1. study design
Descriptive study, crosssectional, longitudinal followup comparisons and posttreatment to evaluate treatment outcomes. collection patients convenience over time. 2.2.2. Clinical visit Each patient has a unified medical record according to the research sample (Appendix 1) (cid:0)
(cid:0) Patients admitted to the hospital were fully screened and evaluated for clinical manifestations and laboratory tests in a consistent format to determine the diagnosis of SLE and to assess the severity of the SLE. Select patients who are eligible for treatment for pulse MP therapy.
2.2.3. Laboratory testing and evaluation of results 2.2.3.1. Hematological tests
Peripheral blood count, rate of blood sedimentation, Coombs tests, Screening tests were performed at Cho Ray Hospital. Test results and hematological assessment are recognized in accordance with ISO 15189: 2012. 2.2.3.2. Routine biochemical tests 2.2.3.3. Urine test 2.2.3.4. Autoimmune antibodies tests
ANA tests were performed at the Hematological Center and other autoimmune antibodies: antidsDNA, antiSm, antiSSA (Ro), antiSSB (La) Cho Ray. Test results are also recognized in accordance
8
with ISO 15189: 2012. 2.2.3.5. Tests for C3, C4 and immunoglobulin 2.2.3.6. Tests for the cytokines TFNA, IL6, IL10 2.2.4. Treatment regimen Pulse MP
therapy: Patients were treated with 1 g methylprednisolone (MP) / day as recommended by the American Rheumatology Association, which was administered for 3 consecutive days. Methylprednisolone 1 g diluted in 100 ml sodium and infusion intravenous for 1 hour, the patient is monitored by monitor. Patients are closely monitored clinically: pulse, heat, blood pressure, weight, urine / 24 hours, monitoring of cardiac, pulmonary, digestive and full status.
Management of side effects may occur during and after pulse MP. Treatment basic: After MP therapy, patients continued to receive Methylprednislone 1mg / kg / day orally, Hydoxychloroquine, and other medications: hypotension, calciumD, potassium supplementation. , medications for symptomatic relief and other prophylaxis if needed. Evaluate the response to treatment and followup of side effects at the time of the visit according to the study sample. 2.2.5. Result evaluation (cid:0) (cid:0)
(cid:0)
Evaluation of immune dysfunction in 112 severe SLE patients Evaluation of treatment response based on changes in antidsDNA antibody levels before and after treatment for 1 week, 4 weeks and 12 weeks. Evaluation of treatment response based on changes in C3, C4, Ig MD before and after MP treatment 1 week, 4 weeks and after 12 weeks. (cid:0)
(cid:0)
Evaluation of treatment response was based on changes in cytokine TNFA, IL6, IL 10 before and after MP treatment for 1 week and 4 weeks. Overall treatment response was based on SLEDAI changes before and after treatment at 1 week, 4 weeks and 12 weeks, and divided the response based on SLEDAI score of decline according to ACR . (cid:0)
For lupus nephritis with syndrome nephrotic , we evaluated the response based on the Kedney Disease Improving Global Outcomes Complete response: (KDIGO 2012) guidelines as follows:
9
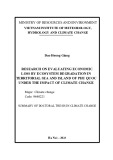
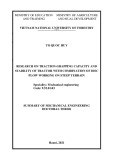
Proteinuria <0, 5 g / 24h, blood albumin ≥ 3 g / dL, GFR> 60 ml / min or improvement of eGFR> 50% vs. pretreatment, no red blood cell, urolith. Partial response: Reduction in creatinine clearance> 50% vs. pretreatment, blood serum albumin <3 g / dL and improvement of eGFR> 50% vs. pretreatment. Not responding: (cid:0) Proteinuria> 3g / 24h, decreased urinary protein <50% compared with before treatment, reduced eGFR <20% compared with pre treatment. 2.2.7. Study diagram
10
Clinical examination, tests and selection Patients are eligible critica for study
112 severe SLE
80 patients treated with pulse MP Characteristics of immune disorders Related analysis
Evaluation of pulse MP therapy efficacy after 1 week
Evaluation of pulse MP therapy efficacy after 4 weeks
Evaluation of pulse MP therapy efficacy
after 12 weeks
Report on study results
11
CHAPTER 3 RESULTS OF THE STUDY 3.1. Distribution of patients by age and sex
The highest rates of patients in the age group of 2029 years, accounting for 45.5%, for the age group of 2039 years, accounting for 68.2%, the majority femele accounting for 90.2%
3.2. Characteristics of immune disorders in severely SLE, associated with some immunological indices with organ damage and with the SLEDAI score.
3.2.1. Characteristics of immune disorders in severely SLE
3.2.1.1. Characteristics of autoimmune antibodies
Table 3.1. Characteristics of autoimmune antibodies
Autoimmune Ratio % antibodies (+) Number of patients (n=112)
ANA 110 98.2
AntidsDNA 89 79.5
Anti Sm (n= 103) 44 42.7
AntiCardiolipin IgM (n=103) 7 6.8
AntiCardiolipin IgG (n=103) 28 27.2
AntiSSA (Ro) (n=102) 52 51.0
AntiSSB (La) (n=100) 13 13.0
The rate of ANA (+) was 98.2%, antidsDNA (+) was 79.5%, antiSm was 42.7%.
12
3.2.1.2. Characteristics of complements levels and immunoglobulins levels
Table 3.2. Characteristics of the complements levels and immunoglobulins levels Index immunoglobulins Ratio %
Number of patients (n=112) 106 C3 reduction (n=112) 94.6
C4 reduction (n=112) 71 63.4
IgA increase (n=109) IgE increase (n=95) 9 76 8.3 80.0
25.7 9.2 28 10
IgG increase (n=109) IgM increase (n=109) C3 decrease rate was 94.6%, C4 decrease was 63.4%, IgE increased 80% 3.2.1.3. Characteristics of cytokine levels Table 3.3. Characteristics of cytokine levels Ratio % Cytokine Pg/mL
Number of patients (n=112) 38 40.4 TNFA Increase
Medium (minmax) 25.69 ± 67.45 (1.5 – 506)
90 95.7 IL6 Increase
Medium (minmax) 53.16 ± 155.14 (0.43 – 1495)
80 85.1 IL10 Increase
Medium (minmax) 24.64 ± 154.36 (0.02 – 1496)
TNFA increased 40.4%, IL6 increased 95.7% and IL10 increased 85.1%. 3.2.2. Relate some of the immunity indicators and organ damage 3.2.2.1. Autoimmune antibodies and organ demage 3.2.2.1.1. Autoimmune antibodies and kidney lesion
13
Table 3.4. Comparison of serum antibodies levels between the presence and absence of kidney lesion
Kidney lesion
[Median (quartile)] Antibodies P Value Have (n=86) Are not (n=26)
AntidsDNA UI/mL (n=112) 0.436 240.0 (78.63 240.0) 210.1(60.45 240)
AntiCardiolipin IgM U/mL (n=103) 2.0 (2.02.98) 4.6 (2.06.4) 0.014
AntiCardiolipin IgG U/mL (n=103) 5.75 (2.021.98) 3.8 (2.812.7) 0.833
Anti –Sm UI/mL (n=103) 6.35 (2.6333.98) 18.8 (5.0100) 0.021
AntiSSA (Ro) UI/mL (n=100) 8.5 (2.1100) 40.6 (2.8100) 0.160
AntiSSB (La) UI/mL (n=100) 3.5 (1.15.85) 2.5 (1.36.2) 1
The levels of antidsDNA were higher in the group with kidney lesion but not statistically significant.
3.2.2.1.2 Autoimmune antibodies and hematologic disorders
Table 3.5. Comparison of autoimmune antibody levels between and without hematologic disorders
Hematological disorders [Median (quartile)] Antibodies P Value Have (n=90) Are not (n=22)
59.05(24.95239.90) <0.001 AntidsDNA UI/mL 240.0 (115.13 240.0)
2.0 (2.04.6) 2.0 (2.003.83) 0.621 AntiCardiolipin IgM U/mL
8,3 (2,329,6) 2.45 (2.003.60) 0.001 AntiCardiolipin IgG U/mL
Anti –Sm UI/mL 7,0 (2,9333,98) 18.8 (3.6100.0) 0.336
Concentration levels of antidsDNA and antiCardiolipin IgG
14
were significantly higher (p <0.001 and p = 0.001) in the hematologic disorder group than in the nonhaematological disorder group. 3.2.2.3. Relation of cytokine concentrations levels and organ damage 3.2.2.3.1. Cytokine concentrations levels and kidney lesion Table 3.6. Comparison of cytokine concentrations levels between kidney lesion group and without kidney lesion gruop
Kidney lesion [Median (quartile)] P Value Cytokine pg/mL
0.050 0.221 have (n=86) 9.76 (6.8217.45) 11.05 (5.4126.85) Are not (n=26) 6.53 (4.4913.86) 17.61 (9.0845.90) TNFA (n=94) IL6 (n=94) IL10 (n=94) 0.738 5.01 (3.109.17)
4.93 (2.889.17) TNFA levels in the kidney lesion group may be higher 3.2.2.3.2. Cytokine levels and hematologic disorders
Table 3.7. Comparison of cytokine levels between and without hematologic disorders
Hematological disorders [Median (quartile)] P Value Cytokine pg/mL have (n=90) Are not (n=22)
TNFA (n=94) IL6 (n=94)
9.97 (6.8119.33) 14.39 (6.2535.06) 4.90 (2.879.21) 6.42 (4.359.22) 10.25 (3.1418.26) 7.08 (3.699.12)
0.024 0.149 IL10 (n=94) 0.514 There was a statistically significant difference (p = 0.024) in TNFA levels between the two groups with haematological disorders and no haematological disorders. 3.2.2.3.3. Cytokine levels and CNS involvements
Table 3.8. Comparison of cytokine levels between the presence and absence of CNS involvements
CNS lesions [Median (quartile)] p value Cytokine pg/mL have (n=32) Are not (n=80) TNFA (n=94) 9.89 (7.5817.87) 9.19 (6.1417.04) 0.521
IL6 (n=94) 18.26 (9.8134.46) 11.73 (4.8327.84) 0.192
15
IL10 (n=94) 8.46 (4.6911.58) 4.54 (2.378.51) 0.020
There was a statistically significant difference (p = 0.020) in IL10 levels between the two groups with CNS involvements and no CNS involve. 3.3. Relation of autoimmune antibodies levels, complements, immunoglobulins, cytokine and disease activity (SLEDAI)
3.3.1. Relation of autoimmune antibodies levels and SLEDAI
3.3.1.1. Relation of autoimmune antibodies levels and SLEDAI
Table 3.9. Relation of autoimmune antibodies levels with SLEDAI score
SLEDAI
[Median (quartile)] Antibodies p value 1219 points (cid:0) 20 points (n=74) (n=38)
AntidsDNA 117.8 (40.7240.0) 240.0 (128.2240.0) 0.005
AntiCardiolipin IgM 2.0 (2.04.63) 2.0 (2.03.8) 0.494
AntiCardiolipin IgG 3.15 (2.014.03) 8.0 (2.0521.95) 0.187
Anti Sm 7.5 (3.953.9) 7.0 (2.7854.80) 0.712
AntidsDNA level were statistically significantly higher (p = 0.005) in the very active group (SLDAI ≥ 20).
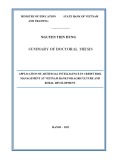
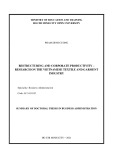
3.3.1.2. Correlation of antidsDNA levels and SLEDAI
r = 0.251
p = 0.007
16
Chart 3.1: Correlation between antidsDNA levels and disease activity (SLEDAI) Regression equation: SLEDAI = 0.023 x antidsDNA + 19.78 The level of antidsDNA associated with SLEDAI was proportional to r = 0.251 and p = 0.007.
3.3.2. The average concentration of complement with SLEDAI
3.3.2.1. The average concentration of complements with SLEDAI
Table 3.10. Relation of complement levels with SLEDAI score
SLEDAI Complement p value (cid:0) mg/dL 1219 points (n=38) 20 points (n=74)
C3 (n=112) 50.15 ± 30.62 34.01 ± 18.19 0.001
C4 (n=112) 12.74 ± 9.11 9.80 ± 6.97 0.059
Mean C3 concentrations were significantly lower in the SLE group and were significantly associated with a SLEDAI score (p = 0.001).
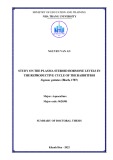
3.3.2.2. Correlation between complement with SLEDAI
r = 0.267
p = 0.004
Chart 3.4: Correlation between serum levels of C3 and SLEDAI Regression equation: SLEDAI = 0.093 x C3 + 27.37; C3 concentration was negatively correlated with the SLEDAI score with r = 0.093 and p = 0.004.
17
3.4. Results of pulse PM therapy in severe SLE 3.4.1. Changes of autoimmune antibodies levels
18
Table 3.11. Characteristics of changing antidsDNA levels
after treatment p value Before treatment 1 W 4 W 12 W
AntidsDNA UI/mL p01 p02 p03
(n=80) n % (n=80) n % (n=80) n % (n=79) n %
63 (78.8) 43 (53.8) 31 (38.8) 23 (29.1) <0.001 <0.001 <0.001 Increase ≥ 50 UI
<0.001 <0.001 <0.001
Median (Quartiles) 240.0 (65.2 240.0) 52.3 (20.3 22.6) 36.4 (16.4 80.4) 26.6 (14.3 54.3)
min max 4.9 – 240 3.29 – 240 0.85 – 240 0.79 – 137.6
The rate of antidsDNA (+) and antidsDNA levels decreased after treatment for 1 week, 4 weeks and 12 weeks 3.4.2. Caracteristics of change C3, C4 and immunoglobulins levels Table 3.12. Changes in C3, C4 and immunoglobulins levels
after treatment P value
Before treatment 1 w 4 w 12 w p01 p02 p03 Index mg/dL (n=80) (n=80) (n=80) (n=79)
C3 <0.001 <0.001 41.67 ± 25.27 55.40 ± 22.19 79.54 ± 23.32 90.23 ± 20.27 <0.00 1
C4 <0.001 <0.001 10.95 ± 7.86 13.53 ± 7.48 18.84 ± 9.02 20.75 ± 10.10 <0.00 1
IgA 0.091 <0.001 0.001 246.24 ± 103.30 206.32 ± 83.60 207.82 ± 80.01 225.18 ± 83.19
IgE 0.001 0.052 <0.001 545.17 ± 587.51 353.92 ± 468.08 366.26 ± 721.44 188.61 ± 214.94
IgG <0.001 0.023 1170.72 ± 611.70 943.86 ± 526.55 944.76 ± 402.17 1007.95 ± 359.58 <0.00 1
19
after treatment P value
0.173 0.786 0.005 104.75 ± 59.87 115.78 ± 61.79 129.52 ± 53.23 Index IgM mg/dL Before 132.16 ± treatment 101.27 Increased C3, C4 levels, decreased immunoglobulins levels
after treatment 1 week, 4 weeks and 12 weeks 3.4.3. Changes in cytokine levels Table 3.13. Cytokine change before and after treatment
After treatment P value Before treatment Cytokine
ầ n % 1 tu n n %ầ 4 tu n n % p01 p02 pg/mL
28 (42.4) 20 (32.8) 9 (15.8) Increased TNFA 0.052 <0.001
9.40 (6.42 17.52) 8.26 (4.92 14.72) 6.72 (4.78 8.77) Median
64 (97.0) 58 (95,1) 55 (96.5) Increased IL6 0.621 0.026
10.37 (4.62 23.46) 10.47 (4.61 20.01) 7.44 (3.34 13.36) Median
56 (84.8) 44 (77.2) 54 (88.5) Increased IL10 0.036 0.036 4.23 (2.696.81) 4.89(3.05 8.44) 3.21 (2.12 7.16) Median
IL10 was significantly reduced after 1 week of treatment (p = 0.036). Increases in TNFA, IL6, IL10 and TNFA, IL6, IL10 levels were significantly reduced after 4 weeks of treatment
20
3.4.4. Evaluation of overall treatment response across the SLEDAI Score
Table 3.14. Comparison of SLEDAI score before and after treatment
after treatment P value
1 w 4 w 12 w Before treatm ent SLEDAI p01 p02 p03
(n=80) n % (n=80) n % (n=80) n % (n=79) n %
28 (35.0) 71 (88.8) 79 (98.8) 79 (100) 12 19 points <0,001 <0,001 <0,001 ≥ 20 points 52 (65.0) 9 (11.3) 1 (1.3) 0
Mean <0.001 <0.001 <0.001 23.33 ± 8.04 14,03 ± 6.43 8.63 ± 4.58 6.85 ± 3.83
(min max) 1249 242 029 018
SLEDAI score in both high and very active groups were reduced by one week, after 4 weeks and after 12 weeks of treatment. The mean score of SLEDAI was decreasing over time: before treatment was 23.33 ± 8.04, after 1 week it was reduced to 14.03 ± 6.43, after 4 weeks 8.63 ± 4.58 and after 12 weeks week 6.85 ± 3.83 points. 3.4.5. Evaluation of treatment response for lupus nephritis with nephrotic syndrome
P value Response Table 3.15. Treatment response level of patients with nephrotic syndrom After 4 w (n=47) After 12 w (n=47) after 1 w (n=47)
Completely 0 3 (6.4%) 9 (19.1%)
partian 15 (31.9%) 24 (51.1%) 33 (70.2%) <0.001 Not responding 32 (68.1%) 20 (42.6%) 5 (10.6%)
After 1 week: no patients completely responsive, 31.9% partian responsive, 68.1% not responsive. After 4 weeks: 6.4% completely responsive, partian 51.1%, not responding 42.6%. After 12 weeks:
21
completely responsive 19.1%, partial 70.2%, not responding 10.6%
22
3.4.6. Evaluate the adverse effects of the therapy Table 3.16. Adverse effects of therapy Adverse effects of therapy 1 w n% 4 w n% 12 w n%
10 (12.5%) Severe infection
8
1 Pneumonia Tuberculosis (lung) Urinary infection 1
2 (2.5%) Epigastric pain
dyslipidemia
Hyperglycemia 1(1.3% ) Electrolyte disorders
2 (2.5%) 1 (1.3%) Hypertension 6 (7.5%) Atrial fibrillation
12 (15%) Cushing syndrome
psychosis
Osteoporosishead bone necrosis
The most noticeable adverse effects after 1 week of treatment: severe infection 12.5%, epigastralgia 2.5%, hypertention 2.5%. Cushing syndrome after 12 weeks of treatment is 15%.
CHAPTER 4 DISCUSSION 4.1. General characteristics of age and sex
The mean age of the study group was 25.65 ± 7.71, with the prevalence of the disease ranging from 20 to 29 years old to 45.5%. Aging age is also consistent with many other studies in and outside the country. 4.2. Characteristics of immune disorders in severely SLE, associated
23
with some immunological indices with organ damage and with the SLEDAI score. 4.2.1. Characteristics of immune disorders in severe SLE 4.2.1.1. Characteristics of autoimmune antibodies
The autoimmune antibodies in the study group showed that ANA positive was 98.2%, antidsDNA 79.5%, antiSm 42.7%, anti Cardiolipin IgM 6.8%, antiCardiolipin IgG 27.2%, antiSSA 51%, anti SSB 13%. According to study Pham Van Thuc, the rate of ANA (+) 66.76%, antidsDNA (+) 60.92%, study of Hoang Tram Anh, the rate of antidsDNA (+) 60.5%. AlShamahy's study showed that ANA (+) 95.3%, antidsDNA (+) 59.7%, antiSm (+) 27.5%. Our study had a number of autoantibodies similar to those found in Cervera, which showed ANA (+) 96%, antidsDNA (+) 78%, antiSm (+) 10%, anti Cardiolipin IgM (+) 13%, antiCardiolipin IgG (+) 24%, antiSSA (+) 25%, antiSSB (+) 19%.
Autoimmune antibodies in severe SLE are diverse and abundant. The rate of autoimmune antibodies may vary according to study. Antibodies with a high positive rate such as ANA are very valuable in the diagnosis of SLE. In addition, ANA has a positive rate for almost all SLE patients, it is also very valuable in the diagnosis exclusion of SLE when ANA negative. 4.2.1.2. Characteristics of complements levels and immunoglobulins levels
Results showed that most patients had a decrease in C3 (94.6%) and C4 (63.4%). This study was consistent with many studies on C3, C4 levels in SLE. Some studies have shown that C3 and C4 levels are associated with disease activity and are one of the indicators that can be used to monitor the disease status and assess the response to treatment. About the immunoglobulins in this study we found that 80% had increased IgE. According to a study by Liphaus et al., IgE was found to increase in 45% of patients with lupus. 4.2.1.3. Characteristics of cytokine levels (TNFA, IL6, IL10)
Results showed that TNFA levels in this study were 40.4%, almost all patients showed increased IL6 levels of 95.7% and IL10 levels of 85.1% . Cytokines play an important role in the pathogenesis of SLE, and some studies have shown a correlation between cytokine levels and
24
target organ damage, which is important in the pathogenesis of SLE.
Postal's study showed that elevated TNFA levels in active SLE compared with controls, and Maury's study showed that there was an increase or no increase in TNFA in SLE patients. Our study showed that the TNFA increase was lower than that of Studnicka, in which 85% TNFA was increased, and TNFA levels were associated with active SLE. The IL6, IL10 are two cytokines that play an important role in the pathogenesis of SLE. According to Llorente's study, IL10 is increase in active SLE and plays an important role in the pathogenesis of SLE. 4.2.2. Analysis of the association between autoimmune antibodies, complements levels, cytokine levels and target organ damage. 4.2.2.1. Autoimmune antibodies and target organ demage
We analyzed the levels of some autoimmune antibodies with target organ damage by evaluating group of arthritis and no arthritis, hematologic disorders and no haemorrhagic disorders, no kidney lesion and no kidney lesion and CNS involvement and no CNS involvement to find correlation between autoimmune antibody and target organ damage
The role of antidsDNA is related to the activity of the disease, some studies have also shown that the antidsDNA increases before the onset of the disease. Alba's study shows that antidsDNA and antiSm levels may be associated with lupus nephritis. The results of our study found that mean of antidsDNA levels in the kidney lesion group were higher than those without kidney lesion but not statistically significant, and mean of antiSm levels differed these two groups (p = 0.021) and this is also fit with the Arroyo M study; suggesting that antiSm may be related in specific organ damage such as kidney, central nervous system, hematological and vascular inflammation in SLE. 4.2.2.2. Complements levels, immunoglobulins levels and target organ damage.
We found that serum IgG levels were associated with arthritis, haematological disorders and kidney lesion in SLE. This finding is consistent with studies by Cass et al., Who showed that the levels of IgG were related to the active disease, and anemia in SLE. We also found that IgG levels were associated with renal impairment, which is consistent with study of Yap et al; found that 26% of nephritis lupus have reduction IgG levels and associated with proteinuria status in active SLE. Our study are consistent with the findings of Ktona et al; regarding
25
the association of C3, C4 reduction with thrombocytopenia and leucopenia in SLE.
C3, C4 levels and immuniglobuoins disorders in SLE may be associated with some target organ damage, reduced IgG levels associated with kidney lesion and some differences lesions in active SLE, low C3, C4 levels may be associated with haematological disorders in SLE. 4.2.2.3. Cytokines levels with target organ damage
We found that TNFA levels may be associated with kidney lesion and haematological disorders (with p = 0.050 and p = 0.024), which is consistent with Herrera E's study of the role of TNFA in nephritis lupus, and also similar with Postal's review of the role of TNFA with organ damage in the flare of SLE. In this study we also found differences in IL10 levels between the CNS involvement group and the nonCNS involvement group and this is consistent with McCarthy's study of the role of some cytokines in organ damage in SLE. In this study, we did not find any difference in IL6 levels with organspecific lesions. Research by Zhihua Yin on the study of eight cytokines including TNFA, IL6, and IL10 also showed that the role of IL10 is related to disease activity, however, relared with specific organ lesions is unclear. 4.2.3. Relation of autoimmune antibodies levels, complements, and disease activity (SLEDAI) 4.2.3.1. Relation of autoimmune antibodies levels and SLEDAI
The relationship between the level of antibodies and the severity of the disease was found to be related to the level of antidsDNA and activity disease and statistically significant and also to other studies. According to the results of the study, we found that the levels of other antibodies not related to active disease. In addition to antidsDNA, CRP, ferritin, C3, C4, some cytokines, Bcell markers, antinucleosomes, and antiC1q are biological indicators that are related with active SLE.
Results showed that antidsDNA was correlated with disease activity with coefficient r = 0.251, p = 0.007. This finding is consistent with many studies on the role of antidsDNA in the evaluation of SLE activity. Thus, antidsDNA is not only a diagnostic value but also a measure of the level of active SLE. 4.2.3.2. The relationship between the complements levels and SLEDAI
26
In relation to the concentration and activity of the disease, we found that C3 levels were statistically related to the activity of the disease. According to some studies, the complements levels are related to active disease and this is consistent with our results.
The correlation between C3 and SLEDAI showed that the C3 level was related to the activity of SLE with correlation coefficient of C3 with SLEDAI r = 0.267, p = 0.004. This finding is consistent with other studies of the role of C3 in the assessment of SLE activity
4.3. Results of pulse PM therapy in severe SLE 4.3.1. Changes of antidsDNA levels
ặ ấ ằ ủ ệ ạ ộ ộ
The rate of patients with an antidsDNA antibody titre of ≥ 50 UI decreased before and after treatment and decreases over time, and the antidsDNA level is also decreases with time after pulse MP. Thus, the antidsDNA level decreases with the degree of response to treatment and is also consistent with other studies evaluating the role of antidsDNA in the assessment of disease activity and treatment monitoring. Nghiên c uứ ẽ ớ ủ c a Narayanan cho th y r ng antidsDNA có liên quan ch c ch v i Narayanan's study shows that anti ứ m c đ ho t đ ng c a b nh. dsDNA is related to the degree of activity of the disease. Arbuckle's study shows that elevated antidsDNA also has a prognostic value for SLE before clinical manifestations. According to a review by Reveille, antidsDNA levels have prognostic value, target organ damage, and assessment of treatment response.
AntidsDNA levels decreased after pulse MP therapy at weeks 1, 4, and 12 weeks. AntidsDNA levels reduced have the relation to responsive treatment with this therapy. Thus, the pretreatment and post treatment antidsDNA levels are useful in assessing the response to treatment, in addition to monitoring the antidsDNA level as well as the prognostic value of the disease. 4.3.2. Caracteristics of change C3, C4 and immunoglobulins levels
Changes in C3, C4 levels were statistically significant after 1 week, 4 weeks and 12 weeks with pulse MP. Narayaran's study shows that C3, C4 levels are valuable in assessing SLE activity and are significantly associated with SLEDAI.
Evaluation of changes in IgA, IgE, IgG and IgM levels was found to be statistically significant after 1 week of pulse MP. According
27
to Eyanson's assessment of the effect of pulse MP in patients without kidney lesion, also reported to reduce IgG after pulse MP therapy, but according to a review of Kurki's study the effect on immunoglobulins with pulse MP did not always indicate a decrease in immunoglobuins levels after pulse MP therapy.
Pulsed MP therapy improves C3, C4 and reduces some of the immunoglobulins observed at weeks 1, 4 and 12 weeks after treatment in this study. Monitoring of C3, C4, immunoglobulins and SLEDAI score was used to assess treatment response and prognosis. 4.3.3. Changes in cytokine levels
IL10 was significantly reduced after 1 week of treatment (p = 0.036). Increases in TNFA, IL6, IL10 and TNFA, IL6, IL10 levels were statistically significantly decreased after 4 weeks of pulse MP. This result is consistent with the mechanism of action of pulse MP on reduction of cytokine production and also in accordance with Bai's study, the TNFA level decreased after pulse MP.
Thus, TNFA, IL6 and IL10 plays an important role in the mechanism of SLE, pulse MP therapy reduces the cytokines levels at observation time after 1 week, after 4 weeks. 4.3.4. Evaluation of overall treatment response across the SLEDAI score
The average SLEDAI score was 23.33 (SLEDAI score ≥ 20 points is 65%). The SLEDAI score was statistically significantly reduced after 1 week, 4 weeks and 12 weeks after pulse MP therapy; Specifically, SLEDAI scores an average of 14.03 points after 1 week, 8.63 points after 4 weeks (SLEDAI ≥ 20 points is 1.3%), and after 12 weeks SLEDAI average score is 6.85 points (no patients with SLEDAI score ≥ 20 points). This study is also consistent with Pham Huy Thong's study of the effect of pulse MP in nephritis lupus. 4.3.5. Evaluation of treatment response for lupus nephritis with nephrotic syndrome
In 80 patients of pulse MP therapy in our study have 47 patients with diagnosis of nephrotic syndrome (58.75%). We evaluated the effectiveness of pulse MP therapy for this group, we performed subgroup analyzes of several characteristics and evaluated the response of pulse MP therapy on this group. We found that the response rate after pulse MP therapy was as
28
follows: after 4 week response completely was 6.4%, after 12 weeks it was 19.1%, the response partial was 51.1% 4 weeks and after 12 weeks were 70.2%. The rate of patients who did not respond after 4 weeks was 42.6% and after 12 weeks it was 10.6%.
Results of Pham Huy Thong' sdudy showed that after 1 month of treatment, the complete response was 14.28%, partially response was 50%, not response was 35.72%; After 3 months of treatment: The complete response was 32.14%, partially response was 35.71%, not response was 32.1%. Thus pulse MP therapy was quite satisfactory results for lupus nephritis with syndrome nephrotic. 4.3.9. Evaluate the adverse effects of the pulse MP therapy
The adverse effects of pulse MP therapy were observed in the 12 weeks most notable severe infection was 12.5%, especially in the first week after treatment.
CONCLUSIONS
Study to characteristics of immune disorders in 112 severe SLE and followup treatment for 80 patients with pulse MP we had some conclusions as follows:
1. Characteristics of immune disorders in severely SLE, associated with some immunological indices with organ damage and with the SLEDAI score.
1.1. Characteristics of immune disorders
The ANA (+) ratio was 98.2%, antidsDNA (+) 79.5%, antiSm (+) 42.7%, anti Cardiolipine IgM (+) 6.8%, antiCardiolipine IgG (+) 51%, antiRo (+) 51%, antiLa (+) 13%. The C3 decrease was 94.6%, C4 63.4%, IgA 8.3%, IgE 80%, IgG 25.7%, and IgM 9.2%. TNFA increased 40.4%, IL6 increased 95.7%, IL10 increased 85.1%.
1.2. Relate some of the immunity indicators and organ damage
Antibody levels of antidsDNA and antiCardiolipin IgG have been associated with haematological disorders, anticardiolipin IgM level have been associated with kidney lesion. C3, C4 levels are related to hematologic disorders. TNFA levels may be associated with kidney lesion and hematologic disorders, IL10 levels have been associated with CNS involvement.
29
1.3. Relate some of the immune indicators to the activity of the disease (SLEDAI)
AntidsDNA, C3 levels are associated with the SLEDAI score
2. Results of pulse PM therapy in severe SLE
2.1. Changes of autoimmune antibodies levels, complements levels, immunoglobulins levels, cytokine levels
AntidsDNA levels decrease after pulse MP therapy. Increased levels of C3, C4, decreased the concentration of some immunoglobulins after treatment. TNFA, IL6, IL10 levels decreased after pulse MP therapy.
2.2. Effectively improve SLEDAI score
Average SLEDAI score were statistically significantly decreased after pulse MP
2.3. Effective of pulse MP in nephritis lupus with nephrotic syndrome after 12 weeks
Completely response 19.1%, partially response 70.2%, not response 10.6%.
2.4. The adverse effects of the pulse MP therapy
It is notable that severe infection after pulse MP accounts for 12.5% especially in the first week after treatment.
RECOMMENDATIONS
(cid:0) Pulse MP therapy is effective for severely progressive SLE with
multiple organ damage. This therapy should be used in clinical
practice
(cid:0) Indicators such as C3, andidsDNA, SLEDAI should be applied in
clinical practice to monitor and evaluate treatment response
(cid:0) Studies on cytokine concentrations in SLE patients in the country
are not well documented, and larger studies are needed to fully
30
assess the role of cytokines in SLE.