
RESEA R C H Open Access
Immunostaining of modified histones defines
high-level features of the human metaphase
epigenome
Edith Terrenoire
1,2†
, Fiona McRonald
1,3†
, John A Halsall
1
, Paula Page
2
, Robert S Illingworth
4,5
, A Malcolm R Taylor
6
,
Val Davison
2
, Laura P O’Neill
1
, Bryan M Turner
1*
Abstract
Background: Immunolabeling of metaphase chromosome spreads can map components of the human
epigenome at the single cell level. Previously, there has been no systematic attempt to explore the potential of
this approach for epigenomic mapping and thereby to complement approaches based on chromatin
immunoprecipitation (ChIP) and sequencing technologies.
Results: By immunostaining and immunofluorescence microscopy, we have defined the distribution of selected
histone modifications across metaphase chromosomes from normal human lymphoblastoid cells and constructed
immunostained karyotypes. Histone modifications H3K9ac, H3K27ac and H3K4me3 are all located in the same set
of sharply defined immunofluorescent bands, corresponding to 10- to 50-Mb genomic segments. Primary
fibroblasts gave broadly the same banding pattern. Bands co-localize with regions relatively rich in genes and CpG
islands. Staining intensity usually correlates with gene/CpG island content, but occasional exceptions suggest that
other factors, such as transcription or SINE density, also contribute. H3K27me3, a mark associated with gene
silencing, defines a set of bands that only occasionally overlap with gene-rich regions. Comparison of metaphase
bands with histone modification levels across the interphase genome (ENCODE, ChIP-seq) shows a close
correspondence for H3K4me3 and H3K27ac, but major differences for H3K27me3.
Conclusions: At metaphase the human genome is packaged as chromatin in which combinations of histone
modifications distinguish distinct regions along the euchromatic chromosome arms. These regions reflect the high-
level interphase distributions of some histone modifications, and may be involved in heritability of epigenetic
states, but we also find evidence for extensive remodeling of the epigenome at mitosis.
Background
Large scale projects are underway to map the epigen-
omes of various eukaryotes, including humans. The
objective is usually to define the distribution across the
genome of modified histones, various non-histone
proteins or methylated cytosines, and then link these
modifications to genomic functions [1-3]. Genome-wide
analyses have been made possible by coupling the long-
established technique of chromatin immunoprecipitation
(ChIP) with either high density DNA microarrays
(ChIP-chip) or next-generation DNA sequencing (ChIP-
seq) [4]. These powerful technologies require material
from large numbers of cells and the data generated
inevitably represent a mean value derived from cells
with differing patterns of expression from a significant
subset of genes. Differences can arise through intrinsic
transcriptional noise or because cells are in different
phases of the cell cycle. Such cell to cell heterogeneity
inevitably limits the precision with which histone modi-
fications can be linked to chromatin function.
In principle, this issue can be addressed by using immu-
nomicroscopy to examine the distribution of histone
modifications at the single cell level. Metaphase chro-
mosome spreads provide a source of material in which
* Correspondence: b.m.turner@bham.ac.uk
†Contributed equally
1
Chromatin and Gene Expression Group, Institute of Biomedical Research,
College of Medical and Dental Sciences, University of Birmingham,
Edgbaston, Birmingham B15 2TT, UK
Full list of author information is available at the end of the article
Terrenoire et al.Genome Biology 2010, 11:R110
http://genomebiology.com/2010/11/11/R110
© 2010 Terrenoire et al.; licensee BioMed Central Ltd This is an open access article distributed under the terms of the Creative
Commons Attribution License (http://creativecommons.org/licenses/by/2.0), which permits unrestricted use, distribution, and
reproduction in any medium, provided the original work is properly cited

individual chromosomes can be identified and in which
the entire human epigenome can be scanned in a single
cell. This approach has several additional advantages:
there is little or no transcription at metaphase, removing a
major source of variability between cells, consistency from
cell to cell can be monitored, fluorescent probes are extre-
mely sensitive (offering detection at the single gene level if
required) and the procedure is quick (once experimental
conditions are established) and relatively cheap. It should
also be noted that immunostaining, if properly controlled,
can detect modified histones and other proteins across the
entire genome, including repeat-rich regions that are inac-
cessible to sequencing-based approaches [4]. While micro-
scopy cannot match the ultimate resolving power of ChIP-
seq, it has the potential to provide a valuable complemen-
tary approach to epigenomic mapping.
Immunolabeling of metaphase chromosomes is a well
established technique and has revealed dramatic regional
differences in the distribution of specific histone modifi-
cations, particularly the distinctive pattern of modifica-
tions present on centric (constitutive) heterochromatin
in plants and animals [5-7] and the facultative hetero-
chromatin of the inactive X chromosome in female
mammals [8,9]. Immunolabeling of meiotic (pachytene)
chromosomes in maize has shown regional variation in
levels of various methylated histone isoforms, with dis-
tinctive differences between heterochromatin and
euchromatin [10].
Surprisingly, there has been only limited use of meta-
phase chromosome immunostaining to map histone
modifications across individual chromosomes [11,12],
and no systematic attempt to explore the genome-wide
distribution of multiple histone modifications.
Here we describe a systematic analysis of the distribu-
tion of selected histone modifications across metaphase
chromosomes from normal human cells. Antibodies to
histone modifications previously linked to active tran-
scription (H3K9ac, H3K27acandH3K4me3,described
collectively as active modifications) all highlight the
same 10- to 50-Mb genomic regions, giving a character-
istic and consistent banding pattern. Bands closely cor-
respond to regions rich in genes and CpG islands
(CGIs). In contrast, H3K27me3, a mark associated with
gene silencing, shows a preference for telomeric regions
and defines bands that only occasionally overlap with
gene rich regions. At 10-Mb resolution, active modifica-
tions have similar, though not identical, distributions
across interphase [13] and metaphase chromosomes,
while H3K27me3 is clearly different. The results suggest
that there is extensive remodeling of the epigenome as
cells enter mitosis, but that a high-level memory of
some components of the interphase epigenome is
retained into metaphase.
Results
Classification of unfixed metaphase chromosomes
Standard protocols for preparation and staining of meta-
phase chromosomes require fixation in acidified organic
solvents, a step that extracts the great majority of his-
tones and other proteins [14]. We have adopted an
approach using unfixed chromosomes [9,15,16], a proce-
dure that has the major advantage that histones remain
in their native (that is, unfixed, undenatured) form and
are therefore structurally compatible with the synthetic
peptides used to raise anti-histone antisera [17,18]. We
found that both the relative sizes and centromeric
indices (arm ratios) of unfixed chromosomes were very
similar to their counterparts fixed in methanol/acetic
acid (Additional files 1 and 2), allowing us to use these
properties as a first step in chromosome identification.
Unfixed chromosomes are not amenable to conventional
G-banding procedures. To distinguish morphologically
similar chromosomes, we used the chromosome-specific
banding patterns generated by the DNA counterstain
DAPI (4,6-diamino-2-phenyl-indole). DAPI selectively
stains regions that are AT-rich and GC-poor, and gives
a banding pattern that resembles G-banding and is
unique for each chromosome [17].
Modifications associated with transcriptionally active and
silent chromatin show distinctive, banded distributions
across metaphase chromosomes
Unfixed metaphase chromosome spreads from human
lymphoblastoid cells were immunostained with
antibodies to histone H3 tri-methylated at lysine 4
(H3K4me3), a modification that has been associated
with transcriptionally active, or potentially active, chro-
matin [18-21]. Centromeric heterochromatin was consis-
tently unstained, while the arms of most chromosomes
showed a characteristic pattern of brightly stained and
weakly stained regions (Figure 1a, b). Using a combina-
tion of size, centromeric index and reverse DAPI band-
ing (Figure 1c), we were able to identify all
chromosomes and construct karyotypes (Figure 1d, e).
There was consistently strong staining of both arms of
chromosome 19, weak staining of chromosome 13 and
distinctive banding of most chromosomes, with particu-
larly prominent bands on chromosomes 1, 6, 9, 11 and
12. The immunofluorescent banding pattern was consis-
tent between sister chromatids and homologues and
reproducible from one spread to another, despite the
inevitable differences in overall chromosome size. Align-
ments of chromosomes from five immunostained
spreads are shown in Additional file 3.
Very similar immunostaining patterns were given by
antisera to two other modifications also loosely asso-
ciated with transcriptionally active chromatin, namely
Terrenoire et al.Genome Biology 2010, 11:R110
http://genomebiology.com/2010/11/11/R110
Page 2 of 14
H3 acetylated at lysine 27 (H3K27ac) and H3 acetylated
at lysine 9 (H3K9ac) [22,23] (Figure 2a; Additional files
4 and 5). Conversely, staining with a variety of antisera
to acetylated H4 was more uniform. The acetylated H4
bands corresponded to those seen with antisera to
H3K4me3 but the differential labeling of bands and
interband regions was less extreme. A typical example is
shown in Figure 2c. H4K8ac is absent from both consti-
tutive (centric) and facultative heterochromatin and our
findings are generally consistent with previous studies
on acetylated H4 [10,13].
H3 tri-methylated at lysine 27 (H3K27me3) is put in
place by the methyltransferase Ezh2, a component of
the Polycomb silencing complex PRC2 and has been
(a
a)
(d)
(b)
1 2 3 4 5
6 7 8 9 10 11 12
13 14 15 16 17 18
19 20 21 22 X Y
(c)
(c
c)
(e)
1 2 3 4 5
6 7 8 9 10 11 12
13 14 15 16 17 18
19 20 21 22 X Y
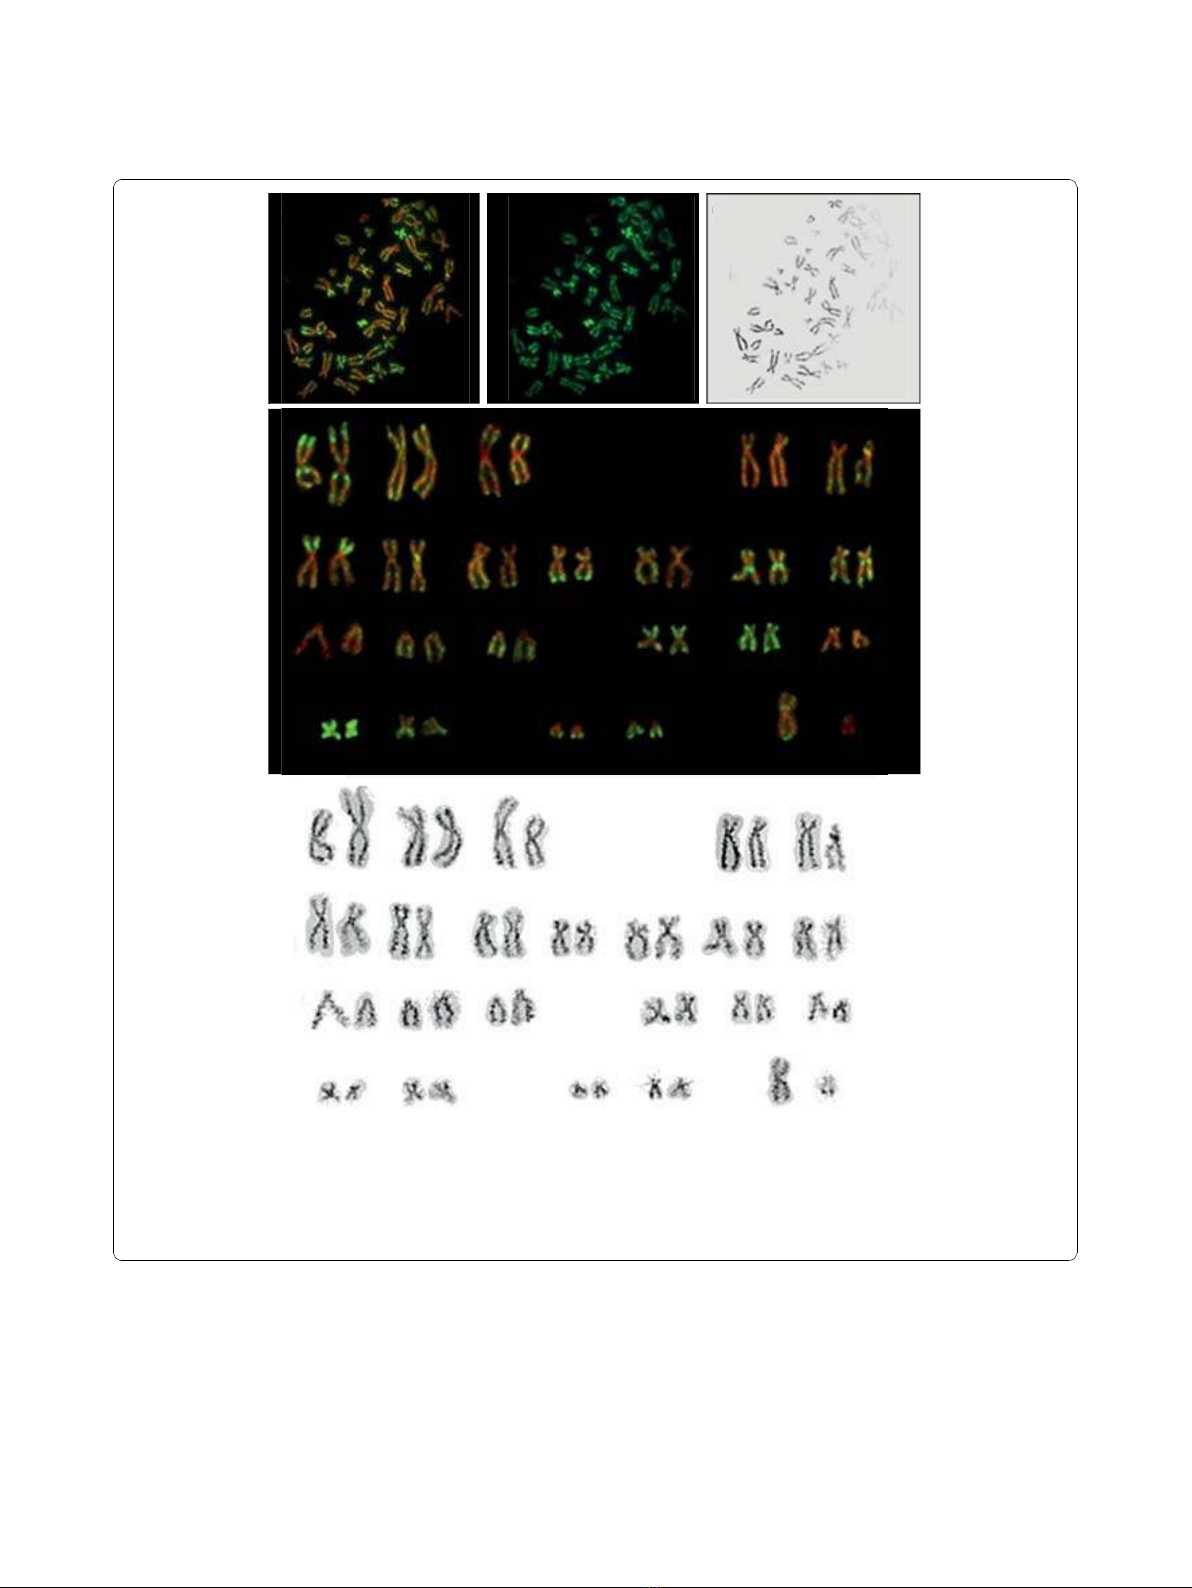
Figure 1 Distribution of H3K4me3 across human metaphase chromosomes.(a-c) Metaphase chromosome spreads from human
lymphoblastoid cells immunostained with antibodies to H3K4me3 (fluorescein isothiocyanate (FITC), green) and counterstained with DAPI
(pseudocolored red). Panel (a) shows both stains, panel (b) FITC only and panel (c) DAPI only, shown in black to resemble conventional G-
banding. (d) Immunostained karyotype constructed from the chromosome spread shown in (a-c). (e) Reverse DAPI (rDAPI) karyotype constructed
from the same spread.
Terrenoire et al.Genome Biology 2010, 11:R110
http://genomebiology.com/2010/11/11/R110
Page 3 of 14
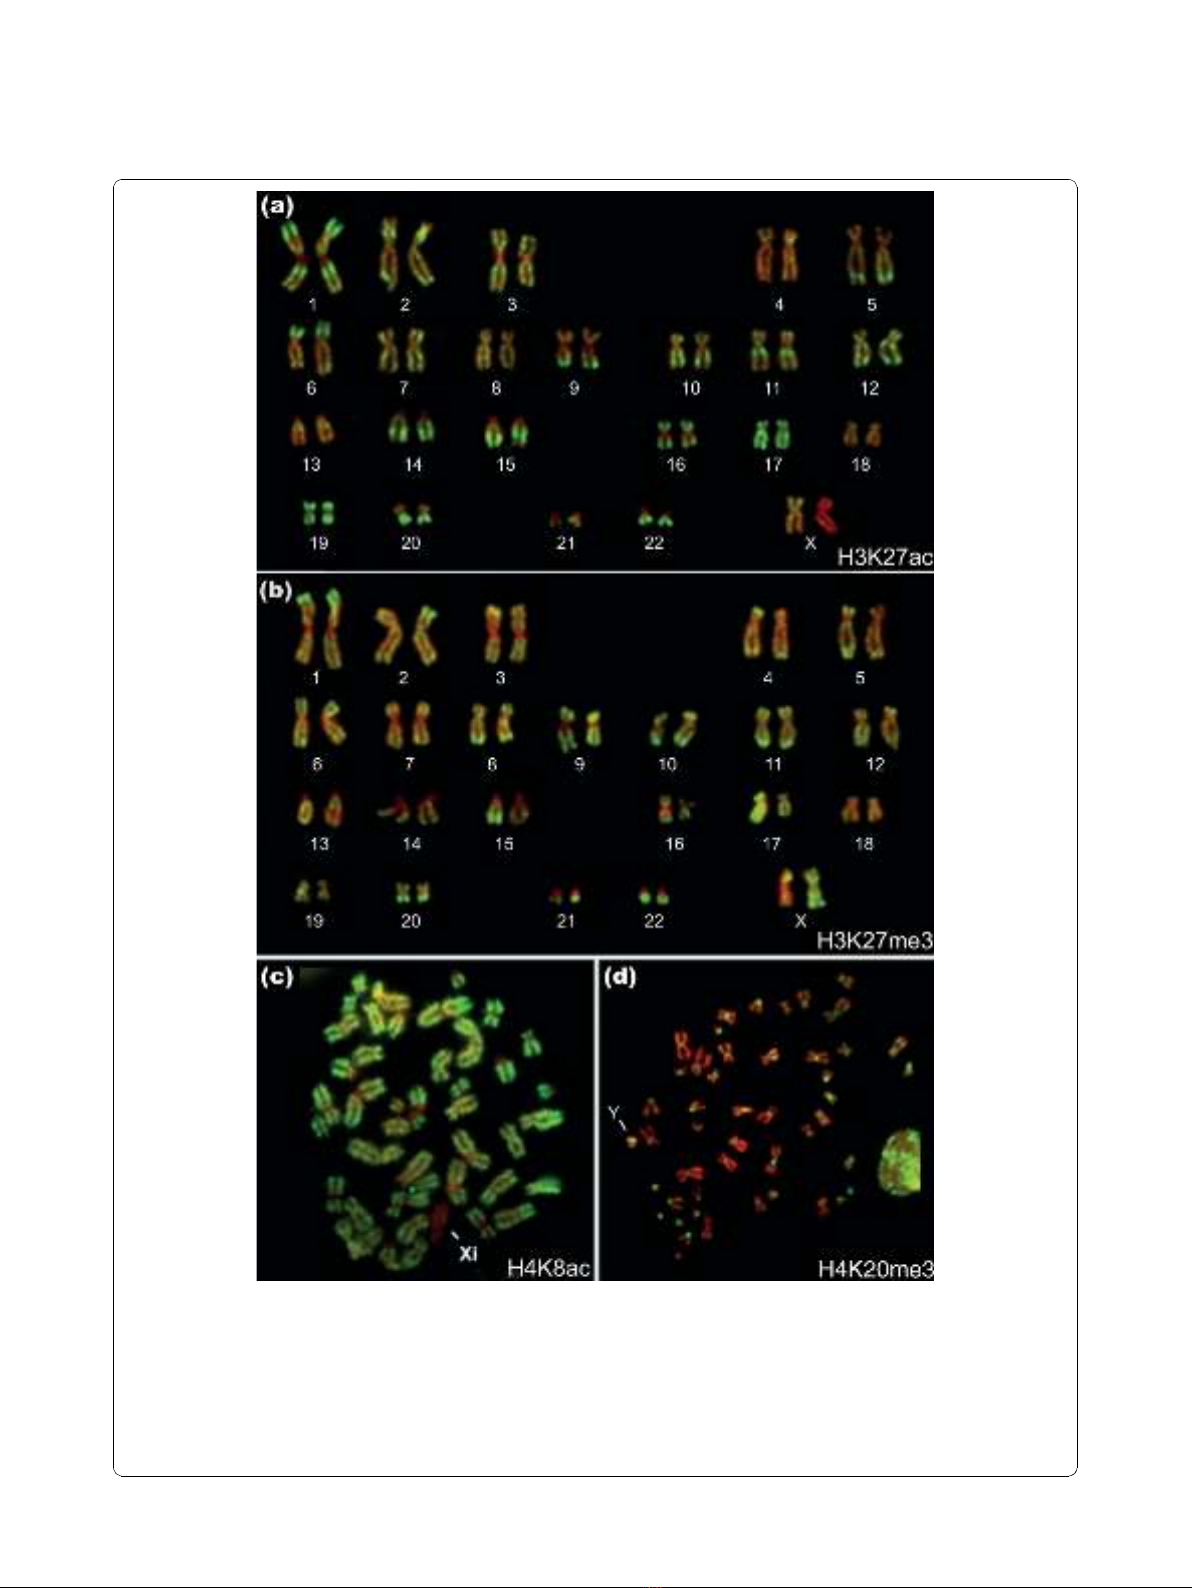
Figure 2 Immunolabeling of metaphase chromosomes from human lymphoblastoid cells with antisera to H3K27ac, H3K27me3,
H4K8ac and H4K20me3.(a) Immunostained karyotype from a metaphase chromosome spread immunostained with antibodies to H3K27ac
(fluorescein isothiocyanate (FITC), green) and counterstained with DAPI (pseudocolored red). (b) Immunostained karyotype from a metaphase
chromosome spread immunostained with antibodies to H3K27me3 (FITC, green) and counterstained with DAPI (pseudocolored red). (c)
Metaphase chromosome spread immunostained with antibodies to H4K8ac (FITC, green) and counterstained with DAPI (pseudocolored red).
Note the complete absence of FITC labeling at centric (constitutive) heterochromatin and the facultative heterochromatin of the inactive X (Xi).
(d) Metaphase chromosome spread immunostained with antibodies to H4K20me3 (FITC, green) and counterstained with DAPI (pseudocolored
red). Note the extensive, patchy staining of the interphase nucleus on the right. The arms of the Y chromosome (indicated) are labeled but its
centric heterochromatin is not.
Terrenoire et al.Genome Biology 2010, 11:R110
http://genomebiology.com/2010/11/11/R110
Page 4 of 14

associated with formation of facultative heterochromatin
and gene silencing [24-26]. In female cells, one of the
two X chromosomes generally stained more strongly
than its homologue, and more strongly than the single
X in male cells (Figure 2b; Additional file 6). The more
intensely stained X is likely to be the inactive homolo-
gue [27]. H3K27me3 was undetectable on blocks of con-
stitutive centric heterochromatin (Figure 2b; Additional
file 6) or on the Y heterochromatin in male cells (Addi-
tional file 7). There are distinctive regional variations in
H3K27me3 staining intensity along the chromosome
arms, but without the sharply defined banded distribu-
tion typical of H3K4me3 (Figure 1). We find only lim-
ited overlap between the two modifications. For
example, the short arm of chromosome 6 is relatively
enriched in both modifications, but on closer inspection
H3K27me3 has a more telomeric location (6pter-22.3)
than H3K4me3, which is centrally located in the short
arm (centered at 6p21), leaving the telomeric region
relatively weakly stained (compare the multiple exam-
ples of chromosome 6 in Additional files 3 and 6). Also,
the prominent H3K4me3 band on chromosome 11q just
below the centromere (11q12.1-13.3) is not enriched in
H3K27me3 (Figure 2b). Overall, we find that H3K27me3
is consistently enriched at telomeric regions, at least on
the larger chromosomes (chromosomes 1 to 15). This
distinctive staining pattern was seen with two different
antisera to H3K27me3 (listed in Additional file 8).
H3K27ac is a modification that may act as an antagonist
of Polycomb-mediated silencing through suppression of
H3K27 tri-methylation [4,24]. While the distribution
of H3K27ac (Figure 2a) is clearly different from that of
H3K27me3 (Figure 2b), H3K27me3 is not consistently
excluded from regions rich in H3K27ac, or vice versa.
Immunostaining with antibodies to H4 tri-methylated
at lysine 20 (H4K20me3) strongly and selectively labeled
the centric heterochromatin of metaphase chromosomes
from human lymphoblastoid cells (Figure 2d), consistent
with previous results in other cell types [6]. Absence of
staining of centric heterochromatin by antisera to the
other histone modifications tested here is clearly not
due to a general inaccessibility of histone epitopes in
heterochromatin. Chromosome arms were essentially
unstained by antibodies to H4K20me3, with the excep-
tion of the Y chromosome in male cells, on which het-
erochromatic regions on the distal long arm were
consistently stained (Figure 2d).
Immunofluorescent chromosome banding in primary
fibroblasts closely resembles that in lymphoblastoid cells
Over the course of the work presented here, complete
immunostained karyotypes for H3K4me3, H3K9ac,
H3K27ac and H3K27me3 have been constructed from
lymphoblastoid cell lines (LCLs) derived from two
different individuals, one male and one female. At the
present level of resolution, we have found no evidence
for individual differences in chromosome banding. The
same banding patterns have also been seen in occasional
preparations from two other LCLs (results not shown).
Analyses of other cell types have been less extensive,
but immunostaining of chromosomes from human pri-
mary fibroblasts with antibodies to H3K4me3 revealed a
banding pattern essentially the same as that seen in
LCLs (Additional file 9). The banding patterns described
are not restricted to a particular cell lineage. However,
differences may occur among more widely divergent, or
aberrant, cell types. Improved resolution of immuno-
fluorescent bands, perhaps through analysis of extended,
prophase chromosomes, may also reveal differences not
apparent with the present approach.
Modifications associated with active chromatin are
enriched in regions rich in genes and CpG islands
Recent analyses have confirmed that most genes are
clustered in a relatively small number of genomic
regions [28-30]. These gene-rich regions are also
enriched in CGIs, relatively CpG-rich DNA sequences
found at and around the promoter regions of many
genes and characterized by low levels of DNA methyla-
tion [31,32]. We constructed gene density/CGI maps for
each human chromosome by calculating the gene and
CGI content of 10-Mb windows across the chromo-
some. In Figure 3, the resulting histograms are aligned
with a representative example of each chromosome
immunostained for H3K4me3. There is a close and con-
sistent correspondence between high levels of H3K4me3
and regions of relatively high gene/CGI content. This is
true not only for regions of intense staining (for exam-
ple, landmark bands on chromosomes 1q, 6p and 11q)
but also for less strongly staining bands that do not
stand out in the original spreads (for example, the bands
distributed across chromosomes 3 and 12) (Figure 1;
Additional file 3). As expectedfromourearlierresults,
chromosomes immunostained with antibodies to
H3K9ac and H3K27ac showed essentially the same close
relationship between staining intensity and gene/CGI
density (results not shown). In contrast, on chromo-
somes immunostained for H3K27me3, there was only
limited overlap between gene/CGI-rich regions and
staining intensity (Additional file 7).
To allow a quantitative analysis of the relationship
between the distribution of histone modifications at meta-
phase and other chromosome properties, we measured the
level of H3K4me3 across chromosome 1 by scanning.
Typical scans of sister chromatids are shown in Figure 4a.
Fluorescence intensity is expressed as a percentage of the
most highly fluorescent element and distance along the
chromosome is expressed in megabases (chromosome 1 is
Terrenoire et al.Genome Biology 2010, 11:R110
http://genomebiology.com/2010/11/11/R110
Page 5 of 14


![PET/CT trong ung thư phổi: Báo cáo [Năm]](https://cdn.tailieu.vn/images/document/thumbnail/2024/20240705/sanhobien01/135x160/8121720150427.jpg)


