
Chapter 20
Income Inequality and Poverty
TRUE/FALSE
1. The poverty line is set by the government so that 10 percent of all families fall below that line and are thereby
classified as “poor.”
ANS: F DIF: 1 REF: 20-1
NAT: Analytic LOC: The study of economics, and definitions of economics
TOP: Poverty line MSC: Definitional
2. The United States has more income inequality than Japan, Germany, and Canada.
ANS: T DIF: 1 REF: 20-1
NAT: Analytic LOC: The study of economics, and definitions of economics
TOP: Income inequality MSC: Definitional
3. The United States has more income inequality than Brazil and South Africa.
ANS: F DIF: 1 REF: 20-1
NAT: Analytic LOC: The study of economics, and definitions of economics
TOP: Income inequality MSC: Definitional
4. Standard measurements of the degree of income inequality take both money income and in-kind transfers into
account.
ANS: F DIF: 2 REF: 20-1
NAT: Analytic LOC: The study of economics, and definitions of economics
TOP: In-kind transfers | Income inequality MSC: Definitional
5. John Rawls, who developed the way of thinking called liberalism, argued that government policies should be
aimed at maximizing the sum of utility of everyone in society.
ANS: F DIF: 2 REF: 20-2
NAT: Analytic LOC: The role of government TOP: Utility
MSC: Interpretive
6. One existing government program that works much like a negative income tax is the Earned Income Tax
Credit.
ANS: T DIF: 2 REF: 20-3
NAT: Analytic LOC: The role of government TOP: Negative income tax
MSC: Interpretive
7. One existing government program that works much like a negative income tax is Medicaid.
ANS: F DIF: 2 REF: 20-3
NAT: Analytic LOC: The role of government TOP: Negative income tax
MSC: Interpretive
8. The invisible hand of the marketplace acts to allocate resources efficiently, but it does not necessarily ensure
that resources are allocated fairly.
ANS: T DIF: 1 REF: 20-0
NAT: Analytic LOC: Efficiency and equity TOP: Income inequality
MSC: Applicative
9. When the government enacts policies to make the distribution of income more equitable, it distorts incentives,
alters behavior, and makes the allocation of resources less efficient.
ANS: T DIF: 1 REF: 20-0
NAT: Analytic LOC: The role of government TOP: Income inequality
MSC: Applicative
67

68 Chapter 20/Income Inequality and Poverty
10. In the United States in 2005, the bottom fifth of the income distribution had incomes below $19,250.
ANS: F DIF: 1 REF: 20-1
NAT: Analytic LOC: Efficiency and equity TOP: Income inequality
MSC: Applicative
11. The top 5 percent of U.S. annual family income in 2005 was $184,500 or more.
ANS: T DIF: 1 REF: 20-1
NAT: Analytic LOC: Efficiency and equity TOP: Income inequality
MSC: Applicative
12. A U.S. family earning $80,000 would be in the top 20 percent of income distribution in 2005.
ANS: F DIF: 1 REF: 20-1
NAT: Analytic LOC: Efficiency and equity TOP: Income inequality
MSC: Applicative
13. Free trade and economic growth have reduced poverty worldwide.
ANS: T DIF: 1 REF: 20-1
NAT: Analytic LOC: Efficiency and equity TOP: Poverty
MSC: Applicative
14. Although globalization has reduced income inequality, the number of people living in extreme poverty has
remained unchanged.
ANS: F DIF: 2 REF: 20-1
NAT: Analytic LOC: Efficiency and equity TOP: Poverty
MSC: Interpretive
15. The measured poverty rate may not reflect the true extent of economic deprivation because it does not include
some forms of government assistance.
ANS: T DIF: 1 REF: 20-1
NAT: Analytic LOC: Efficiency and equity TOP: Poverty rate
MSC: Applicative
16. The poverty line is an absolute standard and is based on the cost of providing an adequate diet.
ANS: T DIF: 1 REF: 20-1
NAT: Analytic LOC: Efficiency and equity TOP: Poverty line
MSC: Definitional
17. The poverty line is based on the percentage of people who cannot afford an adequate diet.
ANS: F DIF: 2 REF: 20-1
NAT: Analytic LOC: Efficiency and equity TOP: Poverty line
MSC: Interpretive
18. The poverty rate is a measure of people unable to meet the government’s poverty line.
ANS: T DIF: 2 REF: 20-1
NAT: Analytic LOC: Efficiency and equity TOP: Poverty line
MSC: Interpretive
19. The elderly represent the largest demographic group in poverty.
ANS: F DIF: 1 REF: 20-1
NAT: Analytic LOC: Efficiency and equity TOP: Poverty
MSC: Applicative
20. About half of black and Hispanic children in female-headed households live in poverty.
ANS: T DIF: 1 REF: 20-1
NAT: Analytic LOC: Efficiency and equity TOP: Poverty
MSC: Applicative

Chapter 20/Income Inequality and Poverty 69
21. The economic life cycle describes how young people usually have higher savings rates than middle-aged
people.
ANS: F DIF: 1 REF: 20-1
NAT: Analytic LOC: Efficiency and equity TOP: Economic life cycle
MSC: Applicative
22. Many economists believe that a family bases its spending decisions on its permanent, or average, income
rather than on transitory income.
ANS: T DIF: 1 REF: 20-1
NAT: Analytic LOC: Efficiency and equity TOP: Economic life cycle
MSC: Applicative
23. About four out of five millionaires in the United States earned their money rather than inherited it.
ANS: T DIF: 2 REF: 20-1
NAT: Analytic LOC: Efficiency and equity TOP: Economic mobility
MSC: Applicative
24. Fewer than three percent of families are poor for eight or more years.
ANS: T DIF: 1 REF: 20-1
NAT: Analytic LOC: Efficiency and equity TOP: Economic mobility
MSC: Applicative
25. Utilitarians believe that the proper goal of the government is to maximize the sum of the utilities of everyone
in society.
ANS: T DIF: 1 REF: 20-2
NAT: Analytic LOC: The role of government TOP: Utilitarianism
MSC: Interpretive
26. The utilitarian justification for redistributing income is based on the assumption of diminishing marginal
utility.
ANS: T DIF: 1 REF: 20-2
NAT: Analytic LOC: The role of government TOP: Utilitarianism
MSC: Interpretive
27. If a government could successfully achieve the maximin criterion, each member of society would have an
equal income.
ANS: F DIF: 2 REF: 20-2
NAT: Analytic LOC: The role of government TOP: Liberalism
MSC: Interpretive
28. According to libertarians, the government should redistribute income from rich individuals to poor individuals
to achieve a more equal distribution of income.
ANS: F DIF: 2 REF: 20-2
NAT: Analytic LOC: The role of government TOP: Libertarianism
MSC: Interpretive
29. Libertarians believe that the government should enforce individual rights to ensure that all people have the
same opportunities to use their talents to achieve success.
ANS: T DIF: 1 REF: 20-2
NAT: Analytic LOC: The role of government TOP: Libertarianism
MSC: Interpretive
30. The poverty rate is an absolute level of income set by the federal government for each family size below
which a family is deemed to be in poverty.
ANS: F DIF: 1 REF: 20-1
NAT: Analytic LOC: Efficiency and equity TOP: Poverty rate, Poverty line
MSC: Definitional

70 Chapter 20/Income Inequality and Poverty
31. An income distribution may not give an accurate picture of families’ standards of living because it does not
include in-kind transfers.
ANS: T DIF: 2 REF: 20-1
NAT: Analytic LOC: Efficiency and equity TOP: Income inequality
MSC: Interpretive
32. A goal of libertarians is to provide citizens with equal opportunities rather than to ensure equal outcomes.
ANS: T DIF: 2 REF: 20-2
NAT: Analytic LOC: Efficiency and equity TOP: Libertarianism
MSC: Interpretive
33. Temporary Assistance for Needy Families (TANF) is an example of a negative income tax program.
ANS: F DIF: 2 REF: 20-3
NAT: Analytic LOC: Efficiency and equity TOP: Welfare
MSC: Applicative
34. When poor families in developing countries experience an increase in family income, their children supply
fewer hours of labor.
ANS: T DIF: 2 REF: 20-3
NAT: Analytic LOC: Efficiency and equity TOP: Child labor
MSC: Applicative
35. Education is the most important factor explaining reductions in child labor in Vietnam.
ANS: F DIF: 2 REF: 20-3
NAT: Analytic LOC: Labor markets TOP: Child labor
MSC: Applicative
36. Internet access is the most important factor explaining reductions in child labor in Vietnam.
ANS: F DIF: 2 REF: 20-3
NAT: Analytic LOC: Labor markets TOP: Child labor
MSC: Applicative
37. Since 1959 the United States’ income distribution has become more equal.
ANS: F DIF: 2 REF: 20-1
NAT: Analytic LOC: Efficiency and equity TOP: Income inequality
MSC: Applicative
38. In 2005 the top fifth of income earners accounted for over 50% of all income received by United States’
families.
ANS: F DIF: 2 REF: 20-1
NAT: Analytic LOC: Efficiency and equity TOP: Income inequality
MSC: Applicative
39. In 2005 the top 5 percent of income earners accounted for over 50% of all income received by United States’
families.
ANS: F DIF: 2 REF: 20-1
NAT: Analytic LOC: Efficiency and equity TOP: Income inequality
MSC: Applicative
40. From 1935 to 2005 the share of total income earned by the bottom fifth of income earners rose and then fell.
ANS: T DIF: 2 REF: 20-1
NAT: Analytic LOC: Efficiency and equity TOP: Income inequality
MSC: Applicative
Chapter 20/Income Inequality and Poverty 71
SHORT ANSWER
1. Explain the relationship between labor earnings and the distribution of income.
ANS:
A person's earnings depend on the supply and demand for that person's labor, which in turn depends on natural
ability, human capital, compensating differentials, discrimination, and so on. Because labor earnings make up about
three-fourths of the total income in the U.S. economy, the factors that determine wages are also largely responsible
for determining how the economy's total income is distributed among the various members of society.
DIF: 1 REF: 20-0 TOP: Income inequality
MSC: Interpretive
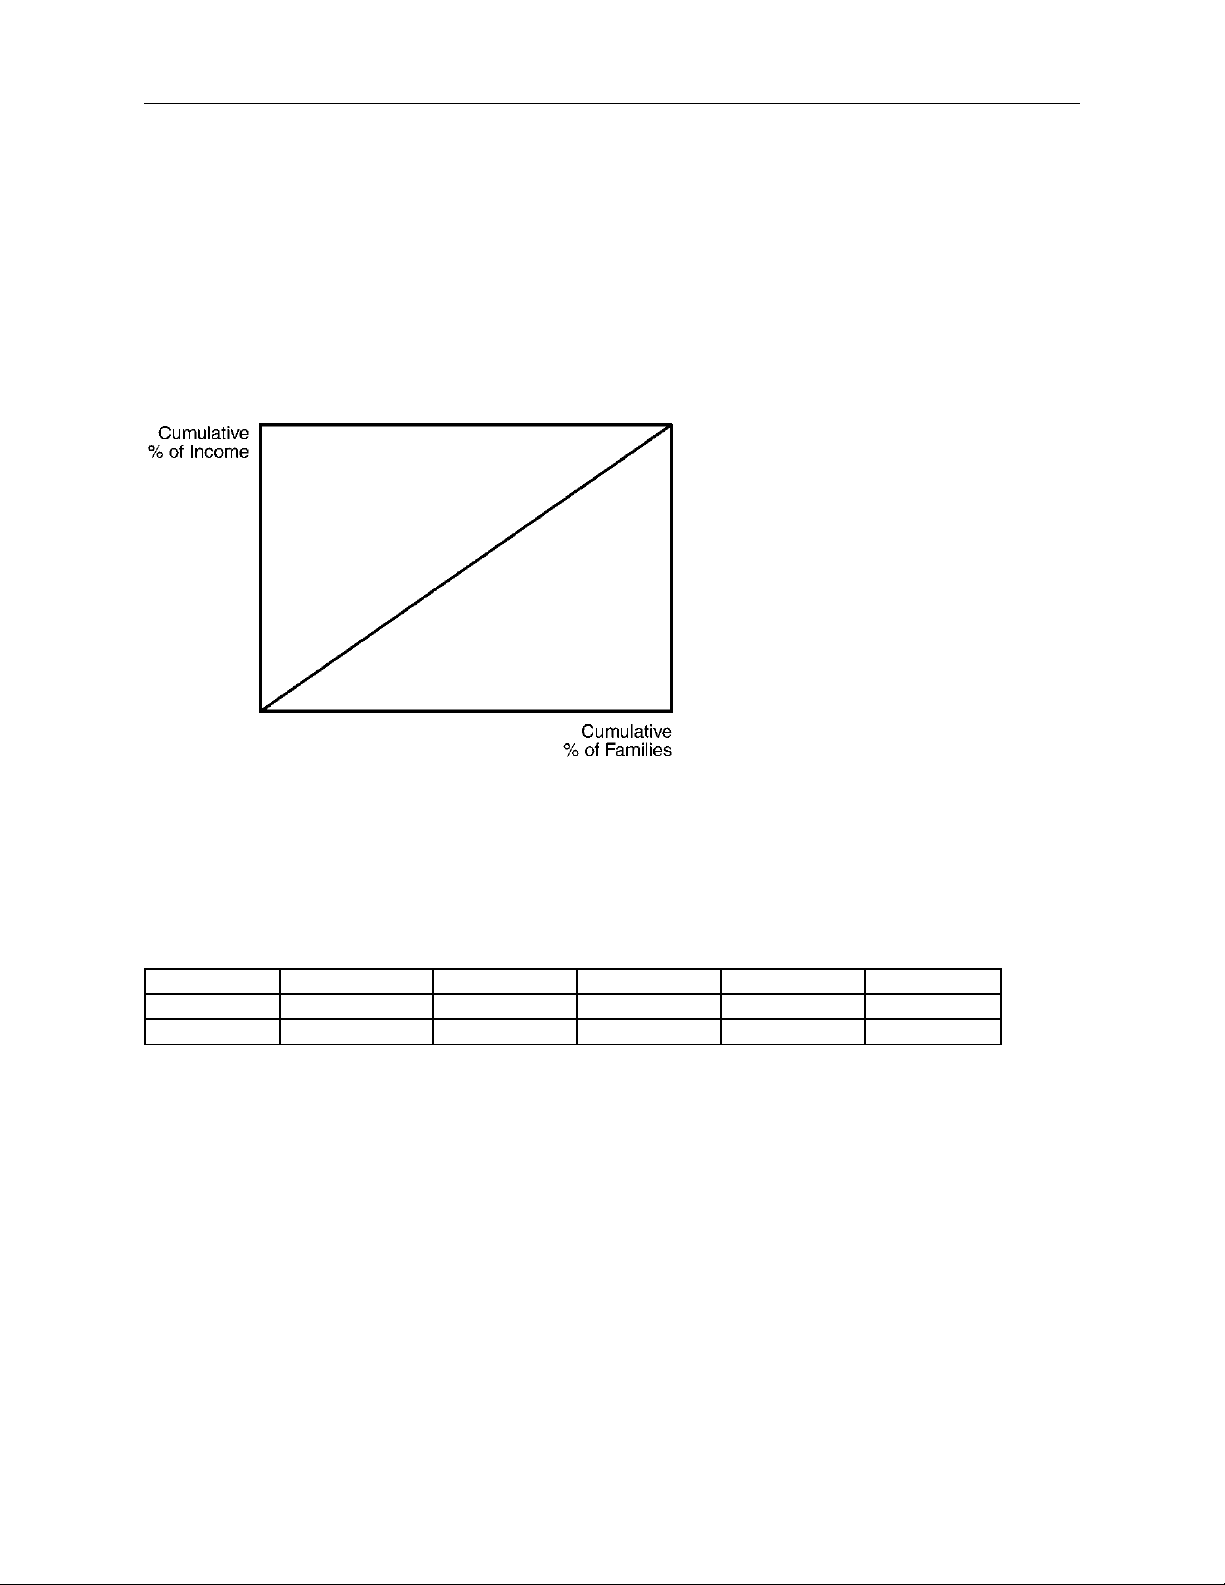
2. What is meant by a perfectly equal distribution of income? Use a graph to depict such a situation.
ANS:
If income were equally distributed across all families, each one-fifth of families would receive one-fifth of income.
That is, 20 percent of all families would receive 20 percent of all income, 60 percent of all families would receive 60
percent of all income, etc.
DIF: 2 REF: 20-1 TOP: Income inequality
MSC: Analytical
3. Given the table shown, which country has a more equal income distribution? Explain your answer.
Country Bottom Fifth Second Fifth Middle Fifth Fourth Fifth Top Fifth
Country A 9.0% 13.5% 17.5% 22.9% 37.1%
Country B 4.8% 10.5% 16.0% 23.5% 45.2%
ANS:
Country A has a more equal income distribution. If income were equally distributed across all families, each one-
fifth of families would receive one-fifth of income. Country A is closer to that situation than Country B.
DIF: 2 REF: 20-1 TOP: Income inequality
MSC: Interpretive
4. Explain what information is contained in the poverty rate statistic. Are there problems in using an absolute
scale to measure poverty? If so, explain them.
ANS:
The poverty rate is the percentage of the population whose family income falls below an absolute level called the
poverty line. The poverty line is set by the federal government at roughly three times the cost of providing an
adequate diet. There are several problems associated with measuring poverty using an absolute scale. For example,
the cost of living may differ across broad geographic regions. Families may be better off than their income level
indicates if they receive in-kind transfers. Finally, it is very difficult to measure a true "standard of living."
DIF: 2 REF: 20-1 TOP: Poverty rate | Poverty line
MSC: Analytical


![Tài liệu về Tiền Chủ Nghĩa Tư Bản và Kinh Tế Tiền Tư Bản [Mới Nhất]](https://cdn.tailieu.vn/images/document/thumbnail/2010/20101110/hoangkha04/135x160/tien_chu_nghia_tu_ban_va_kinh_te_tien_tu_ba1_2154.jpg)
![Giáo Trình Kinh Tế Vi Mô Kế Toán Doanh Nghiệp Cao Đẳng [Mới Nhất]](https://cdn.tailieu.vn/images/document/thumbnail/2026/20260526/alfredodistefano10/135x160/26731780297773.jpg)
![Giáo Trình Kinh Tế Vi Mô: Nắm Vững Nguyên Tắc Cơ Bản [A-Z]](https://cdn.tailieu.vn/images/document/thumbnail/2026/20260526/alfredodistefano10/135x160/23961780297774.jpg)


![Giáo trình Kinh tế lao động - TS. Trương Thị Tâm [chuẩn nhất]](https://cdn.tailieu.vn/images/document/thumbnail/2026/20260508/hoatrami2026/135x160/25661778559564.jpg)

![Tài liệu học tập Phân tích lao động xã hội - TS. Trần Thị Minh Phương [mới nhất]](https://cdn.tailieu.vn/images/document/thumbnail/2026/20260508/hoatrami2026/135x160/10581778638569.jpg)
![Đề cương ôn tập Khoa học quản lý [năm học] chi tiết, chuẩn nhất](https://cdn.tailieu.vn/images/document/thumbnail/2026/20260506/camtucau2026/135x160/62691778123105.jpg)


%20--%3e%3cdefs%3e%3cstyle%3e%20.st0%20{%20fill:%20%23fff;%20}%20.st1%20{%20fill:%20%237800fa;%20}%20%3c/style%3e%3c/defs%3e%3cpath%20class='st1'%20d='M117.78,12.18H43.11c2.9,3.47,4.65,7.94,4.65,12.82,0,5.6-2.3,10.66-6.01,14.29h76.02l7.22-13.56-7.22-13.56Z'/%3e%3cg%3e%3cpath%20class='st0'%20d='M53.58,26.17h-.59v-1.46h.59v-4.96h2.83c1.78,0,2.67.94,2.67,2.82v5.76c0,1.87-.89,2.81-2.67,2.81h-2.83v-4.96ZM55.36,21.37v3.34h1.1v1.46h-1.1v3.34h1.01c.61,0,.91-.37.91-1.1v-5.93c0-.74-.3-1.1-.91-1.1h-1.01Z'/%3e%3cpath%20class='st0'%20d='M65.99,31.14h-1.8l-.31-2.07h-2.19l-.31,2.07h-1.64l1.82-11.39h2.62l1.82,11.39ZM65.28,18.04c-.25.46-.51.77-.75.94-.21.15-.47.22-.79.22-.26,0-.57-.07-.92-.22l-.38-.15c-.14-.05-.26-.07-.37-.07-.3,0-.53.18-.71.54l-.91-.68c.25-.46.51-.77.75-.94.21-.14.48-.21.79-.21.26,0,.57.07.92.21l.38.15c.14.05.26.07.37.07.3,0,.53-.18.71-.54l.91.68ZM61.91,27.52h1.73l-.87-5.76-.87,5.76Z'/%3e%3cpath%20class='st0'%20d='M74.53,26.89v1.52c0,1.91-.89,2.86-2.67,2.86s-2.67-.95-2.67-2.86v-5.93c0-1.91.89-2.86,2.67-2.86s2.67.95,2.67,2.86v1.11h-1.69v-1.22c0-.75-.31-1.12-.93-1.12s-.93.37-.93,1.12v6.15c0,.74.31,1.11.93,1.11s.93-.37.93-1.11v-1.63h1.69Z'/%3e%3cpath%20class='st0'%20d='M81.4,31.14h-1.8l-.31-2.07h-2.19l-.31,2.07h-1.64l1.82-11.39h2.62l1.82,11.39ZM75.9,19.2l1.52-1.91h1.71l1.51,1.91h-1.61l-.76-.95-.75.95h-1.61ZM77.32,27.52h1.73l-.87-5.76-.87,5.76ZM83.1,15.99l-1.76,1.91h-1.26l1.17-1.91h1.86Z'/%3e%3cpath%20class='st0'%20d='M84.86,19.75c1.78,0,2.67.94,2.67,2.82v1.48c0,1.87-.89,2.81-2.67,2.81h-.85v4.28h-1.79v-11.39h2.64ZM84.01,21.37v3.86h.85c.58,0,.87-.36.87-1.08v-1.71c0-.71-.29-1.07-.87-1.07h-.85Z'/%3e%3cpath%20class='st0'%20d='M93.51,19.75c1.78,0,2.67.94,2.67,2.82v1.48c0,1.87-.89,2.81-2.67,2.81h-.85v4.28h-1.79v-11.39h2.64ZM92.66,21.37v3.86h.85c.58,0,.87-.36.87-1.08v-1.71c0-.71-.29-1.07-.87-1.07h-.85Z'/%3e%3cpath%20class='st0'%20d='M98.8,31.14h-1.79v-11.39h1.79v4.88h2.03v-4.88h1.83v11.39h-1.83v-4.88h-2.03v4.88Z'/%3e%3cpath%20class='st0'%20d='M105.36,24.55h2.46v1.62h-2.46v3.34h3.09v1.63h-4.88v-11.39h4.88v1.63h-3.09v3.18ZM108.17,17.29l-1.76,1.91h-1.26l1.17-1.91h1.86Z'/%3e%3cpath%20class='st0'%20d='M112.2,19.75c1.78,0,2.67.94,2.67,2.82v1.48c0,1.87-.89,2.81-2.67,2.81h-.85v4.28h-1.79v-11.39h2.64ZM111.35,21.37v3.86h.85c.58,0,.87-.36.87-1.08v-1.71c0-.71-.29-1.07-.87-1.07h-.85Z'/%3e%3c/g%3e%3ccircle%20class='st1'%20cx='25'%20cy='25'%20r='20'/%3e%3cpath%20class='st0'%20d='M32.78,19.27c2.92,0,4.43,2.55,5.28,5.33l.71,2.17c.14.38-.33.75-.71.75h-5.61c.19-.33.24-.71.09-1.08l-.75-2.45c-.43-1.32-.99-2.64-1.79-3.77.75-.57,1.65-.94,2.78-.94h0ZM25,18.38c3.25,0,4.9,2.78,5.89,5.89l.76,2.45c.14.42-.33.8-.8.8h-11.69c-.42,0-.94-.38-.8-.8l.75-2.45c.99-3.11,2.64-5.89,5.89-5.89h0ZM25,11.35c1.74,0,3.11,1.37,3.11,3.11s-1.37,3.11-3.11,3.11-3.11-1.41-3.11-3.11,1.41-3.11,3.11-3.11h0ZM17.27,19.27c1.08,0,1.98.38,2.73.94-.8,1.13-1.37,2.45-1.74,3.77l-.8,2.45c-.14.38-.05.75.09,1.08h-5.56c-.42,0-.9-.38-.75-.75l.71-2.17c.9-2.78,2.41-5.33,5.33-5.33h0ZM17.27,12.91c1.51,0,2.78,1.27,2.78,2.83s-1.27,2.83-2.78,2.83-2.83-1.27-2.83-2.83,1.27-2.83,2.83-2.83h0ZM32.78,12.91c1.56,0,2.78,1.27,2.78,2.83s-1.23,2.83-2.78,2.83-2.83-1.27-2.83-2.83,1.27-2.83,2.83-2.83h0ZM27.07,28.56v.09c0,.57-.24,1.08-.61,1.46h0v.05c-.38.33-.9.57-1.46.57s-1.08-.24-1.46-.61h0c-.38-.38-.61-.9-.61-1.46v-.09h1.41v.09c0,.19.05.38.19.47v.05c.09.09.28.19.47.19s.38-.09.47-.19v-.05c.14-.09.24-.28.24-.47t-.05-.09h1.41ZM30.99,28.56v.09c0,1.65-.66,3.16-1.74,4.24-1.08,1.08-2.59,1.79-4.24,1.79s-3.16-.71-4.24-1.79l-.05-.05c-1.04-1.08-1.7-2.55-1.7-4.2v-.09h1.41v.09c0,1.27.47,2.4,1.27,3.25h.05c.85.85,1.98,1.37,3.25,1.37s2.4-.52,3.25-1.37c.85-.8,1.37-1.98,1.37-3.25v-.09h1.37ZM34.99,28.56v.09c0,2.78-1.13,5.28-2.92,7.07-1.79,1.79-4.29,2.92-7.07,2.92s-5.23-1.13-7.07-2.92c-1.79-1.79-2.92-4.29-2.92-7.07v-.09h1.41v.09c0,2.4.94,4.53,2.5,6.08,1.56,1.56,3.72,2.5,6.08,2.5s4.52-.94,6.08-2.5c1.56-1.56,2.5-3.68,2.5-6.08v-.09h1.41Z'/%3e%3c/svg%3e)