
Open Access
Available online http://ccforum.com/content/11/1/R2
Page 1 of 8
(page number not for citation purposes)
Vol 11 No 1
Research
Incidence of low central venous oxygen saturation during
unplanned admissions in a multidisciplinary intensive care unit:
an observational study
Hendrik Bracht, Matthias Hänggi, Barbara Jeker, Ninja Wegmüller, Francesca Porta, David Tüller,
Jukka Takala and Stephan M Jakob
Department of Intensive Care Medicine, University Hospital Bern, University of Bern, Freiburgstrasse, CH-3010 Bern, Switzerland
Corresponding author: Stephan M Jakob, stephan.jakob@insel.ch
Received: 19 May 2006 Revisions requested: 17 Jul 2006 Revisions received: 16 Nov 2006 Accepted: 9 Jan 2007 Published: 9 Jan 2007
Critical Care 2007, 11:R2 (doi:10.1186/cc5144)
This article is online at: http://ccforum.com/content/11/1/R2
© 2007 Bracht et al.; licensee BioMed Central Ltd.
This is an open access article distributed under the terms of the Creative Commons Attribution License (http://creativecommons.org/licenses/by/2.0),
which permits unrestricted use, distribution, and reproduction in any medium, provided the original work is properly cited.
Abstract
Introduction It has been shown that early central venous oxygen
saturation (ScvO2)-guided optimization of hemodynamics can
improve outcome in septic patients. The early ScvO2 profile of
other patient groups is unknown. The aim of this study was to
characterize unplanned admissions in a multidisciplinary
intensive care unit (ICU) with respect to ScvO2 and outcome.
Methods Ninety-eight consecutive unplanned admissions to a
multidisciplinary ICU (median age 63 [range 19 to 83] years,
median Simplified Acute Physiology Score [SAPS II] 43 [range
11 to 92]) with a clinical indication for a central venous catheter
were included in the study. ScvO2 was assessed at ICU arrival
and six hours later but was not used to guide treatment. Length
of stay in ICU (LOSICU) and in hospital (LOShospital) and 28-day
mortality were recorded.
Results ScvO2 was 70% ± 12% (mean ± standard deviation)
at admission and 71% ± 10% six hours later (p = 0.484).
Overall 28-day mortality was 18%, LOSICU was 3 (1 to 28) days,
and LOShospital was 19 (1 to 28) days. Patients with an ScvO2 of
less than 60% at admission had higher mortality than patients
with an ScvO2 of more than 60% (29% versus 17%, p < 0.05).
Changes in ScvO2 during the first six hours were not predictive
of LOSICU, LOShospital, or mortality.
Conclusion Low ScvO2 in unplanned admissions and high
SAPS II are associated with increased mortality. Standard ICU
treatment increased ScvO2 in patients with a low admission
ScvO2, but the increase was not associated with LOSICU or
LOShospital.
Introduction
Tissue hypoperfusion contributes to the development of organ
dysfunction [1]. Consequently, tissue perfusion should be
monitored in patients at risk. Unfortunately, routinely monitored
variables, such as blood pressure, heart rate, urine output,
blood gases, or cardiac filling pressure, do not necessarily
reflect the adequacy of tissue perfusion [2]. Mixed venous oxy-
gen saturation (SvO2) and central venous oxygen saturation
(ScvO2) have been proposed as better indicators of adequacy
of oxygen supply. SvO2 can predict outcome in cardiovascular
surgery [3], severe cardiopulmonary disease [4], and septic
shock [5]. Controversies exist about whether ScvO2 can be
used as a surrogate for SvO2 [6,7]. Venous O2 saturation val-
ues differ among organ systems due to variable regional oxy-
gen extraction. It is therefore reasonable to conclude that the
absolute value of venous oxygen saturation depends on the
site of measurement [8]. Several conditions such as redistribu-
tion of blood flow (for example, in shock, severe head injury,
general anesthesia, and microcirculatory disorders) may affect
the relationship between ScvO2 and SvO2 [9,10]. Neverthe-
less, although ScvO2 reflects mainly the relationship between
oxygen supply and demand from head, neck, and upper
extremities only [8], it correlates reasonably well with concom-
itantly measured SvO2 values [6,11]. In high risk surgical
patients, low ScvO2 values are associated with increased
rates of perioperative complications, but not with mortality or
EGDT = early goal-directed therapy; FiO2 = inspired fractional oxygen concentration; ICU = intensive care unit; LOS = length of stay; LOSbefore ICU =
length of stay in hospital before intensive care unit admission; LOShospital = length of stay in hospital; LOSICU = length of stay in intensive care unit;
ROC = receiver operator characteristic; SAPS II = Simplified Acute Physiology Score; ScvO2 = central venous oxygen saturation; SvO2 = mixed
venous oxygen saturation.

Critical Care Vol 11 No 1 Bracht et al.
Page 2 of 8
(page number not for citation purposes)
length of hospital stay [12]. However, in the study of Pearse
and coworkers [12], observational data from a randomized,
controlled interventional trial were used. Although a carefully
defined treatment protocol was applied in their study and
goals for arterial oxygen saturation, hemoglobin, heart rate,
mean arterial pressure, serum lactate, and urine output were
the same in all patients, intravenous fluid administration was
guided by central venous pressure in one group of patients,
whereas in others fluid management was guided by stroke vol-
ume and supplemented with low-dose dopexamine. With such
a design, the predictive nature of ScvO2 may relate both to the
initial cardiovascular dysfunction and to subsequent attempts
to correct it.
In patients with severe sepsis or septic shock admitted to the
emergency department, ScvO2-guided hemodynamic optimi-
zation has been shown to reduce mortality [13]. Whether other
patient groups may also profit has not yet been determined.
Because central venous catheterization is frequently per-
formed in unplanned intensive care unit (ICU) admissions, rou-
tine screening for low ScvO2 could easily be performed, and
ScvO2-guided optimization, if proven beneficial, could be
established early during the ICU stay. The goal of this study
was to evaluate whether ScvO2 at admission and six6 hours
later is associated with outcome in patients requiring
unplanned admission to the ICU.
Materials and methods
This study was approved by the Ethics Committee of the Can-
ton of Bern, Switzerland, and deferred written informed con-
sent was obtained from patients where possible or from a
close relative. All unplanned admissions between October and
December 2004 were screened for inclusion and exclusion
criteria in a multidisciplinary 30-bed ICU.
The inclusion criterion was either the presence of or a clinical
indication for a central venous catheter. Exclusion criteria were
a contraindication for a central venous catheter and refusal of
blood products. The clinical indication for a central venous
catheter was determined by the attending physician, and
patients were enrolled in the study only if the first blood sample
from the central venous catheter was obtained within the first
two hours after ICU admission.
Protocol
All patients were treated according to standard practice for
the ICU. Protocols for hemodynamic treatment, weaning from
mechanical ventilation, sedation and analgesia, anticoagula-
tion, and management of blood glucose and potassium were
used in all patients where applicable. Whenever possible, a
central venous blood sample was obtained immediately after
ICU admission, or two hours afterward at the latest, for the
determination of oxygen saturation, blood gases, and hemo-
globin. Blood gas analyses were performed by intermittent
blood sampling and co-oximetry (ABL 725; Radiometer A/S,
Brønshøj, Denmark). For all blood gas analyses, the same
automated blood gas analyzer was used. PO2 (oxygen pres-
sure) was corrected for actual body temperature, and inspired
fractional oxygen concentration (FiO2) was recorded concom-
itantly. If an arterial catheter was in place, an arterial blood
sample was taken at the same time for the same analysis. Sam-
pling from both sites was repeated six hours later. Persons
involved in the treatment of the patients were blinded to the
results obtained from the central venous blood.
Data collection
For data analysis, the patients were divided into five groups
according to the main clinical problem that necessitated
admission to the ICU: sepsis (n = 26), cardiocirculatory dys-
function/failure (n = 12), respiratory dysfunction/failure (n =
14), central nervous system problems (hemorrhage, ischemia,
injury) (n = 29), and urgent surgery (n = 17). The 'urgent sur-
gery' group included urgent cardiovascular (n = 8), visceral (n
= 6), and orthopedic (n = 3) surgery. Due to the small number
of patients, the subgroups in 'urgent surgery' were not used for
further analysis. The following data were collected from all
patients: age, gender, Simplified Acute Physiology Score
(SAPS II), length of ICU and hospital stay up to day 28, 28-day
survival, and patient location after 28 days. Length of stay
(LOS) in hospital before ICU admission (LOSbefore ICU), in hos-
pital (LOShospital), and in ICU (LOSICU) were defined from the
patients' records. These data were acquired from the institu-
tion's own patient database. LOSbefore ICU was defined as the
time from the patient's arrival to the hospital until ICU admis-
sion. LOShospital was defined as the time from hospital admis-
sion to hospital discharge or 28 days, whichever was shorter.
LOSICU was defined as the time in the ICU during the study
period. The time a patient stayed in the ICU after a readmission
was not added to LOSICU. Three categories were applied for
the patient's location: dead, still in hospital after 28 days, or at
home/nursing facility. Eight patients were lost to follow-up;
consequently, their data could not be used for the assessment
of the relationship between ScvO2 and outcome.
Statistical analysis
All data were tested for normal distribution with the Kol-
mogorov-Smirnov test before further statistical analysis. If the
data were normally distributed, parametric tests were used;
otherwise, logarithmic or inverse transformation was per-
formed. If the transformation did not result in normal distribu-
tion, non-parametric tests were applied. Differences between
admission and six hours of ICU stay were assessed using Stu-
dent's paired t test (normally distributed data) and the Wil-
coxon signed rank test (otherwise). Differences between the
five predefined patient groups (sepsis, n = 26; cardiocircula-
tory dysfunction/failure, n = 12; respiratory dysfunction/failure,
n = 14; central nervous system problems, n = 29; and urgent
surgery, n = 17) were tested with one-way analysis of variance
(parametric data) or the Kruskal-Wallis test (otherwise).
Receiver operator characteristic (ROC) curves were

Available online http://ccforum.com/content/11/1/R2
Page 3 of 8
(page number not for citation purposes)
constructed to identify optimal cutoff values for the association
of admission ScvO2 and SAPS II, respectively, with 28-day
mortality. The optimal cutoff was defined as the value associ-
ated with the highest sum of sensitivity and specificity. In addi-
tion, univariate analysis was performed to test how 6-hour
ScvO2, SAPS II, and admission category were associated with
28-day mortality. Differences between patients with high and
low admission ScvO2 were tested using the t test for normally
distributed data; otherwise, the Mann-Whitney rank sum test
was used. Data on mortality and patient location at 28 days
were tested with Fisher's exact test. Data are presented as
mean ± standard deviation if normally distributed; otherwise,
data are presented as median and range. Statistical signifi-
cance was assumed at a p value of less than 0.05. Sigma Stat
version 3.1 (RockWare, Inc., Golden, CO, USA) was used for
statistical analysis.
Results
Demographic data
Of 349 screened patients, 99 were included in the study. One
initially included patient had to be excluded because of a miss-
ing ScvO2 value at baseline. Table 1 shows the demographic
data of all screened patients. Patients included in the study
had a higher SAPS II than patients who were screened but not
included (43 [11 to 92] versus 29 [6 to 84], p < 0.001). For
276 (79%) of the patients who were not included, the reason
for exclusion was absence of a central venous catheter within
the first two hours after ICU admission, in 38 patients (11%)
informed consent was not available, and in 35 patients (10%)
other reasons were present. Median (range) age of all included
patients was 63 (19 to 83) years, and median SAPS II was 43
(11 to 92) (Table 1). Twenty-nine (30%) of the included
patients had diseases of the central nervous system, 26 (27%)
had sepsis, 14 (14%) had respiratory failure, 12 (12%) had
circulatory failure, and 17 (17%) had undergone urgent sur-
gery. Septic patients had the highest number of organ failures
(Table 1). The 28-day mortality was 18% and there were no
significant differences between the patient groups. SAPS II
was higher in non-survivors than in survivors (70 [47 to 92]
versus 39 [11 to 87], p < 0.001). Median (range) LOSICU was
3 (1 to 28) days. There was a significant difference in LOSICU
in the different patient groups (p = 0.038). LOShospital up to day
28 was 19 (1 to 28) days, without differences between the
patient groups (Table 1). No difference was seen in LOSbefore
ICU in the different patient groups or in patients with an admis-
sion ScvO2 of less than or equal to 60% or more than 60%.
FiO2 was not different in patients with an ScvO2 of less than or
equal to 60% or more than 60% at admission (0.6 [0.3 to 1.0]
versus 0.5 [0.3 to 1.0], p = 0.378) and did not differ in the dif-
ferent patient groups (Table 1). Univariate analysis revealed a
significant association with 28-day mortality for SAPS II (p <
0.001).
ScvO2 in the whole collective and in different patient
groups
ScvO2 of the whole patient group was 70% ± 12% at ICU
admission and 71% ± 10% six hours later (p = 0.484; Table
1). There was no overall change in ScvO2 between baseline
and six hours in either the surviving or non-surviving group of
patients. However, there was a significant increase in ScvO2
at six hours in the overall group of patients with an ScvO2 value
of less than 60% at baseline (52% ± 5% to 63% ± 9%, p <
0.001). Significantly different ScvO2 values at ICU admission
Table 1
Demographic, ScvO2, and outcome data
All patients
(n = 98)
Cardiocirculatory failure
(n = 12)
Sepsis
(n = 26)
CNS disease
(n = 29)
Respiratory failure
(n = 14)
Other
(n = 17)
Median age in yearsa63 (19–83) 69 (39–79) 65 (35–83) 51 (19–79) 73 (32–83) 70 (28–83)
SAPS II 43 (11–92) 43 (32–89) 45 (11–87) 50 (11–92) 35 (19–86) 34 (13–58)
ScvO2 at ICU admission (%)a70 ± 12 60 ± 13 68 ± 12 77 ± 12 64 ± 11 73 ± 9
ScvO2 after six hours in ICU (%)a71 ± 10 67 ± 9 67 ± 10 79 ± 7 68 ± 10 68 ± 6
LOSICU in daysa3 (1–28) 3 (1–9) 4 (1–25) 3 (1–28) 6 (1–28) 1 (1–10)
LOShospital in days 19 (1–28) 13 (1–28) 28 (1–28) 12 (1–28) 22 (7–28) 18 (5–28)
LOSbefore ICU in days 0.3 (0–38) 0.1 (0–20) 0.8 (0–39) 0.1 (0–20) 2.4 (0–26) 0.5 (0–15)
28-day mortality (%) 18 33 27 24 7 0
FiO2 at ICU admission 0.6 (0.3–1.0) 0.7 (0.4–1.0) 0.5 (0.3–1.0) 0.5 (0.3–1.0) 0.8 (0.4–1.0) 0.5 (0.4–0.7)
Number of organ failures 2 (0–4) 2 (1–4) 3 (0–4)a1 (0–3) 2 (0–4) 2 (0–4)
Percentage of patients per group with low (< 60%)
ScvO2 on ICU admission
21 17 35 3 21 6
aKruskal-Wallis analysis for variance on ranks, p < 0.05. Values are expressed as mean ± standard deviation or as median (range). CNS, central
nervous system; FiO2, inspired fractional oxygen concentration; ICU, intensive care unit; LOSbefore ICU, length of stay in hospital before intensive
care unit admission; LOShospital, length of stay in hospital; LOSICU, length of stay in intensive care unit; SAPS II, Simplified Acute Physiology Score;
ScvO2, central venous oxygen saturation.

Critical Care Vol 11 No 1 Bracht et al.
Page 4 of 8
(page number not for citation purposes)
were observed in the different patient groups (p < 0.001), with
the CNS disease group showing the highest mean values
(77% ± 12%) and patients with cardiocirculatory failure the
lowest mean values (60% ± 13%). Mortality appeared to be
highest in the patient group with cardiocirculatory failure, fol-
lowed by patients with sepsis and patients with diseases of
the central nervous system, but without any significant differ-
ences between the patient groups (Table 1).
Systemic hemodynamics in the whole collective and in
different patient groups
Table 2 shows the systemic hemodynamic data of the whole
collective and of the different patient groups. Mean arterial
pressure decreased significantly after six hours of ICU stay in
the whole collective. All other recorded parameters in the
whole collective and in the patient groups remained largely
unchanged.
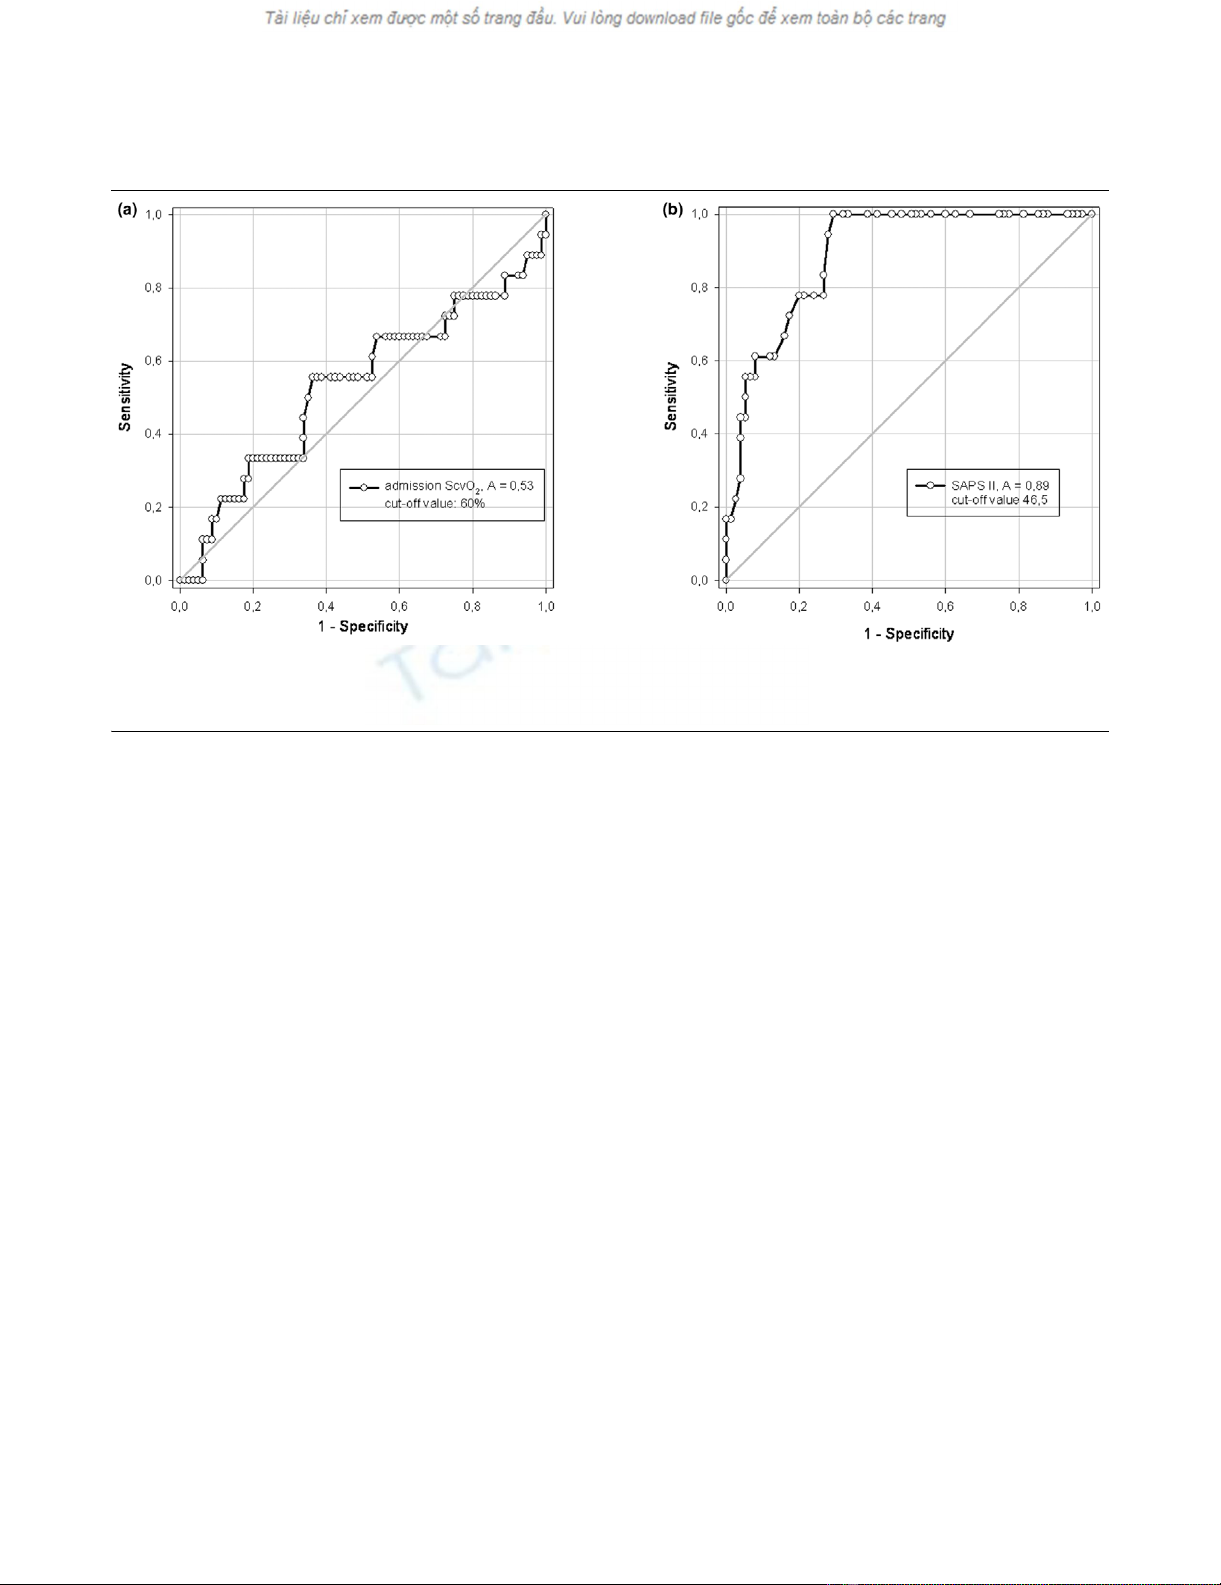
ROC curve analysis
The whole patient collective was divided into two groups by
calculating the optimal cutoff value for admission ScvO2 with
respect to 28-day mortality using ROC curve analysis. ROC
curve analysis revealed two nearly identical optimal cutoff val-
ues for association of ScvO2 with 28-day mortality (Figure 1a)
(ScvO2 of 60%: sum of sensitivity and specificity 1.13, and
ScvO2 of 69%: sum of sensitivity and specificity 1.15). In
patients with an ScvO2 of less than or equal to 60% at ICU
admission, 28-day mortality was higher than in patients with an
ICU admission ScvO2 of more than 60% (29% versus 17%, p
< 0.05). In contrast, an ScvO2 cutoff value of 69% did not
reveal a significant difference in mortality between the groups
(21% versus 17%, p = 0.701). Accordingly, a cutoff value of
60% was used for further analysis. Those patients in whom the
ScvO2 value was less than or equal to 60% were defined as
patients with a 'low' ScvO2, and those with an ScvO2 of more
than 60% were defined as patients with a 'high' ScvO2. For
other parameters, ROC curve analysis revealed a difference in
mortality only in SAPS II (Figure 1b). The highest sum of
specificity and sensitivity was 1.17 at a SAPS II of 46, with a
mortality of 38% versus 0%, p < 0.001.
Low/high ScvO2 and mortality and LOS
Figure 2a,b shows ScvO2 at admission and after six hours for
the whole collective and for the patient groups with respect to
low and high ScvO2 values at ICU admission. In patients with
a low admission ScvO2, ScvO2 increased after six hours of
ICU stay (52% ± 5% versus 63% ± 9%, p < 0.001), whereas
no increase was seen in patients with a high admission ScvO2
(Figure 2a,b).
LOShospital up to 28 days was not different in patients with low
versus high admission ScvO2 (18 ± 11 days versus 19 ± 16
days, p = 0.971) and did not differ between patient groups
(Table 1). Exclusion of non-survivors from LOS analysis did not
result in different LOShospital between patients with low (28 [8
to 28] days) and high (21 [1–28] days, p = 0.120) ScvO2.
Similarly, LOSICU was not different between the two groups (4
[1 to 19] days versus 3 [1 to 28] days, p = 0.767).
Outcome
Figure 3 shows patient location after 28 days. Eight patients
were lost to follow-up and had to be excluded from outcome
analysis. No significant differences were seen either in the
whole collective or in the different patient groups.
Discussion
The main finding of this study was that low ScvO2 at admission
was associated with increased risk of mortality in an unse-
lected group of unplanned ICU admissions. The use of ScvO2
as a hemodynamic goal is increasingly popular but has not yet
been fully evaluated. Only one study has attempted to answer
this question in a prospective, interventional manner [13].
Observational studies have described changes in ScvO2 in
different patient groups. In particular, the prognostic signifi-
Table 2
Hemodynamic data from the whole collective and the different patient groups
Systolic blood pressure
(mm Hg)
Mean arterial blood
pressure
(mm Hg)
Heart rate
(beats per minute)
Peripheral oxygen saturation
(%)
Axillary temperature
(°C)
n0 hours 6 hours 0 hours 6 hours 0 hours 6 hours 0 hours 6 hours 0 hours 6 hours
All patients 98 120 ± 30 113 ± 23 81 ± 19 76 ± 14a92 ± 24 89 ± 20 97 (56–100) 96 (87–100) 36.8 (33.4–39.1) 37.2 (34.0–39.5)
Cardiocirculatory
failure
12 95 ± 23 100 ± 18 70 ± 16b68 ± 9 97 ± 24 87 ± 15 94 (76–100) 98 (91–100)c35.9 (35.3–37.3) 37.0 (36.4–39.0)
Sepsis 26 114 ± 30 106 ± 20 77 ± 20 71 ± 11 99 ± 27 94 ± 25 96 (56–100) 97 (87–100) 36.9 (35.3–39.1) 37.3 (36.0–39.5)
CNS disease 29 139 ± 27b124 ± 27a,b 90 ± 18 83 ± 17b84 ± 20 88 ± 18 100 (87–100) 98 (90–100) 36.7 (33.4–39.1) 37.4 (35.6–39.4)c
Respiratory
failure
14 113 ± 29 116 ± 23 76 ± 17 78 ± 15 99 ± 26 92 ± 25 93 (87–100)b94 (88–99)b36.7 (35.5–37.8) 37.5 (35.9–38.6)c
Other 17 119 ± 23 111 ± 18 81 ± 17 75 ± 8 85 ± 17 84 ± 12 99 (88–100) 96 (90–100) 36.2 (34.2–38.1) 37.2 (34.0–38.2)
aPaired t test, p < 0.05; bKruskal-Wallis analysis for variance on ranks, p < 0.05; cWilcoxon signed rank test, p < 0.05. Values are expressed as
mean ± standard deviation or as median (range). CNS, central nervous system.
Available online http://ccforum.com/content/11/1/R2
Page 5 of 8
(page number not for citation purposes)
cance of a decrease in ScvO2 to less than 65% has been
demonstrated in trauma [14], severe sepsis [5,15,16], myo-
cardial infarction [15,17], and cardiac failure [18]. The prob-
lems with much of the available observational data are that
they are derived mostly from small studies with homogenous
patient populations and that these studies did not show an
association with outcome parameters such as number of com-
plications, LOS, and/or mortality. In contrast, our study repre-
sents a heterogeneous population of a multidisciplinary ICU.
Furthermore, we investigated ScvO2, not SvO2. ScvO2 can be
measured easily in patients with a central venous line in place,
whereas SvO2 requires a pulmonary artery catheter. A recent
study by Varpula and colleagues [7] showed that SvO2 cannot
be estimated by ScvO2 in patients with septic shock, whereas
others showed a close correlation between these parameters
[6]. It is noteworthy that ScvO2 and not SvO2 was imple-
mented in the guidelines of the Surviving Sepsis Campaign.
Finally, we have focused on the very early trend in ScvO2 in
unplanned ICU admissions. In contrast, the study by Krafft and
colleagues [5] focused on transient drops in SvO2.
ROC analysis for admission ScvO2 identified two nearly iden-
tical cutoff values for outcome prediction – 60% and 69% –
but only the 60% value was significant. This significance was
mainly the result of the high specificity (> 80%); that is, the
number of survivors with an admission ScvO2 of more than
60% was higher than would have been expected from the
overall mortality in this population. In contrast, the sensitivity
was rather low (33%). With the cutoff value of 69%, both sen-
sitivity and specificity moved closer to 50%. Recently, Pearse
and colleagues [12] found that a similar ScvO2 cutoff value
(65%) was predictive of postoperative complications but not
of mortality and LOS in patients undergoing major surgery.
Such cutoff values are useful in demonstrating an association
between low ScvO2 and outcome. In contrast, using any value
of a single physiologic variable as a therapeutic target is
clearly simplistic and not supported by the present study.
Data on the outcome of critically ill patients with low ScvO2 are
rare [19], and so far, no study has demonstrated that ScvO2-
guided treatment can reduce mortality in ICU patients,
although LOS has been decreased in cardiac surgery patients
using SvO2 as a parameter for increasing systemic oxygen
supply [3]. In our study, ScvO2 was not included as a target
parameter for hemodynamic management. The rationale for
evaluating ScvO2 as a goal in the resuscitation of unplanned
ICU admissions is the fact that ScvO2 represents the 'oxygen
supply reserve' of the region from which the blood is drained.
If the central venous line is located in the superior vena cava
(as in the present study), this region is head, neck, and upper
extremities. Although significant differences between SvO2
and ScvO2 must be assumed [7], changes in these two
parameters seem to occur in parallel [6,11].
Previous studies have suggested that cardiac output is asso-
ciated with outcome in critically ill patients [20,21]. In our
patients, cardiac output data – when measured at all – were
not collected. If cardiac function was assessed in the very
early phase of ICU admission, it was done by echocardiogra-
phy and rather qualitatively than quantitatively.
Figure 1
Receiver operator characteristic (ROC) analysis of central venous oxygen saturation (ScvO2) and Simplified Acute Physiology Score (SAPS II)Receiver operator characteristic (ROC) analysis of central venous oxygen saturation (ScvO2) and Simplified Acute Physiology Score (SAPS II). Out-
come parameter for ROC curves of (a) ScvO2 and (b) SAPS II was 28-day mortality. Area under the curve (A) values were 0.53 for ScvO2 and 0.89
for SAPS II.


![Báo cáo seminar chuyên ngành Công nghệ hóa học và thực phẩm [Mới nhất]](https://cdn.tailieu.vn/images/document/thumbnail/2025/20250711/hienkelvinzoi@gmail.com/135x160/47051752458701.jpg)


