
185
HNUE JOURNAL OF SCIENCE
Natural Sciences 2024, Volume 69, Issue 3, pp. 185-195
This paper is available online at http://hnuejs.edu.vn/ns
DOI: 10.18173/2354-1059.2024-0048
METEOROLOGICAL DROUGHT DEVELOPMENTS IN THAI BINH
PROVINCE IN THE CONTEXT OF CLIMATE CHANGE
Nguyen Thi Thu Hien* and Vu Thi Hang
Geography Faculty, Hanoi National University of Education, Hanoi city, Vietnam
*Corresponding author: Nguyen Thi Thu Hien, e-mail: hienntt@hnue.edu.vn
Received September 17, 2024. Revised October 16, 2024. Accepted October 30, 2024.
Abstract. This article presents the frequency and trends of meteorological drought
in Thai Binh province for the period 1991-2021 and forecasts drought trends for the
period 2025-2065 based on climate change scenarios. The PED drought index is
calculated using the corresponding daily temperature and rainfall data for each of
these periods. The results indicate that meteorological drought in Thai Binh can
occur in both the dry and rainy seasons. During the period from 1991 to 2021,
medium drought occurred in the dry season nearly once every ten years. Drought
occurrences in both the rainy and dry seasons show an increasing trend in intensity
and the number of drought months. In the future, during the period from 2025 to
2065, dry season drought will fluctuate less under the RCP4.5 scenario but will
sharply increase in frequency and intensity under the RCP8.5 scenario. In the rainy
season, drought is projected to increase in both scenarios. The number of drought
months is relatively high and will rise significantly in both RCP4.5 and RCP8.5
scenarios. A notable aspect of this study is the analysis of meteorological drought
trends for the period 2025-2065, based on climate change scenarios.
Keywords: meteorological drought, PED drought index, Thai Binh, trend.
1. Introduction
Drought is a common natural hazard that significantly affects the natural
environment, economic activities, and the social lives of people worldwide. Drought is
classified into four types: meteorological drought, agricultural drought, hydrological
drought, and socio-economic drought [1]. Meteorological drought specifically refers to a
deficit in rainfall at a given time compared to the average rainfall over a specified period.
Meteorological drought is a natural phenomenon that is primarily driven by climatic
factors and is influenced by changes associated with climate change, including
fluctuations in sea surface temperatures, such as those experienced during El Niño events.
Research on drought has been conducted for many years. Recently, in the context of
climate change characterized by rising temperatures and more extreme precipitation

186
regimes, drought has garnered significant attention as one of the most relevant natural
disasters [2]. The article by Jonathan S. & et al. presents maps of global drought
frequency, duration, and severity for the periods 1951-1970, 1971-1990, and 1991-2010,
to give an overview of the respective drought hot spots. The results showed that the
increase in drought frequency, duration, and severity is found to be significant in Africa,
Eastern Asia, the Mediterranean region, and Southern Australia, while the Americas and
Russia see a decrease in each drought component [2]. The World Bank showed the
intricate relationship between climate change and drought, emphasizing its global
implications. The research examines how rising temperatures and altered hydrological
cycles contribute to prolonged drought periods, particularly in vulnerable regions [3]. The
report “Global warming and drought impacts in the EU” of the European Union showed
that with global warming, droughts will happen more frequently, last longer, and become
more intense in southern and western parts of Europe, while drought conditions will
become less extreme in northern and north-eastern Europe. With 3 °C global warming in
2100 drought losses could be 5 times higher compared to today, with the strongest
increase in drought losses projected in the Mediterranean and Atlantic regions of Europe [4].
Vietnam is one of the five countries most severely affected by natural hazards each
year, including drought. Climate change, characterized by rising temperatures and
alterations in rainfall patterns, has led to an increase in the frequency and complexity of
droughts in our country. According to Dao N.H. & et al., in the context of climate change,
drought often happens, seriously affecting the local economy. This research developed a
drought scenario for the future based on the results of climate change scenarios RCP4.5
and RCP8.5. The result showed over time, from 1996 to 2015 (20 years), on an annual
average, the entire study area was not affected by drought. However, whether under the
medium-low emission scenario or the high emission scenario, the drought level will
increase over time from a slight to a high level [5]. In the study “Establishing drought
maps in the Mekong Delta in the context of climate change”, Tran VT & et al. assessed
the current status of meteorological droughts and assessed the impacts of climate change
on meteorological drought in the Mekong Delta, Vietnam based on Scenarios A2 and B2.
Results of the SPI calculation for the period of 2015-2047 compared with those for the
1980-2012 period varied in space and timing frequency. It was also found that drought
frequency would not increase, but drought severity levels (severe, moderate, mild) would
change [6]. Dang Q.K. & et al. showed that the frequency of occurrence from mild to
severe drought accounts for 57.1% to 92.9% in the dry season depending on each station
in Ninh Thuan and Binh Thuan provinces from 1993 to 2020. The calculated results based
on climate change scenarios showed that the duration of drought in the two provinces
would not change much; however, the degree of drought tends to increase in intensity and
frequency [7]. In the ref. [8] the characteristics and trends of drought in the Central
Highlands were assessed using SPI and PDSI indexes. The results suggest that drought
occurs with high frequency in both the dry and rainy seasons. The duration of drought
tends to increase at certain stations, such as Dak Nong, Ayunpa, Pleiku, and Dak To,
while it decreases at other stations [8].
Thai Binh is a coastal plain province located in the Red River Delta, covering an area
of 1,584.61 km², of which agricultural land constitutes 67.11% [9]. The population of

Meteorological drought developments in Thai Binh province in the context…
187
Thai Binh province is 1,873,890, with 88.25% residing in rural areas. Additionally, 28.5%
of the labor force is employed in agriculture, forestry, and fisheries [9]. Agricultural
production in this region largely depends on natural conditions, making it vulnerable to
significant losses from natural hazards, including drought. In the context of complex
climate change, drought poses a substantial threat to the stability of the agricultural sector,
which is crucial for local socio-economic development. Therefore, analyzing the
developments and trends of meteorological drought in Thai Binh province over the past
and the upcoming decades holds both scientific and practical significance.
Recently the issue of drought in Thai Binh Province has primarily been mentioned in
studies on drought in the Northern Delta region. Le T.H. & et al. present a set of maps on
the frequency of occurrence of heat waves and drought phenomena in the Red River for
the period 1971-2015 [10]. Research by Nguyen V.T & et al. utilized the SWSI index to
assess hydrological drought in the Red River Delta [11]. Ho V.C. & et al. used
hydrological indices including the flow deficit (Kth) index and the surface water supply
index (SWSI) to assess the hydrological drought situation in the Red-Thai Binh River
Delta [12]. Thus, it is evident that there has not been a dedicated study on meteorological
drought specifically for Thai Binh Province. A novel aspect of this study is the calculation
and analysis of the frequency and trends of meteorological drought in Thai Binh from
2025 to 2065, based on climate change scenarios RCP4.5 and RCP8.5 built in 2020 by
Vietnam of the Ministry of Natural Resources and Environment.
2. Content
2.1. Data and method
2.1.1. Data
This study was conducted based on several layers of data including:
- Daily temperatures and rainfall data for the 31 years (from 1991 to 2021) at Thai
Bình station. These data are collected and updated from the Meteorological and
Hydrological Data Center.
- Daily temperatures and rainfall data from 2025 to 2065 at Thai Bình station. The
data come from the climate scenarios built in 2020 by the Ministry of Natural Resources
and Environment.
2.1.2. Method
* Calculating meteorological drought method
In this article, the PED index was chosen as the basis for computing
meteorological drought. The formula is calculated as follows [13]:
TP
TP
PED
=−
where
ΔT and ΔP represent the deviations of temperature and precipitation at a specific time
from the average temperature and precipitation over the entire period.
𝜎𝑇 and 𝜎𝑃 denote the standard deviations of temperature and precipitation during the
calculation period.
188
Classification of drought according to the PED index is given in Table 1.
Table 1. Classification of drought according to the PED index [13]
No.
PED Values
Degree of drought
1
<0
Humidity
2
0 – 0.5
Normal
3
0.5 – 1
Start drought
4
1 – 1.5
Slightly drought
5
1.5 – 2
Medium drought
6
2 – 2.5
Quite a high drought
7
2.5 – 3
High drought
8
>3
Severe drought
Drought will occur when the temperature increases, and precipitation falls sharply.
The advantage of this method is its simplicity in calculation, requiring only temperature
and precipitation data. These values are derived from climate change scenarios.
* Linear regression method
The changes and trends in meteorological drought are expressed through a linear
regression equation:
()y t at b=+
The increasing or decreasing trend of y with respect to t is evaluated based on the
sign and magnitude of the coefficient a.
2.2. Research results
2.2.1. Frequency of meteorological drought
The PED index was calculated for both the dry season (December, January,
February) and the rainy season (May to October) over the period from 1991 to 2021. The
results are presented in Figures 1 and 2.
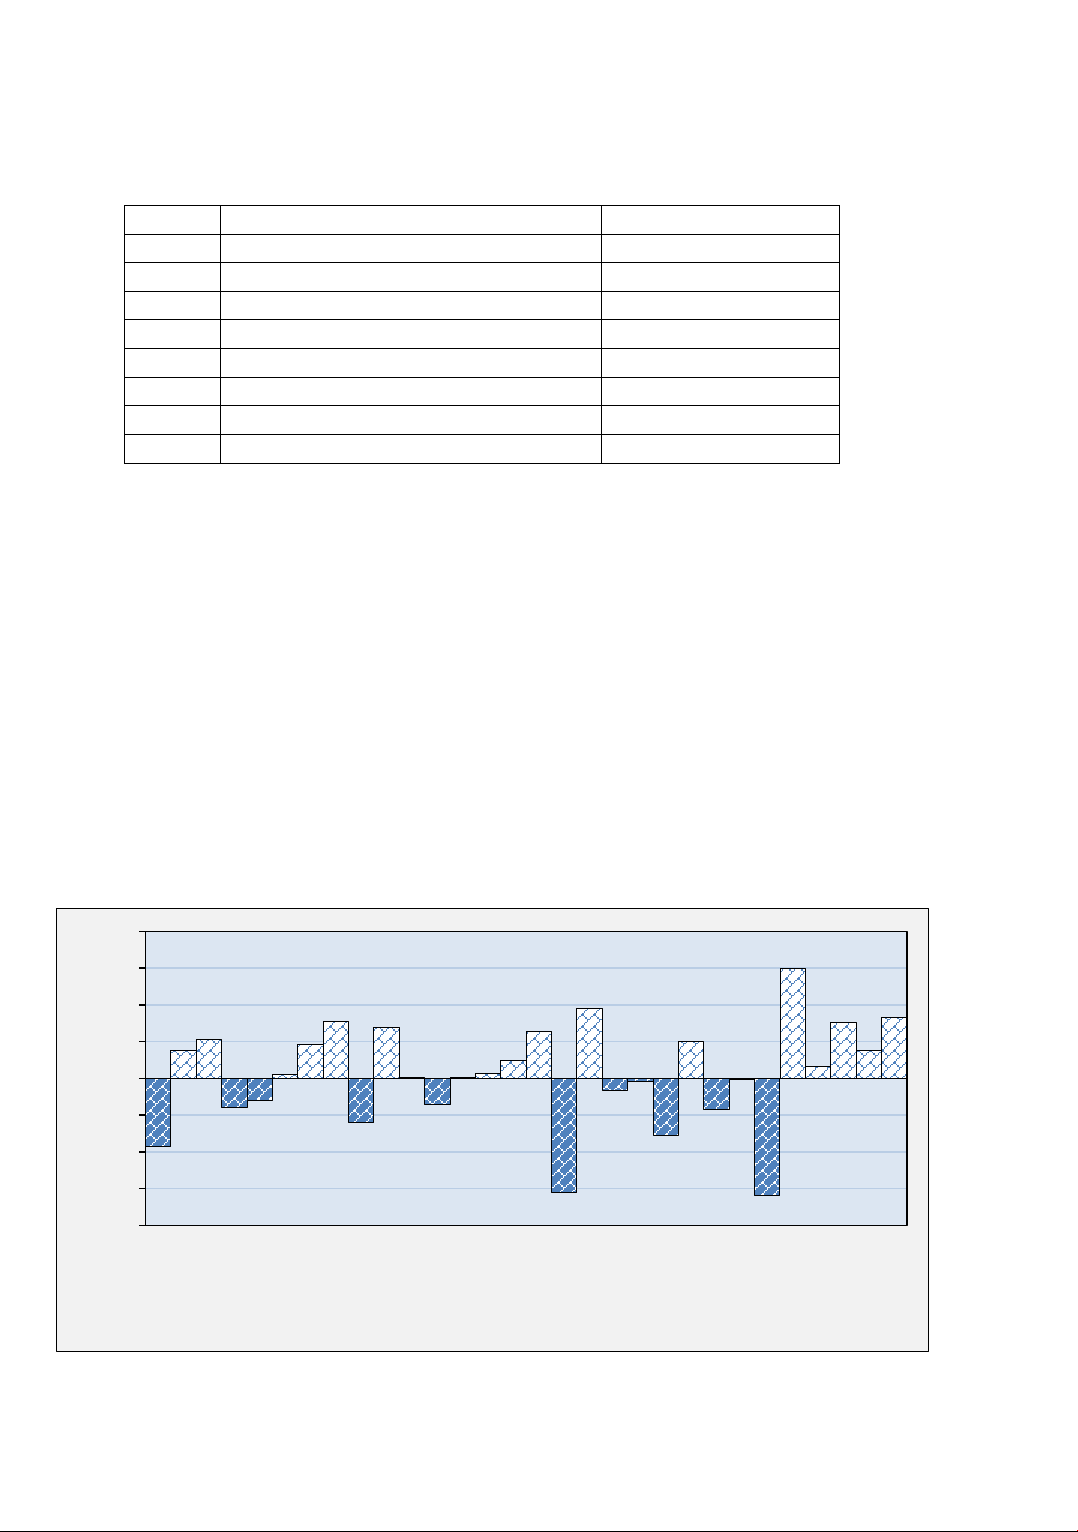
Figure 1. Dry season PED index for the period 1991-2021
-4.0
-3.0
-2.0
-1.0
0.0
1.0
2.0
3.0
4.0
1991-1992
1992-1993
1993-1994
1994-1995
1995-1996
1996-1997
1997-1998
1998-1999
1999-2000
2000-2001
2001-2002
2002-2003
2003-2004
2004-2005
2005-2006
2006-2007
2007-2008
2008-2009
2009-2010
2010-2011
2011-2012
2012-2013
2013-2014
2014-2015
2015-2016
2016-2017
2017-2018
2018-2019
2019-2020
2020-2021
Dry season PED
Dry season
Meteorological drought developments in Thai Binh province in the context…
189
Figure 2. Rainy season PED index for the period 1991-2021
Using the PED values for the dry and rainy seasons from the years compared with
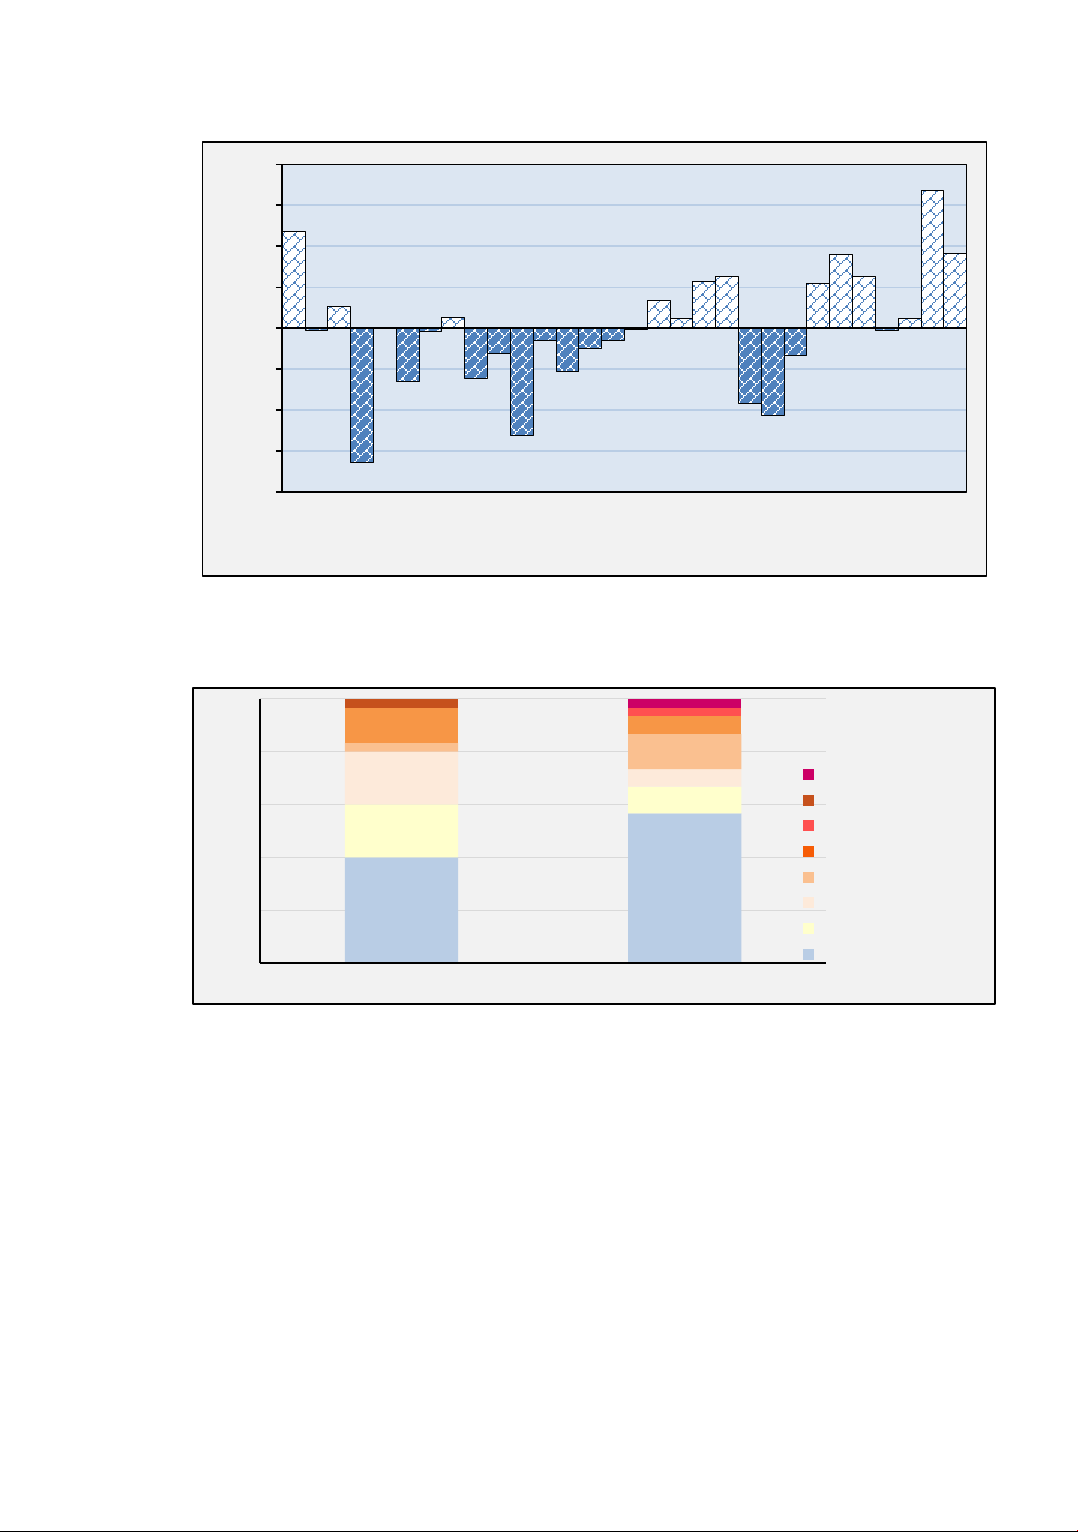
Table 1, the frequency of drought is calculated. The results are presented in Figure 3.
Figure 3. Frequency of drought in the dry and rainy seasons
Figures 1, 2, and 3 indicate that during the period from 1991 to 2021, the PED value
in the dry season ranged from -3.1996 to 2.9771. There were 18 dry seasons classified as
having humidity and normal levels , accounting for 60% of the total; 7 dry seasons
categorized as starting drought and slight drought, representing 23.3%; 4 dry seasons
classified as medium drought, making up 13.3%; and 1 dry season categorized as high
drought, equivalent to 3.4%. In Thai Binh, although the dry season months during the
winter-spring period experience low rainfall (averaging 83mm), the temperatures are also
relatively low (averaging 17.3 °C), so the PED value is not high. Consequently, drought
occurrences are infrequent and generally not severe. Notable dry seasons were classified
as medium drought levels or above due to significant decreases in rainfall, coupled with
rising temperatures. For instance, during the dry seasons of 1998 - 1999, 2008 - 2009,
2018 - 2019, and 2020 - 2021, rainfall reached only 30-75% of the average for the
-4.0
-3.0
-2.0
-1.0
0.0
1.0
2.0
3.0
4.0
1991
1992
1993
1994
1995
1996
1997
1998
1999
2000
2001
2002
2003
2004
2005
2006
2007
2008
2009
2010
2011
2012
2013
2014
2015
2016
2017
2018
2019
2020
Rainy season PED
Year
0%
20%
40%
60%
80%
100%
Dry season Rainy season
Severe drought
High drought
Quite high drought
Medium drought
Slightly drought
Start drought
Normal
Humidity

![Bài tập Nông nghiệp đại cương [nếu có thêm thông tin về loại bài tập, ví dụ: trắc nghiệm, thực hành,... thì bổ sung vào]](https://cdn.tailieu.vn/images/document/thumbnail/2025/20251124/stu755111075@hnue.edu.vn/135x160/57241763966846.jpg)


![Sổ tay Chuyển đổi số cho doanh nghiệp vừa và nhỏ trong lĩnh vực nông nghiệp [mới nhất]](https://cdn.tailieu.vn/images/document/thumbnail/2025/20251206/vitobirama/135x160/11101770625182.jpg)


