
Journal of Science and Technique - ISSN 1859-0209
35
DETERMINING SEASONAL SEAFLOOR
DEPTH CHANGES AROUND OFFSHORE ISLANDS OF VIETNAM
USING SENTINEL-2 AND GOOGLE EARTH ENGINE
Nhu Hung Nguyen1,*, Van Phu Le1, Van Son Nguyen2
1Institute of Techniques for Special Engineering, Le Quy Don Technical University
2Faculty of Radio-Electronic Engineering, Le Quy Don Technical University
Abstract
This study focuses on determining bathymetric changes around offshore islands of Vietnam
using remote sensing data available on the Google Earth Engine cloud platform. Sentinel-
2 multispectral satellite imagery was collected over three time periods, January 14, 2020,
June 5, 2020 and June 15, 2021, coinciding with the wind season to analyze and calculate
bathymetric changes. The results of the bathymetry compared to the field measurement
points have coefficients of determination (R2) ranging from 0.83 to 0.94. The Relative
Mean Square Error (RMSE) results obtained were 0.066 m, 0.048 m and 0.079 m, initially
providing a map of seasonal bathymetry changes consistent with reality. This method
demonstrates the efficiency and automation potential for tracking depth changes in the
Vietnamese coastal region, especially around offshore islands. Moreover, it highlights the
importance of continuous monitoring for environmental protection, navigation, and
resource management.
Keywords: Bathymetry; remote sensing; Sentinel-2; Google Earth Engine; offshore islands;
climate change.
1. Introduction
Monitoring bathymetric changes is a crucial component of oceanographic research,
marine resource management, and environmental protection. The seabed hosts a variety
of important natural resources, including hydrocarbons, minerals, and marine
biodiversity, making it vital to monitor and understand its dynamic behavior over time.
Bathymetric changes can occur due to natural processes such as erosion, sediment
deposition, and tectonic activity, as well as human-induced factors like dredging and
offshore infrastructure development.
Traditional methods for bathymetric measurement include single-beam and multi-
beam sonar systems and airborne LiDAR. These methods, while accurate, are often
* Corresponding author, email: nguyennhuhung@lqdtu.edu.vn
DOI: 10.56651/lqdtu.jst.v7.n02.897.sce

Section on Special Construction Engineering - Vol. 07, No. 02 (Dec. 2024)
36
limited by their high cost, time-consuming nature, and restricted spatial coverage [1].
They also require specialized equipment and personnel, making it difficult to achieve
continuous, large-scale bathymetric monitoring, especially in offshore or hard-to-reach
areas [2].
With the advancement of satellite remote sensing, it has become possible to estimate
bathymetry from space. Satellite-based methods offer a cost-effective and efficient way to
monitor large areas regularly, with the added benefit of accessing historical data to study
changes over time. Sentinel-2, with its high-resolution multispectral imagery, has proven
to be a valuable resource for bathymetric studies [3, 4]. The availability of this data on the
Google Earth Engine (GEE) platform further enhances its usability, providing a powerful
cloud-based tool for accessing, processing, and analyzing large datasets in real-time [5].
This study focuses on identifying seasonal changes in bathymetry around offshore
islands of Vietnam using remotely sensed data available on the GEE platform. By
leveraging remote sensing and cloud computing, this study seeks to demonstrate a more
efficient approach to bathymetry monitoring that can be applied to other coastal areas in
the future.
2. Materials and methodology
2.1. Study area
The study was conducted on the Truong Sa Islands, focusing on offshore islands
characterized by complex marine dynamics. The specific area chosen for this study spans
approximately 9 km in length and 1.8 km in width, oriented along a northeast-southwest
axis. The area has a lake bed and is surrounded by coral reefs, sandbanks and seagrass
beds, which are highly sensitive to environmental changes. These islands are not only
ecologically significant but also strategically important for national security. The study
area is subject to dynamic environmental processes such as wave action, tidal changes
and sediment transport, making it a suitable location to study bathymetric variations. In
addition, the surrounding waters support a diversity of marine life and any bathymetric
changes could have far-reaching ecological impacts.
2.2. Data sources
For this study, Sentinel-2 satellite data was used, which is available on the GEE
platform. Sentinel-2 provides optical imagery with a spatial resolution of 10 meters for
visible and near-infrared bands, making it ideal for shallow water studies. The data
collected includes surface reflectance values from the Blue (Band 2), Green (Band 3), and

Journal of Science and Technique - ISSN 1859-0209
37
Red (Band 4) bands, which are particularly useful for analyzing water properties and
estimating depth in coastal and offshore regions.
Data was collected for three specific time periods: January 14, 2020, June 5, 2020
and June 15, 2021. These timeframes were chosen based on cloud cover, as minimal cloud
cover ensures the most accurate surface reflectance readings. The images were
preprocessed within GEE, including atmospheric correction using the Sen2Cor algorithm,
cloud masking, and the exclusion of land and other non-water objects. The preprocessing
steps are critical to ensure that only high-quality data is used for bathymetric estimation.
In addition to satellite data, tidal measurements and in-situ depth data from field
surveys were used to validate the bathymetric estimates and adjust for tidal fluctuations.
These measurements help to improve the accuracy of the bathymetric models by
providing ground truth data.
2.3. Methodology
The methodology used in this study involves the following key steps:
Preprocessing Sentinel-2 imagery:
The Sentinel-2 images were filtered based on cloud cover and atmospheric
conditions using GEE’s cloud masking capabilities. Non-water areas were removed using
threshold values specific to the study area: Green band reflectance (ρGREEN > 0.01),
Red band reflectance (ρRED < 0.1), and Near-Infrared band reflectance (ρNIR < 0.03). This
process ensures that the data used for depth estimation corresponds only to water bodies,
thereby minimizing the impact of noise from land or cloud cover.
Bathymetric estimation:
The next step is to apply the Normalized Difference Water Index (NDWI) to
enhance the contrast between water and land features to extract the water surface. The
NDWI index was calculated according to the following formula [6]:
GREEN NIR
GREEN NIR
NDWI
(1)
where ρGREEN, ρNIR are reflectance values in the GREEN (Band 3) and NIR (Band 8) bands
of the Sentinel-2 multispectral image. The reflectance values were then used to calculate
the remote sensing reflectance (Rrs) using established algorithms. The Stumpf algorithm,
which correlates water depth with the attenuation of blue and green light, was used for
estimating water depth [7]. This algorithm is widely used for deriving bathymetry from

Section on Special Construction Engineering - Vol. 07, No. 02 (Dec. 2024)
38
multispectral satellite imagery due to its ability to account for varying water clarity and
bottom types [8].
Additionally, the concentration of chlorophyll-a (Chl-a) was incorporated into the
model to refine the depth estimates [9, 10]. Chlorophyll-a concentrations affect the optical
properties of water and can influence the accuracy of depth retrieval. In this study, a fixed
Chl-a value of 0.5 mg/m³ was used based on previous research in similar regions [5]. The
depth estimation parameters (m and n) of the Stumpf algorithm are respectively calculated
according to formulas (2) and (3):
(0.957 )Chl a
m a e
(2)
(0.957 )Chl a
n b e
(3)
Finally, the study estimates water depth by quantifying the different attenuation
levels between the blue and green image bands [7]:
ln(1000 blue)
Depth ln(1000 green)
rs
rs
r
mn
r
(4)
To determine the values of a and b, the authors used field measurement data
combined with a linear regression algorithm. The parameters m and n will be calculated
after the linear regression process.
Tidal and calibration adjustments:
After estimating the depth, tidal data from three time periods were used to adjust
the bathymetric values to a consistent tidal reference. The tidal difference between
January 14, 2020 (0.4 m) and June 5, 2020 (1.6 m) was 1.4 m, and between June 5, 2020
and June 15, 2021 (1.8 m) was 0.4 m. This correction for variation ensures that the
bathymetric changes reflect actual seafloor movements rather than tidal fluctuations. In
situ bathymetric measurements collected during field surveys were also used to calibrate
the bathymetric estimates, improving the accuracy and reliability of the results.
Change detection:
Finally, the image difference has been used to detect depth changes between the
times. By deducting depth values with the same pixel position, the discovery map has
been created to visualize the areas where the depth variants occur.
3. Results and discussion
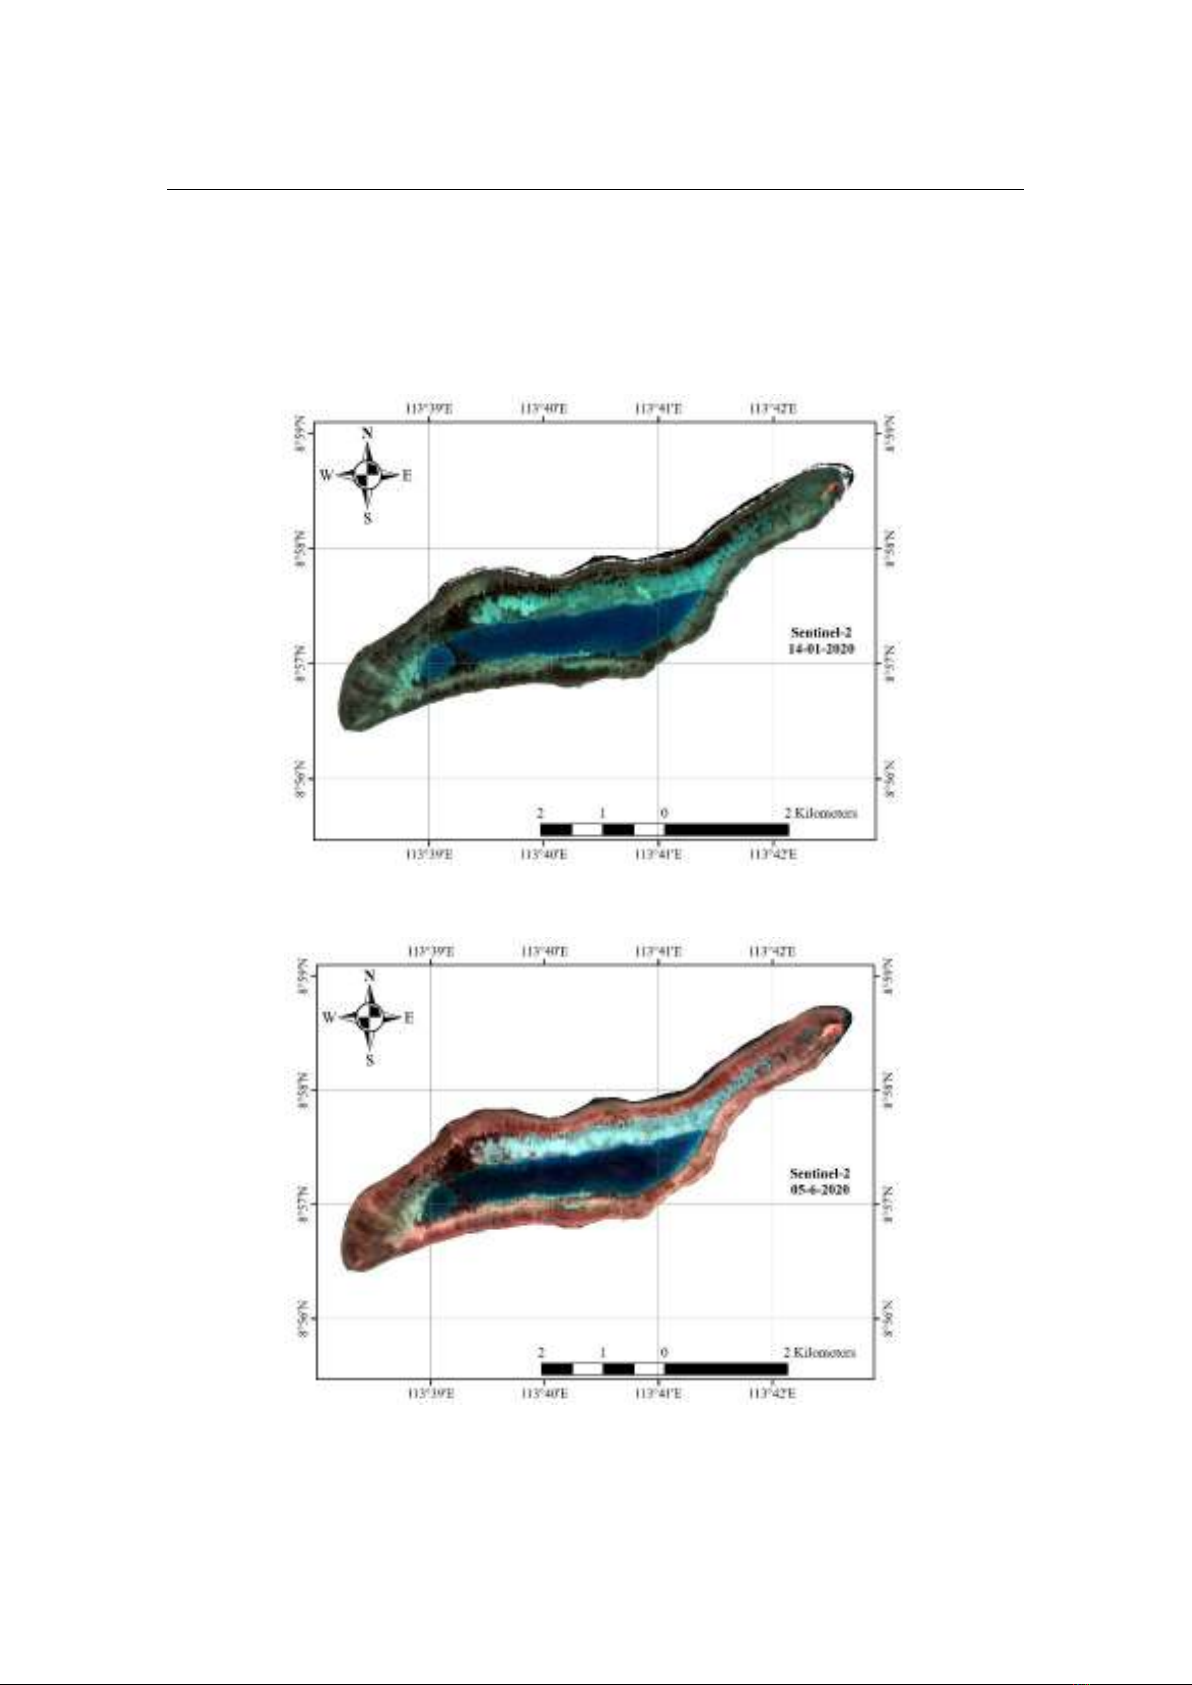
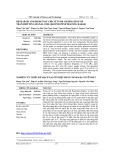
Figure 1, 2, 3 respectively present Sentinel-2 satellite images of the study area on
January 14, 2020, June 5, 2020, and June 15, 2021. The images are displayed in a natural
color composite (Red - Green - Blue).
Journal of Science and Technique - ISSN 1859-0209
39
Figure 4 depicts the field measurement points. The number of points is 253, with
depths ranging from 0 m to 1.1 m. Next, Fig. 5, 6, 7 show the depth determined from the
collected Sentinel-2 satellite images. Overall, the depth varies from 0 m to below 15 m.
Additionally, the depth increases towards the center of the basin in the study area.
Fig. 1. Sentinel-2 images of the research area collected on January 14, 2020.
Fig. 2. Sentinel-2 images of the research area collected on June 5, 2020.


![Đồng hồ đo thông minh: 6 gợi ý và các phụ tải nút [chuẩn nhất]](https://cdn.tailieu.vn/images/document/thumbnail/2013/20130701/lilinz/135x160/2481372680874.jpg)
![Đồng hồ đo thông minh và phụ tải nút: 6 gợi ý [chuẩn nhất]](https://cdn.tailieu.vn/images/document/thumbnail/2013/20130623/sea123123/135x160/1504817_349.jpg)


![Bài giảng Vi điều khiển Nguyễn Huy Hoàng: Tổng hợp kiến thức [Chuẩn nhất]](https://cdn.tailieu.vn/images/document/thumbnail/2026/20260316/hoatrami2026/135x160/72211773806757.jpg)


![Bài giảng Tự động hoá thiết bị điện [chuẩn nhất]](https://cdn.tailieu.vn/images/document/thumbnail/2026/20260312/hoabattu2026/135x160/61691773631881.jpg)
