
Open Access
Available online http://ccforum.com/content/10/3/R97
Page 1 of 7
(page number not for citation purposes)
Vol 10 No 3
Research
Morbidity and cost burden of methicillin-resistant
Staphylococcus aureus in early onset ventilator-associated
pneumonia
Andrew F Shorr1, Ying P Tabak2, Vikas Gupta2, RS Johannes2, Larry Z Liu3 and Marin H Kollef4
1Pulmonary and Critical Care Medicine Service, Washington Hospital Center, Washington, District of Columbia, USA
2Cardinal Health Clinical – Research Group, 500 Nickerson Road, Marlborough, Massachusetts, USA
3Pfizer Inc, New York, New York, USA
4Washington University School of Medicine, St. Louis, Missouri, USA
Corresponding author: Andrew F Shorr, afshorr@dnamail.com
Received: 16 Feb 2006 Revisions requested: 22 Mar 2006 Revisions received: 20 Apr 2006 Accepted: 3 May 2006 Published: 29 Jun 2006
Critical Care 2006, 10:R97 (doi:10.1186/cc4934)
This article is online at: http://ccforum.com/content/10/3/R97
© 2006 Shorr et al.; licensee BioMed Central Ltd.
This is an open access article distributed under the terms of the Creative Commons Attribution License (http://creativecommons.org/licenses/by/2.0),
which permits unrestricted use, distribution, and reproduction in any medium, provided the original work is properly cited.
Abstract
Introduction To gain a better understanding of the clinical and
economic outcomes associated with methicillin-resistant
Staphylococcus aureus (MRSA) infection in patients with early
onset ventilator-associated pneumonia (VAP), we
retrospectively analyzed a multihospital US database to identify
patients with VAP over a 24 month period (2002–2003).
Method Data recorded included physiologic, laboratory, culture,
and other clinical variables from 59 institutions. VAP was
defined as new positive respiratory culture after at least 24
hours of mechanical ventilation (MV) and the presence of
primary or secondary ICD-9-CM diagnosis codes of pneumonia.
Outcomes measures included in-hospital morbidity and
mortality for the population overall and after onset of VAP
(duration of MV, intensive care unit [ICU] stay, in-hospital stay,
and case mix and severity-adjusted operating cost). The overall
cost was calculated at the hospital level using the Center for
Medicare and Medicaid Services Cost/Charge Index for each
calendar year.
Results A total of 499 patients were identified as having VAP.
S. aureus was the leading organism (31% of isolates). Patients
with MRSA were significantly older than patients with
methicillin-sensitive Staphylococcus aureus (MSSA; median
age 74 versus 67 years, P < 0.05) and more likely to be medical
patients. Compared with MSSA patients, MRSA patients on
average consumed excess resources of 4.4 (95% confidence
interval 0.6–8.2) overall MV days, 3.8 (-0.5 to +8.0) days of
inpatient length of stay (LOS), 5.3 (1.0–9.7) ICU days, and
US$7731 (-US$8393 to +US$23,856) total cost after
controlling for case mix and other factors. Furthermore, MRSA
patients needed excess resources after the onset of VAP (4.5
[95% confidence interval 1.0–8.1] MV days, 3.7 [-0.5 to +8.0]
inpatient days, and 4.4 [0.4–8.4] ICU days) after controlling for
the same case mix and admission severity covariates.
Conclusion S. aureus remains a common cause of VAP. VAP
due to MRSA was associated with increased overall LOS, ICU
LOS, and attributable ICU LOS compared with MSSA-related
VAP. Although not statistically significant because of small
sample size and large variation, the attributable excess costs of
MRSA amounted to approximately US$8000 per case after
controlling for case mix and severity.
Introduction
Ventilator-associated pneumonia (VAP) is a major nosocomial
infection in the intensive care unit (ICU), affecting between
10% and 20% of patients who receive more than 48 hours of
mechanical ventilation (MV) [1]. Several studies [2-5] have
documented that VAP significantly increases hospital and ICU
length of stay (LOS), duration of MV, and hospital costs. VAP
may also increase mortality, although this remains controver-
sial [6].
ICD-9-CM = International Classification of Diseases, Ninth Revision, Clinical Modification; ICU = intensive care unit; LOS = length of stay; MRSA =
methicillin-resistant Staphylococcus aureus; MSSA = methicillin-sensitive Staphylococcus aureus; MV = mechanical ventilation; VAP = ventilator-
associated pneumonia.

Critical Care Vol 10 No 3 Shorr et al.
Page 2 of 7
(page number not for citation purposes)
Staphylococcus aureus is the leading cause of VAP in Europe
and ranks alongside Pseudomonas aeruginosa as the most
prevalent cause of VAP in US hospitals [6,7]. The increasing
prevalence of antibiotic-resistant strains is of concern, with
more than 60% of S. aureus isolates recovered from the ICU
now resistant to methicillin (methicillin-resistant Staphylococ-
cus aureus [MRSA]) [8]. MRSA appears to be associated with
worse outcomes than methicillin-sensitive S. aureus (MSSA)
infection. In a meta-analysis conducted by Cosgrove and cow-
orkers [9], MRSA bacteremia was found to increase signifi-
cantly the risk for death compared with MSSA bacteremia.
However, evaluation of the excess burden of MRSA compared
with MSSA has also been limited by confounding factors. In
one of the largest studies evaluating the impact of MRSA in
VAP [10], the unadjusted mortality rate was significantly
higher for MRSA than for MSSA infection. Following adjust-
ment for severity of illness at admission, duration of ICU LOS
before VAP diagnosis, and adequacy of antimicrobial treat-
ment, this difference was no longer significant. Combes and
coworkers [11] recently evaluated a group of VAP patients
who all received initial appropriate antibiotic therapy, and
reported that there was no excess attributable mortality for
MRSA versus MSSA.
Although mortality is an important end-point in any analysis of
the critically ill, morbidity and costs of critical care are also sig-
nificant issues [12]. Investigators in the US have reported that
MRSA significantly increases LOS and hospital charges com-
pared with MSSA in bacteremia and surgical site infections,
with an excess attributable LOS of 2–8 days and excess attrib-
utable charges of US$7000–14,000 [13-15]. Morbidity and
cost data from analyses of multiple institutional databases spe-
cific to MRSA-related pneumonias are more limited and are
not US focused.
Given the paucity of local data on the clinical and economic
impact of MRSA-related VAP, we conducted a retrospective
analysis involving a large US database with two objectives in
mind: to identify risk factors associated with the development
of VAP among patients admitted to the ICU and to assess the
affect of VAP on patient outcomes, including overall and attrib-
utable hospital morbidity, mortality, and total costs.
Materials and methods
Study design
A retrospective cohort analysis was performed to examine the
clinical and economic outcomes associated with MRSA and
MSSA in patients with VAP. All available clinical and financial
data were obtained for all patients with VAP admitted to 59 US
hospitals (16 teaching and 43 nonteaching) between 1 Janu-
ary 2002 and 31 December 2003.
Analyses of the impact of pathogens on MRSA versus MSSA
mono-microbial subgroups (total n = 154) were particularly
focused on the objective measures of resource utilization,
including length of MV, in-patient LOS, and ICU LOS. These
dependent variables were analyzed separately as the overall
length of event and the length of event from the onset of VAP.
Hospital costs for each VAP case were calculated as follows:
specific operating cost (defined as the hospital specific cost/
charge ratio × hospital total charges); and total cost (defined
as [operating cost/charge ratio + capital cost/charge ratio] ×
total charge). The cost/charge ratios were obtained from the
Center for Medicare and Medicaid Services database for each
hospital for calendar years 2002 and 2003 [16]. In other
words, we computed total costs for each patient by taking the
component charges for the hospital stay (for example, phar-
macy, laboratory, bed day, and so on) and then multiplying
them by the Medicare cost-to-charge ratios. These component
costs were then summed to derive the total costs.
Data source
Data for the present analysis were obtained from the Cardinal
Health Research Database (Cardinal Health, MediQual, Marl-
borough, MA, USA [formerly MedisGroup]) [3], a large, multi-
institutional database of US acute-care hospitals. Details of
this database were reported previously [3,17-20]. Briefly, the
database comprises clinical findings, including patient's clini-
cal history, pathophysiologic findings (such as, vital signs, lab-
oratory test results, culture findings), and physician
assessments also includes administrative data imported from
hospital information systems [3,7,17-20]. The clinical data are
generally collected for the first two days of hospitalization for
all participating hospitals on all of the patients. For a small
group of hospitals (n = 59), laboratory data, including culture
data, are collected for the first five days of hospitalization. Hos-
pitals that opted for five day data collections did so voluntarily,
primarily for the purposes of internal quality improvement.
Because of this limitation, we were only able to identify early
onset VAP (mostly within five days of hospitalization).
Study sample
During the study period, a total of 59 US hospitals (16 teach-
ing and 43 nonteaching) collected clinical and culture data for
the first 5 days for all of their patients. Among the 59 hospitals,
42 reported early onset VAP cases with positive culture
(within five days of hospitalization). These 42 hospitals were
included in the final analysis. Among them, 17% had numbers
of beds below 100; 76% had between 101 and 300 beds,
and 7% had more than 300. The teaching hospitals accounted
for 21% of hospitals. VAP was defined as present in patients
who were on a ventilator for at least 24 hours with a first pos-
itive bacterial respiratory culture after initiation of MV and with
either primary or secondary ICD-9-CM (International Classifi-
cation of Diseases, Ninth Revision, Clinical Modification) diag-
nosis codes for pneumonia. For patients who had more than
one admission to the ICU for VAP during the same hospitaliza-
tion, the first ICU admission was used in this analysis.
Resource utilization (in-hospital LOS, ICU LOS, and duration
of MV) included data for the entire hospital stay.
Available online http://ccforum.com/content/10/3/R97
Page 3 of 7
(page number not for citation purposes)
Statistical analysis
Univariate and multivariate analyses were conducted for all
dependent measures. Nonparametric tests were used for con-
tinuous variables and χ2 test for dichotomous variables. Ordi-
nary least square multiple regressions were used to estimate
the impact of MRSA on resource utilizations. Covariates
included risk for death score (the predicted probability of
death based on admission severity), severe trauma, major sur-
gery, number of days from admission to onset of VAP, and
MRSA. The risk factors used to generate the death propensity
score included demographic variables, coexisting conditions
(such as, cancer, cerebrovascular disease, liver disease, renal
disease, congestive heart failure, immunosuppressed status),
physical examination findings (for example, vital signs, altered
mental status), laboratory findings (for example, blood urea
nitrogen, glucose), and other clinical findings. In the multivari-
ate analysis we also tested the effect of mortality status to
examine whether patients who died in hospital had different
resource consumption compared with survivors. In addition,
we tested the interaction effect of mortality status and MRSA
status to determine whether the MRSA effect varied by mortal-
ity status. Finally, we tested hospital's teaching status on all of
the outcome measures.
All statistical analyses were conducted using SAS software
(version 9.01; SAS Institute Inc., Cary, NC, USA). P < 0.05
was considered statistically significant.
Results
Patient characteristics, pathogen distribution, and risk
factors for ventilator-associated pneumonia
A total of 499 patients were identified as having VAP between
1 January 2002 and 31 December 2003. Of mono-microbial
respiratory cultures, S. aureus was the most frequent organ-
ism isolated in patients with a confirmed diagnosis of VAP
(31%; Figure 1), followed by P aeruginosa (21%), Haemo-
philus influenzae (12%), Klebsiella pneumoniae (8%), and
Escherichia coli (6%). Other identified organisms accounted
for 22% of the total isolates. A total of 95 patients had MSSA-
related VAP, 59 had MRSA-related VAP, and 182 patients
were infected with a Gram-negative organism.
There were significant differences in demographics and clini-
cal characteristics among patients with VAP due to MRSA,
MSSA, and Gram-negative organisms (Table 1). Compared
with patients with VAP due to MSSA or Gram-negative organ-
isms, patients with VAP due to MRSA were older, were more
likely to have congestive heart failure or immunosuppression
as a comorbidity, were more likely to be medical patients, and
were less likely to be admitted to a trauma or surgical unit.
They more likely to be covered by Medicare. Compared with
patients with VAP due to a Gram-negative organism, patients
with MRSA-related VAP were more likely to be admitted with
a pleural effusion and more likely to have diabetes mellitus.
However, acute clinical presentations represented by labora-
tory findings, vital signs, Glasgow Coma Scale score, and
presence of bacteremia, as well as aggregated severity of ill-
ness measured by Admission Severity Group, were generally
similar across the three groups (Table 1).
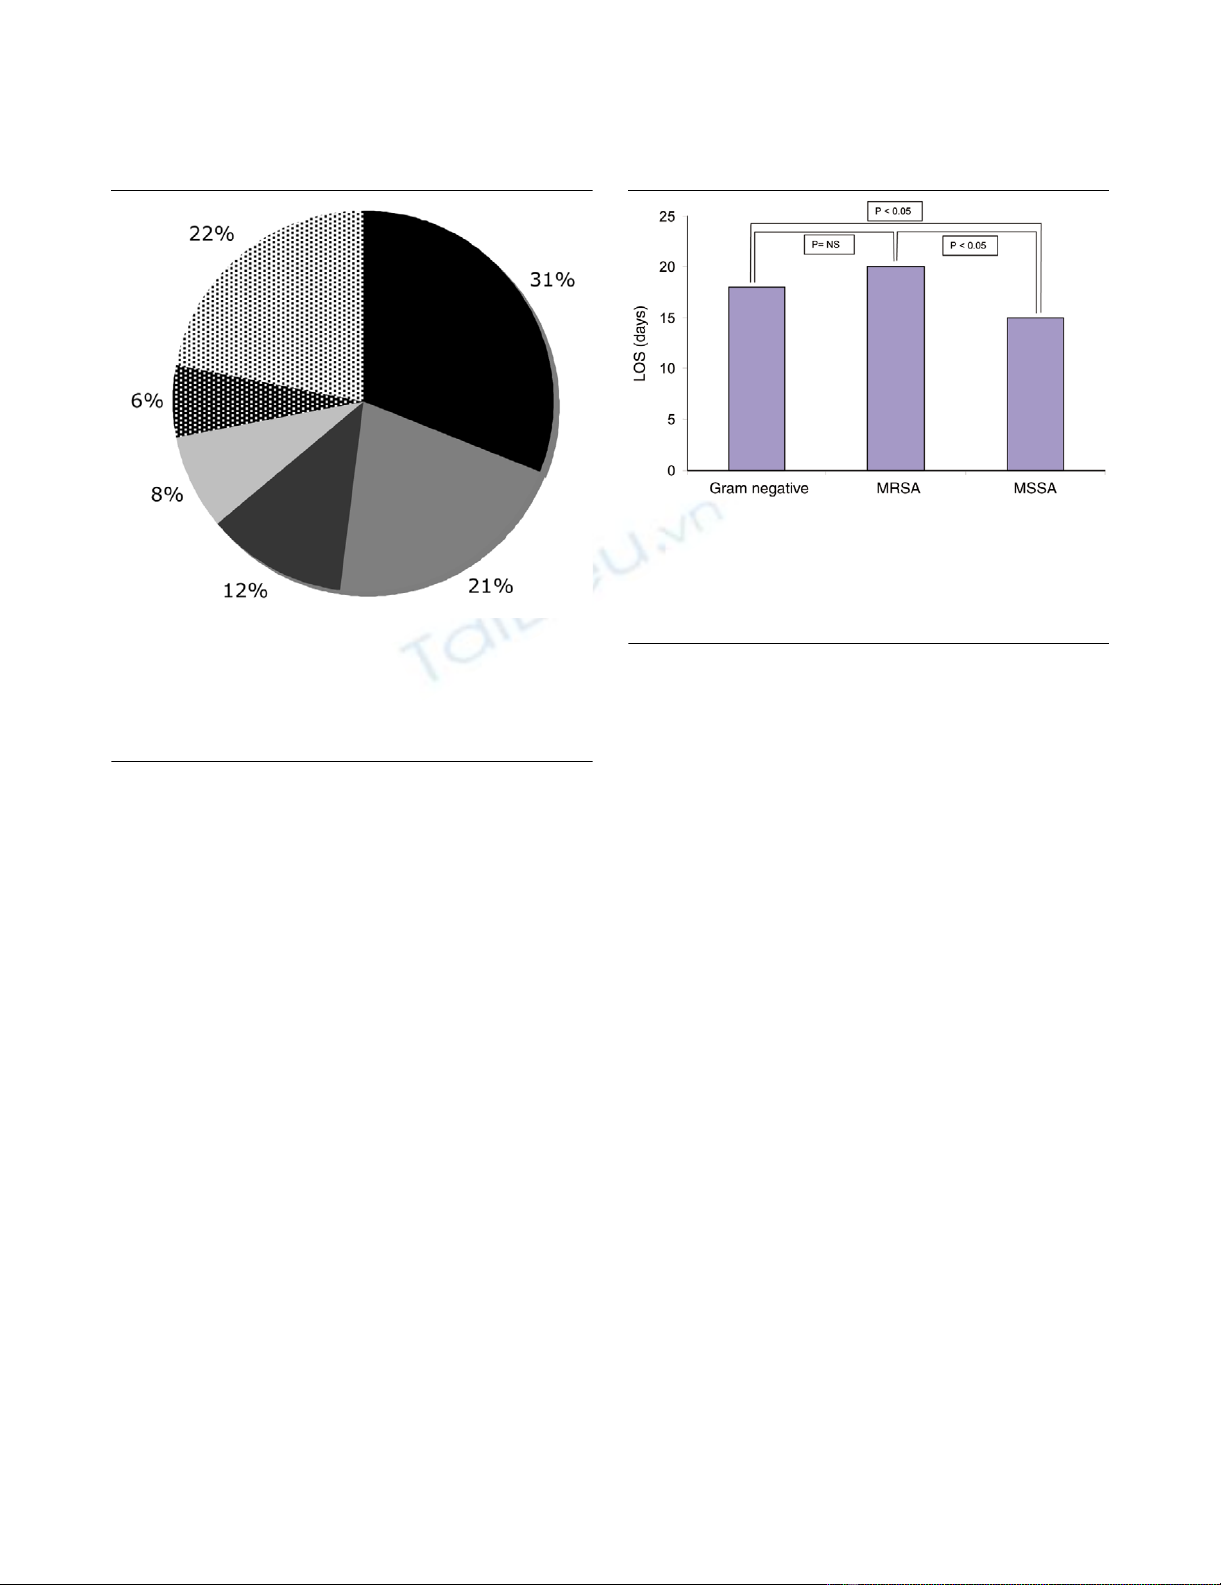
Figure 1
Etiologic agents of ventilator-associated pneumonia: frequenciesEtiologic agents of ventilator-associated pneumonia: frequencies. Sta-
phylococcus aureus (31%) was the most frequent organism isolated in
patients with a confirmed diagnosis of ventilator-associated pneumonia
followed by Pseudomonas aeruginosa (21%), Haemophilus influenzae
(12%), Klebsiella pneumoniae (8%), and Escherichia coli (6%). Other
identified organisms accounted for 22% of all isolates.
Figure 2
Length of stay for MRSA, MSSA, and Gram-negative infectionsLength of stay for MRSA, MSSA, and Gram-negative infections.
Patients with MRSA (20 days) or Gram-negative (18 days) related VAP
had a longer overall median LOS than did patients with MSSA-related
(15 days) VAP. MRSA, methicillin-resistant Staphylococcus aureus;
MSSA, methicillin-sensitive Staphylococcus aureus; LOS, length of
stay; VAP, ventilator-associated pneumonia.

Critical Care Vol 10 No 3 Shorr et al.
Page 4 of 7
(page number not for citation purposes)
Clinical and economic outcomes
In patients with VAP, the crude in-hospital mortality rate of
patients with S. aureus infection was not statistically signifi-
cantly different from that due to Gram-negative infection (29%
versus 36%). Similarly, there were no significant differences in
terms of mortality rates between patients with MRSA and
those with MSSA (29% versus 36%).
Patients with MRSA-related VAP had a longer overall LOS (20
versus 15 days; P = 0.04) and ICU LOS (13 versus 9 days; P
< 0.006) than did patients with MSSA-related VAP (Table 2,
Figure 2). The univariate analysis stratified by mortality status
indicated that MRSA survivors consumed more resources
than did MSSA survivors. In contrast, MSSA patients who died
consumed more resources than did MRSA patients who died.
Table 1
Patient demographic and clinical characteristics
Characteristics MRSA (n = 59) MSSA (n = 95) Gram negative (n = 182)
Demographics
Age (median [IQR]; years) 74 (64–81) 67* (47–78) 65† (53–76)
Male 55.9% 52.6% 63.2%
Insurance
Medicare 67.8% 49.5%* 50.0%†
Medicaid 3.4% 8.4% 6.0%
Managed care 15.3% 17.9% 17.0%
Comorbidities
Immunosuppressed 22.0% 8.4%* 12.1%†
Cancer 15.3% 9.5% 16.5%
Diabetes mellitus 39.0% 28.4% 25.8%†
Chronic renal failure 17.0% 9.5% 13.7%
Congestive heart failure 45.8% 22.1%* 19.8%†
Median number of comorbidities (IQR) 3 (1–5) 2* (0–4) 2 (1–3)
Acute clinical presentation on admission
Albumin <2.4 g/dl 3.4% 4.2% 4.4%
Arterial pH <7.3 5.1% 13.7% 8.2%
Creatinine >1.5 mg/dl 8.5% 15.8% 6.6%
WBC <4.3 or >19.8 × 10³/mm36.8% 12.6% 6.6%
Bands >32% 1.7% 2.1% 1.1%
BUN >55 mg/dl 10.2% 5.3% 4.4%
BUN 40–55 mg/dl 5.1% 2.1% 2.2%
Temperature <35.6°C 11.9% 27.4%* 14.8%
Respiration >39 breaths/min 5.1% 4.2% 0.6%†
GCSc <6 27.1% 16.8% 20.3%
Pleural effusion 28.8% 20.0% 17.0%†
Bacteremia 10.2% 14.7% 7.1%
ASGd ≥ 3 72.6% 72.9% 66.5%
Care unit
Trauma unit 2.4% 13.9%* 15.1%†
Major surgery 11.9% 17.9% 26.9%
*P < 0.05 for MSSA versus MRSA; †P < 0.05 for Gram-negative versus MRSA. ASG, Admission Severity Group; BUN, blood urea nitrogen;
GCS, Glasgow Coma Scale; IQR, interquartile range; MRSA = methicillin-resistant Staphylococcus aureus; MSSA = methicillin-sensitive
Staphylococcus aureus.

Available online http://ccforum.com/content/10/3/R97
Page 5 of 7
(page number not for citation purposes)
This reversal effect of MRSA by mortality status may be partly
due to the case mix; more MSSA patients were trauma or sur-
gical patients whereas more MRSA patients were older and
sicker medical patients who died faster, thus consuming less
resources.
The multivariate analysis indicated that MRSA patients con-
sumed excess resources of 4.4 overall days on MV (P = 0.03),
3.8 inpatient days (P = 0.08), 5.3 days in the ICU (P = 0.02),
and US$7731 in total costs (P = 0.35) after controlling for
surgical and trauma status, time of onset of VAP, and admis-
sion severity compared with MSSA patients (Table 3). Further-
more, the MRSA patients consumed similar amount of excess
resources after the onset of VAP, including VAP MV days, VAP
inpatient LOS, and VAP ICU days compared with MSSA
(Table 3). When we added mortality status and the interaction
of mortality and MRSA status to the model, we find them sig-
nificant only for the total ICU length of stay model. Also, the
results were similar for all models. Hospital teaching status
was strongly correlated with major surgery and trauma status,
and was therefore eliminated from the final model.
Discussion
The present investigation utilized a large US database to ana-
lyze retrospectively the clinical and health economic impact of
VAP caused by MRSA versus MSSA infection. We found that
MRSA-related VAP was associated with significantly
increased overall hospital LOS, ICU LOS, and attributable ICU
LOS as compared with MSSA. Although not statistically sig-
nificant because of small sample size and large variance, the
attributable excess cost reached approximately US$8000 per
case after controlling for case mix and severity.
The present analysis of objectively measured resource utiliza-
tion and hospital level costs for the overall and attributable
impact of MRSA confirms the findings of two other retrospec-
tive inpatient US database analyses [7,21]. Kollef and cowork-
ers [7] observed that S. aureus was a major pathogen not only
in VAP but also in community-acquired, hospital-acquired, and
Table 2
Nonparametric univariate analysis of MRSA versus MSSA: duration of MV, inpatient LOS, ICU LOS, and total cost
Dependent variables MRSA – all
(n = 59) MSSA – all
(n = 95) P value MRSA Survivors
(n = 42) MSSA Survivors
(n = 61) P value MRSA
nonsurvivors
(n = 17)
MSSA
nonsurvivors
(n = 34)
P value
Total MV (days) 8 (4–20) 8 (3–14) 0.02 12 (3–21) 7 (3–10) 0.006 5 (4–10) 12 (6–15) 0.28
VAP MV (days) 6 (1–16) 6 (1–10) 0.04 9 (1–16) 3 (1–9) 0.03 3 (3–9) 7 (4–12) 0.38
Total inpatient LOS (days) 20 (11–32) 15 (11–23) 0.04 21 (13–32) 15 (10–25) 0.06 12 (7–29) 16 (13–20) 0.27
VAP inpatient LOS (days) 12 (7–23) 13 (8–18) 0.21 16 (9–26) 13 (8–19) 0.16 5 (3–12) 13 (8–17) 0.46
Total ICU (days)a13 (6–27) 9 (6–16) 0.006 15 (8–29) 7 (4–12) 0.0002 6 (5–12) 13 (9–19) 0.26
VAP ICU (days)a7 (3–16) 7 (3–12) 0.04 11 (7–20) 6 (3–11) 0.006 4 (3–10) 10 (6–15) 0.14
Total cost (US$) 40,734
(18,347–
71,064)
36,523
(15,539–
72,080)
0.30 41,968
(24,173–
74,249)
34,939
(14,959–
75,787)
0.30 31,597
(17,820–
62,967)
45,854
(18,958–
55,578)
0.49
A total of 154 patients were included in this analysis. Values are expressed as median (interquartile range). aAnalysis for ICU days was conducted
on patients (n = 95) from hospitals that collect ICU stay data. ICU, intensive care unit; LOS, length of stay; MRSA, methicillin-resistant
Staphylococcus aureus; MSSA, methicillin-sensitive Staphylococcus aureus; MV, mechanical ventilation; VAP, ventilator-associated pneumonia.
Table 3
Multivariate analysis of MRSA versus MSSA: duration of MV, inpatient LOS, ICU LOS, and total cost
Dependent variables MRSA estimate (95% CI) P value Model r2
Total MV (days) 4.4 (0.6 to 8.2) 0.03 0.16
VAP MV (days) 4.5 (1.0 to 8.1) 0.01 0.10
Total inpatient LOS (days) 3.8 (-0.5 to +8.0) 0.08 0.26
VAP inpatient LOS (days) 3.7 (-0.5 to +8.0) 0.08 0.06
Total ICU (days)a5.3 (1.0 to 9.7) 0.02 0.13
VAP ICU (days)a4.4 (0.4 to 8.4) 0.03 0.10
Total cost (US$) 7731 (-8393 to +23,856) 0.35 0.28
A total of 154 patients were included in this analysis. aAnalysis for ICU days was conducted on patients (n = 95) from hospitals that collect ICU
stay data. CI, confidence interval; ICU, intensive care unit; LOS, length of stay; MRSA, methicillin-resistant Staphylococcus aureus; MSSA,
methicillin-sensitive Staphylococcus aureus; MV, mechanical ventilation; VAP, ventilator-associated pneumonia.


![Báo cáo seminar chuyên ngành Công nghệ hóa học và thực phẩm [Mới nhất]](https://cdn.tailieu.vn/images/document/thumbnail/2025/20250711/hienkelvinzoi@gmail.com/135x160/47051752458701.jpg)


