Contents lists available at ScienceDirect
Expert Systems with Applications 38 (2011) 8370–8374
Expert Systems with Applications
j o u r n a l h o m e p a g e : w w w . e l s e v i e r . c o m / l o c a t e / e s w a
Multi-attribute decision making for green electrical discharge machining S.P. Sivapirakasam a,⇑
, Jose Mathew a, M. Surianarayanan b
a Department of Mechanical Engineering, National Institute of Technology, Tiruchirappalli, India b CISRA, Central Leather Research Institute, Chennai, India
a r t i c l e
i n f o
a b s t r a c t
This paper aims to develop a combination of Taguchi and fuzzy TOPSIS methods to solve multi-response parameter optimization problems in green manufacturing. Electrical Discharge Machining (EDM), a com- monly used non-traditional manufacturing process was considered in this study. A decision making model for the selection of process parameters in order to achieve green EDM was developed. An exper- imental investigation was carried out based on Taguchi L9 orthogonal array to analyze the sensitivity of green manufacturing attributes to the variations in process parameters such as peak current, pulse dura- tion, dielectric level and flushing pressure. Weighing factors for the output responses were determined using triangular fuzzy numbers and the most desirable factor level combinations were selected based on TOPSIS technique. The model developed in this study can be used as a systematic framework for parameter optimization in environmentally conscious manufacturing processes.
(cid:2) 2011 Elsevier Ltd. All rights reserved.
1. Introduction
dielectric itself. These toxic substances can enter the body of oper- ating personnel through ingestion, inhalation and skin contact. The performance characteristics of this process and the amount of waste generated from it are strongly influenced by the process parameters. Thus optimization of process parameters is an essen- tial requirement to achieve green EDM.
Manufacturing processes generate large amounts of various so- lid, liquid, and gaseous wastes. Apart from the generation of waste, the manufacturing process is considered to be an energy intensive activity, which also indirectly affects the environment. Implemen- tation of stringent government regulations and growing public awareness made the environmental issues in the processes one of the most important topics in strategic manufacturing decisions (Sheng & Srinivasan, 1995). Green manufacturing is an advanced manufacturing mode, aiming at improving the efficiency of the process as well as minimization of environmental impact and re- source consumption during the manufacturing process (Tan, Liu, Cao, & Zhang, 2002).
The selection of optimum process parameters to achieve green manufacturing involves contradictory criteria which necessitates the implementation of sophisticated Multi-Attribute Decision Making (MADM) methods. Analytic Hierarchic Process (AHP) (Saaty, 1980), Technique for Order Preference by Simulation of Ideal Solution (TOPSIS) (Hwang & Yoon, 1981), VIKOR (Tong, Chen, & Wang, 2007) and gray relational analysis (Deng, 1989) are the MADM techniques normally employed in solving engineering problems. Several researchers used these techniques in environ- mental impact assessment and green manufacturing (Kuo, Chang, & Huang, 2006; Tesfamariam & Sadiq, 2006). Yeo and New (1999) used a prioritization matrix for dielectric selection in a die sinking EDM process. However, no reported literature on the optimization of process parameters for green EDM is available.
Die sinking Electrical Discharge Machining (EDM) is one of the most popular non-traditional manufacturing processes suitable for machining very hard and brittle materials. Recent advances in the EDM technology made it a valuable and viable process in the manufacturing of critical parts such as aerospace and aeronautical components. Despite its advantages the EDM is considered as a hazardous process in which large amounts of toxic solid and liquid wastes and exhaust gas are discharged, resulting in serious occupa- tional and environmental problems (Tonshoff, Egger, & Klocke, 1996). High discharge energies of this process can lead to the aris- ing of a number of reaction-products of the dielectric, which can emit from its surface as aerosols or gases. Apart from the air emis- sions, hazardous substances can also concentrate in the slurry and
⇑ Corresponding author. Tel.: +91 431 2503408; fax: +91 431 2503402.
Among the MADM methods TOPSIS, which can handle multi-re- sponse problems with both continuous and discrete data, is the most suitable technique in manufacturing applications (Tong & Su, 1997). The basic philosophy of this method is to select the best alternative that has the shortest distance from the positive ideal solution and the farthest distance from the negative ideal solution. Real life multi-criteria decision-making problems usually involve uncertain, imprecise and subjective data, which make the deci- sion-making process more complex and challenging (Aiello, Enea, Galante, & Scalia, 2009). In evaluating such data, decision makers
Keywords: EDM TOPSIS Green manufacturing Multi-attribute decision making
E-mail address: spshivam@nitt.edu (S.P. Sivapirakasam).
0957-4174/$ - see front matter (cid:2) 2011 Elsevier Ltd. All rights reserved. doi:10.1016/j.eswa.2011.01.026
generally view risk in terms of linguistic variables like low, high, very high, very low, etc. Fuzzy set theory (Zadeh, 1965; Bortolan & Degami, 1985) deals effectively with this type of uncertainty (vagueness), thus allowing linguistic variables to be used for approximate reasoning. Generally triangular and trapezoidal fuzzy numbers are used for representing linguistic variables.
8371 S.P. Sivapirakasam et al. / Expert Systems with Applications 38 (2011) 8370–8374
time and cost of operation. The time required for unit material re- moval was considered as a factor in the present work.
The main objective of this work was to select optimum process parameters for die sinking EDM which best reflect the manufactur- ing priority between environmental and machining factors. The experiments were designed using Taguchi L9 orthogonal array. An analytical model was developed for optimizing the process parameters. Peak current, pulse duration, dielectric level and flush- ing pressure were the process parameters considered in this study. Relative importance of output parameters were designated by tri- angular fuzzy numbers (TFN). TOPSIS was used to evaluate the overall performance index values corresponding to each experi- mental run and optimum factor level combinations are identified based on the same.
2.2. Relative tool wear ratio
2. Decision making model for green EDM
During the electric discharge, some of the discharge energy ap- plied to the tool produces a crater in the tool material. This elec- trode wear influences the cost of operation as well as the amount of waste generated. The amount of erosion suffered by the tool compared with that of the work piece was referred to as the relative tool wear ratio.
2.3. Process energy
The electric energy consumed during the EDM operations indi- rectly affects the environment as more waste is produced in order to generate more electricity. This energy is determined by the gap voltage during discharge, the discharge current and the length of time that the current flows. In the present study the energy con- sumed for unit material removal was considered as the response variable.
2.4. Breathing zone concentration of aerosol
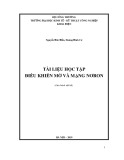
In die sinking EDM process, an electric arc struck between two conductive electrodes produces the energy required for the material removal. The process is carried out in a dielectric medium. The main cause of the material removal is the high temperature reached by the surface of both the electrodes due to the thermal energy generated in the discharge channel. Heat generated in the channel causes some of the work material to melt and even evaporate. As the spark collapses, the evaporated metal and part of the molten metal are carried away by the dielectric fluid which is flushed using pressure (Abbas, Solo- mon, & Bahari, 2007). In order to assess the relationship between the process parameters and output responses, a modified form of the input-process output model (Fig. 1) proposed by Choi, Kaeber- nick, and Lai (1997) was employed. The inputs of the process include the process parameters (peak current, voltage, pulse duration, flush- ing pressure, etc.), materials (work, tool and dielectric) and electrical energy. The outputs are the material removal rate, tool wear rate, air emissions, dielectric wasted in the form of liquid, eroded work and tool materials, heat and noise.
Occupational exposure to toxic aerosols is an important haz- ard potential of the process particularly when hydrocarbon dielectric fluid is used. The aerosol generated from the process may consist of metallic particles and reaction products of the dielectric material. Mass concentration of respirable particulates in the breathing zone of the operator was considered as a factor in the study. Generally this value is used as a measure of risk in similar processes.
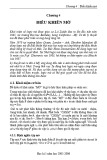
Organizations implementing green manufacturing for the EDM process should consider two types of attributes: manufacturing and environmental. Each attribute is related to several output parameters. Fig. 2 illustrates the proposed analytical decision mak- ing model for parameter optimization in green EDM. In this model two responses were considered under manufacturing aspects and three responses were considered under environmental aspects. The following discussion is concerning the output responses as- sessed in this work.
2.5. Dielectric consumption
2.1. Process time
During the EDM process, the dielectric fluid is generally wasted
through three paths (Yeo, Tan, & New, 1998):
Material removal rate is the most important machining param- eter in the EDM process. This parameter determines the machining
(i) Coating of the dielectric fluid on the work piece. (ii) Coating of the dielectric fluid on materials removed from
both the work piece and tool.
(iii) Vapor of
the dielectric diffused into the surrounding
environment.
Fig. 2. Decision making model for green EDM.
The dielectric consumed during the process has economical and environmental impacts. The wasted dielectric in the form of gas and liquid may cause problems to the operators as well as the environment. In the present investigation the mass of dielectric consumed per unit material removal was considered as a factor.
Fig. 1. Input-process-output diagram of EDM process.
3. Materials and methods
where fd, fi, V, and I are the duty factor, jump factor, gap voltage and peak current, respectively.
3.1. Determination of output parameters
The volume of dielectric in the dielectric sump was measured before and after machining and the dielectric consumed for remov- ing 1 mg of material (Dc) was calculated as follows:
ð7Þ
Dc ¼
steel plate of
Da (cid:3) Db tm (cid:2) MRR
where Da and Db are the volume of dielectric in the sump (cm3), be- fore and after machining and tm is the machining time.
The experiments were conducted on a conventional die sinking electric discharge machine manufactured by Victory Electromech. size A high carbon high chromium tool 4 cm (cid:2) 4 cm (cid:2) 1.5 cm was used as the work piece and a copper rod of diameter 25 mm was used as the tool. Commercially avail- able kerosene was used as the dielectric fluid and side flushing was opted. Kerosene is a blend of hydrocarbons (C12–C15) which is widely used in EDM because of its high flash point, good dielec- tric strength, low viscosity and low specific gravity. The open gap voltage was kept constant at 100 V. Duty factor was kept at 0.5. During the machining, the tool ‘jumped’ periodically to a height of 1.25 mm to clean the gap between the work piece and tool. The machining was interrupted at each jump. The jump duty cycle (ratio of machining time to the total time) was kept at 0.75.
The peak current (I), pulse duration (tp), dielectric level (l) and flushing pressure (p) were the independent variables studied to analyze the following responses; process time, relative tool wear ratio, process energy, breathing zone concentration of the particu- lates and dielectric consumption. In this study L9 (34) orthogonal array was selected to conduct experimental runs. The process vari- ables and their levels for the design used in this study are shown in Table 1. The design of experiment matrix and experimental results are presented in Table 2.
3.2. Optimization using fuzzy TOPSIS
In this paper important weights of the output responses were assigned linguistic variables as shown in Table 3. The linguistic variables were described using triangular fuzzy numbers. Four ex- perts form a committee to act as decision makers. Each decision maker rated each attributes weight with respect to linguistic term. The results are presented in Table 4 and aggregated fuzzy weight of each output parameters are shown in Table 5.
The optimization was done using the normalized performance matrix. The normalized performance matrix was obtained using the following transformation equation:
Aerosol in the process location was sampled using a Universal Air Sampler (SKC model No. 224-PCXR8) with cyclone attachment. The cyclone attachment was used to separate particles of size 5 lm and above which are not respirable. A PVC filter of diameter 37 mm was used as the sampling medium. Samples of the aerosol were taken at a sampling point of 200 mm vertical distance and 200 mm horizontal distance from the dielectric surface above the process location. This location was assumed to correspond to an operators breathing zone in the worst case. The velocity of the sampler was kept at 2.5 l/min and the sampling was done for a duration of 8 h. The sampler was calibrated before and after sampling using a soap bubble meter, with the sampling medium in line. The weight of the filter paper was mea- sured before and after sampling using a sensitive balance (accuracy ±0.01 mg). The concentration of aerosols (CA) in the work atmo- sphere was calculated from the following equation:
ð8Þ
rij ¼
q
ð1Þ
CA ¼
xij ffiffiffiffiffiffiffiffiffiffiffiffiffiffiffiP9 i¼1x2
ij
ðW fb (cid:3) W faÞ (cid:2) 1000 ts (cid:2) v
where Wfa and Wfb are the weights of filter paper in mg, before and after sampling, ts is the sampling duration in minutes and v is sam- pling speed in l/min.
where xij represents the actual value of ith attribute of jth experi- mental run and rij represents the corresponding normalized value. The normalized performance matrix was then multiplied by weights associated with each attribute thus yielding the weighted performance matrix S. The positive ideal value set, S+, and the neg- ative ideal value set, S(cid:3), were then determined as follows:
The material removal rate (MRR) and the tool wear rate (TWR) were calculated by taking the weights of the work piece and tool before and after the experiment
Sþ ¼ f½maxðsijÞjj 2 J(cid:4) or
½minðsijÞjj 2 J0(cid:4); i ¼ 1; 2; . . . ; 9g
MRR ¼
ð2Þ
ðW Wa (cid:3) W WbÞ tm
¼ fsþ
ð9Þ
1 ; sþ
2 ; . . . sþ 5 g
S(cid:3) ¼ f½minðsijÞjj 2 J(cid:4) or
½maxðsijÞjj 2 J0(cid:4); i ¼ 1; 2; . . . ; 9g
where WWa and WWb are the weights of workpiece in mg, before and after machining and tm is the machining time
¼ fs(cid:3)
ð10Þ
1 ; s(cid:3)
2 ; . . . s(cid:3) 5 g
TWR ¼
ð3Þ
ðW Ta (cid:3) W TbÞ tm
where
were WTa and WTb are the weights of tool in mg, before and after machining and tm is the machining time.
J = {j = 1, 2, . . . , 5|j}: Associated with higher the better perfor- mance parameters. J0 = {j = 1, 2, . . . , 5|j}: Associated with lower the better perfor- mance parameters.
Process time (T) is the time taken in seconds to remove 1 mg of material. This factor was calculated using the equation shown below
All the performance parameters considered in this study were of lower the better type. According to the weighted normalized
ð4Þ
T ¼
60 MRR
Relative tool wear ratio is the ratio of TWR and MRR
8372 S.P. Sivapirakasam et al. / Expert Systems with Applications 38 (2011) 8370–8374
RTWR ¼
ð5Þ
TWR MRR
Process energy (E) is the energy in Watts used to remove 1 mg
of material. This was calculated using the following equation:
Table 1 Input parameters and their levels. Parameters Unit Level 1 Level 2 Level 3 4.5
ð6Þ
E ¼ fd (cid:2) fj (cid:2) V (cid:2) I (cid:2) T
2 2 40 261 60 7 520 80 Current Pulse duration Dielectric level Flushing pressure A ls mm kg/cm2 0.3 0.5 0.7
8373 S.P. Sivapirakasam et al. / Expert Systems with Applications 38 (2011) 8370–8374
Table 2 Experimental results. Input parameters Output parameters Sl. No. REWR Dielectric level (mm) Flushing pressure (kg/cm2) Process time (s) Process energy (W) Conc. of aerosol (mg/m3) Dielectric consumption (cm3) Peak current (A) Pulse duration (ls)
54.433 115.178 122.951 79.389 57.620 66.516 106.632
1 2 3 4 5 6 7 8 9 2 2 2 4.5 4.5 4.5 7 7 7 2 261 520 2 261 520 2 261 520 40 60 80 60 80 40 80 40 60 0.3 0.5 0.7 0.7 0.3 0.5 0.5 0.7 0.3 0.7258 1.5357 1.6393 0.4705 0.3415 0.3942 0.4062 0.2381 0.2646 0.3899 0.0055 0.0051 0.3496 0.0041 0.0049 0.3452 0.0065 0.0076 62.4884 69.469 0.82 0.77 0.64 1.22 2.13 1.98 2.4 4.12 5.05 0.0665 0.0981 0.0865 0.051 0.0332 0.0394 0.0497 0.0351 0.0434
The proximity of a particular experimental run to the ideal solu- tion is expressed using the closeness coefficient (CCi) which was calculated as
ð14Þ
CCi ¼
d(cid:3) i i þ d(cid:3) dþ
i
4. Results and discussion
Table 3 Linguistic variables for the importance weight of each output criterion. Importance Abbreviation Fuzzy weight
Extremely low Very low Low Medium High Very high Extremely high (0, 0, 0.1) (0, 0.1, 0.3) (0.1, 0.3, 0.5) (0.3, 0.5, 0.7) (0.5, 0.7, 0.9) (0.7, 0.9, 1) (0.9, 1, 1) EL VL L M H VH EH
Table 4 Importance of output responses. Output response Decision maker DM1 DM2 DM3 DM4
The closeness coefficients for each experiment of the L9 orthogo- nal array were calculated as discussed in the previous section (Ta- ble 6). According to the performed experiment design, it could be clearly observed from Table 6 that the EDM parameters setting of experiment No. 5 yielded the highest closeness coefficient. There- fore, experiment No. 5 had the optimal machining parameters set- ting for the desirable output responses simultaneously (i.e. the best multi-performance characteristics) among the nine experi- ments. The response table for the Taguchi method was used to calcu- late the closeness coefficient for each level of the input parameters. The procedure is: (i) group the closeness coefficients by factor level for each column in the orthogonal array and (ii) take the average of them.
H VL M VH H Process time REWR Process energy Concentration of aerosol Dielectric consumption H L H EH H VH L M VH M H VL L VH H
The closeness coefficient values for each level of process param- eters are shown in Table 7. Regardless of the category of performance characteristics, a greater closeness coefficient value corresponds to better performance. Therefore, the optimal level of the machining
Table 5 Fuzzy weights. Output parameter Fuzzy weight
fuzzy decision matrix, the elements sij were normalized positive triangular fuzzy numbers and their ranges belong to the closed interval [0; 1].
The distance of each experimental result from positive and neg- solutions were calculated using the following
ative ideal equations:
5 X
Table 6 Closeness coefficients. Process time REWR Process energy Concentration of aerosol Dielectric consumption 0.55, 0.75, 0.925 0.05, 0.2, 0.4 0.35, 0.5, 0.7 0.75, 0.925, 1 0.45, 0.65, 0.85 Dielectric level (mm) Closeness coef. Sl. No. Current (A) Flushing pressure (kg/ cm2) Pulse duration (ls)
i ¼ 1; 2; . . . ; 9
ð11Þ
dðsij; sþ
dþ i ¼
j Þ;
i¼1
5 X
i ¼ 1; 2; . . . ; 9
ð12Þ
dðsij; s(cid:3)
d(cid:3) i ¼
j Þ;
1 2 3 4 5 6 7 8 9 2 2 2 4.5 4.5 4.5 7 7 7 2 261 520 2 261 520 2 261 520 40 60 80 60 80 40 80 40 60 0.3 0.5 0.7 0.7 0.3 0.5 0.5 0.7 0.3 0.694042 0.47655 0.484248 0.7304 0.857285 0.830036 0.617257 0.709666 0.600028
i¼1
where d(x, y) is the distance measurement between two fuzzy num- bers. This distance between two triangular fuzzy numbers was cal- culated using the following equation:
r
dðx; yÞ ¼
ð13Þ
Table 7 Response table for closeness coefficient. Input parameter Average closeness coefficient Max–min Level 1 Level 2 Level 3
ffiffiffiffiffiffiffiffiffiffiffiffiffiffiffiffiffiffiffiffiffiffiffiffiffiffiffiffiffiffiffiffiffiffiffiffiffiffiffiffiffiffiffiffiffiffiffiffiffiffiffiffiffiffiffiffiffiffiffiffiffiffiffiffiffiffiffiffiffiffiffiffiffiffiffiffiffiffiffiffi 1 ½ðx1 (cid:3) y1Þ2 þ ðx2 (cid:3) y2Þ2 þ ðx3 (cid:3) y3Þ2(cid:4) 3
Peak current Pulse duration Dielectric level Flushing pressure 0.5516 0.6806 0.7446 0.7171 0.8059 0.6812 0.6023 0.7236 0.6423 0.6381 0.6529 0.6414 0.2543 0.0431 0.1423 0.0822
Acknowledgements
The authors are grateful to the Director, NIT Tiruchirappalli for his continuing encouragement and support for this work. Part of the work is supported by the Ministry of Environment and Forests, Government of India (F.No. 19/102/2008-RE).
References
8374 S.P. Sivapirakasam et al. / Expert Systems with Applications 38 (2011) 8370–8374
Abbas, N. M., Solomon, D. G., & Bahari, M. F. (2007). A review on current research trends in electrical discharge machining (EDM). International Journal of Machine Tools & Manufacture, 47, 1214–1228. Aiello, G., Enea, M., Galante, G., & Scalia, G.
La. (2009). Clean agent selection approached by fuzzy TOPSIS decision-making method. Fire Technology, 45, 405–418. Bortolan, G., & Degami, R. (1985). A review of some methods for ranking fuzzy subset. Fuzzy Sets and Systems, 15(1), 1–19.
Choi, A. C. K., Kaebernick, H., & Lai, W. H. (1997). Manufacturing process modeling for environmental impact assessment. Journal of Material Processing Technology, 70, 231–238.
parameters was the level with the greatest closeness coefficient va- lue. Based on the closeness coefficient values given in Table 7, the optimal machining performance for the green EDM was obtained for 4.5A peak current (level 2), 261 lm pulse duration (level 2), 40 mm dielectric level (level 1) and 0.5 kg/cm2 flushing pressure (le- vel 2). As listed in Table 7, the difference between the maximum and the minimum value of the closeness coefficient of the EDM parame- ters was as follow: 0.2543 for peak current, 0.0431 for pulse dura- tion, 0.1423 for dielectric level and 0.0822 for flushing pressure. The most effective factor affecting performance characteristics was determined by comparing these values. This comparison demon- strated the level of significance of the input parameters over the multi-performance characteristics. The most effective controllable factor was the maximum of these values. Here, the maximum value was 0.2543. This value indicated that the peak current had the stron- gest effect on the multi-performance characteristics among the in- put parameters. The order of importance of the controllable factors to the multi-performance characteristics in the EDM process, in se- quence can be listed as follows: peak current, dielectric level, flush- ing pressure and pulse duration.
Deng, J. L. (1989). Introduction to grey system. Journal of Grey Systems, 1(1), 1–24. Hwang, C. L., & Yoon, K. (1981). Multiple attribute decision making, a state of the art survey. New York: Springer-Verlag.
5. Conclusions
Kuo, T. C., Chang, S. H., & Huang, S. H. (2006). Environmentally conscious design by using fuzzy multi attribute decision making. International Journal of Advanced Manufacturing Technology, 29, 419–425.
Saaty, T. L. (1980). The analytic hierarchy process. New York: McGraw-Hill. Sheng, P., & Srinivasan, M.
(1995). Multi-objective process planning in environmentally conscious manufacturing: A feature-based approach. Annals of the CIRP, 44(1), 433–437.
Tan, X. C., Liu, F., Cao, H. J., & Zhang, H. (2002). A decision making framework model of cutting fluid selection for green manufacturing and a case study. Journal of Materials Processing Technology, 129, 467–470.
Tesfamariam, S., & Sadiq, R. (2006). Risk based environmental decision-making using fuzzy analytic hierarchy process (F-AHP). Stochastic Environmental Research and Risk Assessment, 21, 35–50.
The present work proposed a combination of Taguchi method and TOPSIS to solve the multi-response parameter optimization problem in green electrical discharge machining. An analytical structure was developed to perform multi-criteria decision mak- ing. The responses were ranked based on the scores obtained by the summarization of final global preference weights. Triangular fuzzy numbers were used to assign preference values to the output responses.
Tong, L. I., Chen, C. C., & Wang, C. H. (2007). Optimization of multi-response Journal of Advanced International processes using the VIKOR method. Manufacturing Technology, 31, 1049–1057.
Tong, L. I., & Su, C. T. (1997). Optimizing multi-response problems in the Taguchi method by fuzzy multiple attribute decision making. Quality and Reliability Engineering International, 13, 25–34.
The optimum factor level combinations were identified based on the closeness coefficient values. The optimal machining perfor- mance for the green EDM was obtained for 4.5 A peak current (le- vel 2), 261 lm pulse duration (level 2), 40 mm dielectric level (level 1) and 0.5 kg/cm2 flushing pressure (level 2). From analysis of the closeness coefficients, it was identified that the peak current was the most influential parameter in multi-performance charac- teristics used in this study.
Tonshoff, H. K., Egger, R., & Klocke, F. (1996). Environmental and safety aspects of electrophysical and electrochemical processes. Annals of CIRP: Manufacturing Technology, 45(2), 553–568. Yeo, S. H., & New, A. K. (1999). A method for green process planning in EDM. International Journal of Advanced Manufacturing Technology, 15, 287–291.
The computational and experimental effort needed to optimize these parameters was rather small. It was illustrated that the method was efficient and effective for multi-attribute decision making problems in green manufacturing.
Yeo, S. H., Tan, H. C., & New, A. K. (1998). Assessment of waste streams in electric discharge machining for environmental impact analysis. Proceedings of the Institution of Mechanical Engineers, Part B: Journal of Engineering Manufacture, 212, 393–401. Zadeh, L. A. (1965). Fuzzy sets. Information and Control, 8(3), 338–353.


%20--%3e%3cdefs%3e%3cstyle%3e%20.st0%20{%20fill:%20%23fff;%20}%20.st1%20{%20fill:%20%237800fa;%20}%20%3c/style%3e%3c/defs%3e%3cpath%20class='st1'%20d='M117.78,12.18H43.11c2.9,3.47,4.65,7.94,4.65,12.82,0,5.6-2.3,10.66-6.01,14.29h76.02l7.22-13.56-7.22-13.56Z'/%3e%3cg%3e%3cpath%20class='st0'%20d='M53.58,26.17h-.59v-1.46h.59v-4.96h2.83c1.78,0,2.67.94,2.67,2.82v5.76c0,1.87-.89,2.81-2.67,2.81h-2.83v-4.96ZM55.36,21.37v3.34h1.1v1.46h-1.1v3.34h1.01c.61,0,.91-.37.91-1.1v-5.93c0-.74-.3-1.1-.91-1.1h-1.01Z'/%3e%3cpath%20class='st0'%20d='M65.99,31.14h-1.8l-.31-2.07h-2.19l-.31,2.07h-1.64l1.82-11.39h2.62l1.82,11.39ZM65.28,18.04c-.25.46-.51.77-.75.94-.21.15-.47.22-.79.22-.26,0-.57-.07-.92-.22l-.38-.15c-.14-.05-.26-.07-.37-.07-.3,0-.53.18-.71.54l-.91-.68c.25-.46.51-.77.75-.94.21-.14.48-.21.79-.21.26,0,.57.07.92.21l.38.15c.14.05.26.07.37.07.3,0,.53-.18.71-.54l.91.68ZM61.91,27.52h1.73l-.87-5.76-.87,5.76Z'/%3e%3cpath%20class='st0'%20d='M74.53,26.89v1.52c0,1.91-.89,2.86-2.67,2.86s-2.67-.95-2.67-2.86v-5.93c0-1.91.89-2.86,2.67-2.86s2.67.95,2.67,2.86v1.11h-1.69v-1.22c0-.75-.31-1.12-.93-1.12s-.93.37-.93,1.12v6.15c0,.74.31,1.11.93,1.11s.93-.37.93-1.11v-1.63h1.69Z'/%3e%3cpath%20class='st0'%20d='M81.4,31.14h-1.8l-.31-2.07h-2.19l-.31,2.07h-1.64l1.82-11.39h2.62l1.82,11.39ZM75.9,19.2l1.52-1.91h1.71l1.51,1.91h-1.61l-.76-.95-.75.95h-1.61ZM77.32,27.52h1.73l-.87-5.76-.87,5.76ZM83.1,15.99l-1.76,1.91h-1.26l1.17-1.91h1.86Z'/%3e%3cpath%20class='st0'%20d='M84.86,19.75c1.78,0,2.67.94,2.67,2.82v1.48c0,1.87-.89,2.81-2.67,2.81h-.85v4.28h-1.79v-11.39h2.64ZM84.01,21.37v3.86h.85c.58,0,.87-.36.87-1.08v-1.71c0-.71-.29-1.07-.87-1.07h-.85Z'/%3e%3cpath%20class='st0'%20d='M93.51,19.75c1.78,0,2.67.94,2.67,2.82v1.48c0,1.87-.89,2.81-2.67,2.81h-.85v4.28h-1.79v-11.39h2.64ZM92.66,21.37v3.86h.85c.58,0,.87-.36.87-1.08v-1.71c0-.71-.29-1.07-.87-1.07h-.85Z'/%3e%3cpath%20class='st0'%20d='M98.8,31.14h-1.79v-11.39h1.79v4.88h2.03v-4.88h1.83v11.39h-1.83v-4.88h-2.03v4.88Z'/%3e%3cpath%20class='st0'%20d='M105.36,24.55h2.46v1.62h-2.46v3.34h3.09v1.63h-4.88v-11.39h4.88v1.63h-3.09v3.18ZM108.17,17.29l-1.76,1.91h-1.26l1.17-1.91h1.86Z'/%3e%3cpath%20class='st0'%20d='M112.2,19.75c1.78,0,2.67.94,2.67,2.82v1.48c0,1.87-.89,2.81-2.67,2.81h-.85v4.28h-1.79v-11.39h2.64ZM111.35,21.37v3.86h.85c.58,0,.87-.36.87-1.08v-1.71c0-.71-.29-1.07-.87-1.07h-.85Z'/%3e%3c/g%3e%3ccircle%20class='st1'%20cx='25'%20cy='25'%20r='20'/%3e%3cpath%20class='st0'%20d='M32.78,19.27c2.92,0,4.43,2.55,5.28,5.33l.71,2.17c.14.38-.33.75-.71.75h-5.61c.19-.33.24-.71.09-1.08l-.75-2.45c-.43-1.32-.99-2.64-1.79-3.77.75-.57,1.65-.94,2.78-.94h0ZM25,18.38c3.25,0,4.9,2.78,5.89,5.89l.76,2.45c.14.42-.33.8-.8.8h-11.69c-.42,0-.94-.38-.8-.8l.75-2.45c.99-3.11,2.64-5.89,5.89-5.89h0ZM25,11.35c1.74,0,3.11,1.37,3.11,3.11s-1.37,3.11-3.11,3.11-3.11-1.41-3.11-3.11,1.41-3.11,3.11-3.11h0ZM17.27,19.27c1.08,0,1.98.38,2.73.94-.8,1.13-1.37,2.45-1.74,3.77l-.8,2.45c-.14.38-.05.75.09,1.08h-5.56c-.42,0-.9-.38-.75-.75l.71-2.17c.9-2.78,2.41-5.33,5.33-5.33h0ZM17.27,12.91c1.51,0,2.78,1.27,2.78,2.83s-1.27,2.83-2.78,2.83-2.83-1.27-2.83-2.83,1.27-2.83,2.83-2.83h0ZM32.78,12.91c1.56,0,2.78,1.27,2.78,2.83s-1.23,2.83-2.78,2.83-2.83-1.27-2.83-2.83,1.27-2.83,2.83-2.83h0ZM27.07,28.56v.09c0,.57-.24,1.08-.61,1.46h0v.05c-.38.33-.9.57-1.46.57s-1.08-.24-1.46-.61h0c-.38-.38-.61-.9-.61-1.46v-.09h1.41v.09c0,.19.05.38.19.47v.05c.09.09.28.19.47.19s.38-.09.47-.19v-.05c.14-.09.24-.28.24-.47t-.05-.09h1.41ZM30.99,28.56v.09c0,1.65-.66,3.16-1.74,4.24-1.08,1.08-2.59,1.79-4.24,1.79s-3.16-.71-4.24-1.79l-.05-.05c-1.04-1.08-1.7-2.55-1.7-4.2v-.09h1.41v.09c0,1.27.47,2.4,1.27,3.25h.05c.85.85,1.98,1.37,3.25,1.37s2.4-.52,3.25-1.37c.85-.8,1.37-1.98,1.37-3.25v-.09h1.37ZM34.99,28.56v.09c0,2.78-1.13,5.28-2.92,7.07-1.79,1.79-4.29,2.92-7.07,2.92s-5.23-1.13-7.07-2.92c-1.79-1.79-2.92-4.29-2.92-7.07v-.09h1.41v.09c0,2.4.94,4.53,2.5,6.08,1.56,1.56,3.72,2.5,6.08,2.5s4.52-.94,6.08-2.5c1.56-1.56,2.5-3.68,2.5-6.08v-.09h1.41Z'/%3e%3c/svg%3e)