ISSN: 2615-9740
JOURNAL OF TECHNICAL EDUCATION SCIENCE
Ho Chi Minh City University of Technology and Education
Website: https://jte.edu.vn
Email: jte@hcmute.edu.vn
JTE, Volume 19, Issue 03, 2024
40
Changes in Nutritional and Sensory Qualities of Cookies Supplemented with
Macadamia Oil Cake
Hoang Van Chuyen*, Thanh Ngan Nguyen
Ho Chi Minh City University of Technology and Education, Vietnam
*Corresponding author. Email: chuyenhv@hcmute.edu.vn
ARTICLE INFO
ABSTRACT
Received:
10/05/2024
The objective of this study was to investigate effect of the addition with
different ratios Macadamia oil cake (MOC) on physical properties (color
and texture), nutritional composition (moisture content, protein content, fat
content, fiber and energy value) and sensory quality of cookies were
investigated. The addition of MOC results in the increases of protein, ash
and fat content, while carbohydrate content, by contrast, decreased in the
cookies. Regarding the physical properties, the thickness and breaking
strength of cookies showed significant differences between the fortified
samples and the control while diameter, and spread ratio did not reveal any
variations. For the sensory quality, score of color, flavor, texture, taste,
except overall acceptability of fortified cookies witnessed a significant
difference (p<0,05). The microbiological analyses also confirmed that the
fortified cookies satisfy the microbial safety standards. Based on the
observed results, the addition with 15% of MOC is recommended for
developing cookie products to improve nutritional and sensory qualities
The nutritional analysis of the cookies supplemented with 15% macadamia
oil cake confirmed that product contains 9.96g protein, 26.50g fat, 55.80g
carbohydrate, 3.08g dietary fiber and an estimated energy of 501.58 kcal
in each 100 grams.
Revised:
04/06/2024
Accepted:
05/06/2024
Published:
28/06/2024
KEYWORDS
Macadamia oil cake;
Cookies;
Nutritional quality;
Sensory quality;
Physical properties.
Doi: https://doi.org/10.54644/jte.2024.1595
Copyright © JTE. This is an open access article distributed under the terms and conditions of the Creative Commons Attribution-NonCommercial 4.0
International License which permits unrestricted use, distribution, and reproduction in any medium for non-commercial purpose, provided the original work is
properly cited.
1. Introduction
Macadamia oil cake (MOC) is a by-product of macadamia oil production. Because of their high
nutritional value, especially protein content (15% to 50%), the seed and nut cakes are commonly
utilized as cattle feedstuffs [1]. In addition to the potential nutritional value, the macadamia oil cake
can also produce typically attractive flavors so it is suggested to be used as an ingredient to improve
sensory quality of food products [2].
MOC was found to contain 24.5% crude protein [3]. MOC crude fiber was also reported to reach the
amount of 24.9% [4]. Macadamia oil cake has been successfully studied and applied as an alternative
protein source for poultries and ruminants. A study determining the effects of different dietary
inclusion levels of MOC showed that he MOC addition positively affected on the growth performance
and carcass characteristics of growing lambs [5]. In addition, other studies also reported promising
results in the replacement of corn, soymeal, wheat with macadamia oil cake in feedstuff.
Macadamia oil cake was reported to be high in fiber, rich in essential nutrients, high lipid residue and
positive role of fiber in gut health [6]. Those studies’ research subjects are feedstuffs while macadamia
oil cake is a potential nutrient source to apply in human foods. These sources can be used to make bakery
products such as cake, cookie, bread, etc. Thus, this research focused on producing macadamia oil cake
supplemented cookies in order to improve the nutritional and sensory qualities of the products.
2. Material and Methods
2.1. Material
The macadamia oil cake obtained from the cold pressing process was provided by Damaca Nguyen
Phuong JSC (No 12 Loc Xuan village, Phu Loc commune, Krong Nang district, Dak Lak province. The

ISSN: 2615-9740
JOURNAL OF TECHNICAL EDUCATION SCIENCE
Ho Chi Minh City University of Technology and Education
Website: https://jte.edu.vn
Email: jte@hcmute.edu.vn
JTE, Volume 19, Issue 03, 2024
41
oil cake was ground and sieved to obtain powder with the size less than 0.25mm. The powder was then
preserved at -18℃ until used for the experiments.
2.2. Methods
2.2.1. Preparation of cookies supplemented with macadamia oil cake
The formulations of the cookie samples are presented in Table 1.
Table 1. Composition of cookies
Ingredients
Formulation
M0
M15
M20
M25
Wheat flour (g)
100
100
100
100
Sugar powder (g)
55
55
55
55
Butter (g)
55
55
55
55
Milk powder (g)
7
7
7
7
Baking powder(g)
0.4
0.4
0.4
0.4
Salt (g)
1
1
1
1
Egg (g)
50
50
50
50
Macadamia oil cake (g)
0
15
20
25
Water (ml)
10
13
15
25
Butter and sugar were mixed well until the color turns lighter in a bowl before all other ingredients
are added. The mixing process was continued until becoming consistent. The mixture was set the in 10
minutes at room temperature then the dough was spread on a flat tray covered by non-stick paper, and
flattened by a rolling pin to the thickness of 0.5cm. A cookie cutter was used to cut dough sheet into
circular shape. Put circular cut dough onto a tray covered by baking paper.
The cookies were then baked in an oven which was pre-heated at 190℃ in 15 minutes. The baked
cookies then removed from the oven and leaved on a cooling rack until reaching room temperature
before being packed in an air-tight zipper bag with desiccant bags inside and stored in a dry, cool place,
avoiding sunlight.
2.2.2. Evaluation of physical parameters
- Moisture content: Moisture content of samples was determined by using a hot-air oven according
to Method 44-15.02 (AACC, 2000) at 105°C until reaching constant weight.
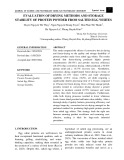
- Size of cookies: Vernier calipers were used to determine the thickness and diameter of cookies
according to AACC (2000).
Figure 1. Demonstration of diameter measuring (left) and thickness measuring (right)
- Spread ratio: Spread ratio of cookies was calculated by the ratio of the diameter to the thickness of
cookies.
ISSN: 2615-9740
JOURNAL OF TECHNICAL EDUCATION SCIENCE
Ho Chi Minh City University of Technology and Education
Website: https://jte.edu.vn
Email: jte@hcmute.edu.vn
JTE, Volume 19, Issue 03, 2024
42
- Specific volume: Each bread was weighed and then measured for volume using a rapeseed
displacement volume-meter. Specific volume (cm3/g) was calculated as the ratio of the volume (cm3)
and the mass of the samples (g) following the AACC Approved Method 10-05.01 (AACC, 2000).
- Texture analysis: The hardness and crispiness of the samples were analyzed using a texture analyzer
(CT3, Brookfield Ametek Inc., MA, USA). Each cookie was compressed by a probe and forced to be
broken. The maximum force which a sample could bear just before breaking was recorded. The peak
force and the slope can estimate hardness and crispiness of cookies [7].
2.2.3. Color analysis
Color values (L*, a* and b*) of the cookies were determined using a colorimeter (CR-400, Konica
Minolta, USA). The color difference between a sample with the control sample was calculated as
following equation [8]:
Where
L*, a*, b* are the color values of investigated samples;
L*0, a*0, b*0 are the color values of control sample.
2.2.4. Nutritional composition
- Total crude protein was determined according to AACC 46-10.01 using Kjeldahl method.
- Total ash content was determined according to AACC 08-01.01 standard using an oven at
temperature of 600℃ in 6 hours,
- Crude fat was determined according to AACC 30-25.01 using a Soxhlet extractor with petroleum
ether as the solvent.
- Total carbohydrate was determined according to FAO (2019) [9] using the following equation:
- Energy value of samples was calculated based on method of FAO (2019) [9] using the following
equation:
1g protein: 4kcal energy
1g fat: 9kcal energy
1g carbohydrate: 4 kcal energy
- Other nutritional components such as dietary fiber, mineral content and microbiological criteria
were analyzed at Eurofins Hai Dang food testing laboratories (Lot E2b-3, Street D6, Saigon Hightech
Park, Tan Phu Ward, District 9, Ho Chi Minh City, Vietnam).
2.2.5. Sensory evaluation
The sensory test was conducted in a form of survey of “9-point hedonic scale”. The coded samples
were served to 20 random selected judges. The judges were asked to score the cookies samples for
color, shape, texture, sweetness, flavor, mouth feel and overall acceptability. The overall
acceptability of cookies was evaluated using 9-point hedonic scale ranging from (1, dislike very much
to 9, like very much) [7].
2.2.6. Statistical analysis
Each experiment was repeated three times, and the experimental results were presented as the mean
± standard deviation. To analyze differences between the means, an analysis of variance (ANOVA) was
performed, followed by the least significant difference (LSD) with p <0.05.

ISSN: 2615-9740
JOURNAL OF TECHNICAL EDUCATION SCIENCE
Ho Chi Minh City University of Technology and Education
Website: https://jte.edu.vn
Email: jte@hcmute.edu.vn
JTE, Volume 19, Issue 03, 2024
43
3. Results and Discussion
3.1. Chemical composition of Macadamia oil cake (MOC) powder
MOC is the residue of the manufacturing oil from macadamia nuts, but the nutrients left in oil cake
can be utilized to make foods. For example, in the research of Acheampong-Boateng et al. (2008), the
crude protein content of MOC was 19.5%, the crude fat content was 10.4%, the ash content was 2.8%,
the crude fiber content was 24.9%, the calcium and phosphorus content were respectively 0.24% and
0.29% [4]. Normally, MOC is mostly studied for using as animal feed [10]. The MOC in this research
has the protein content is higher than MOC in the research of Mikasi (2018) (14.7%) [11]. The fat of
30.40% in our research is also higher than that in the research (8.5%). The crude fiber content (0.93%)
in the research of Mikasi (2018) was much lower than this in our research (6.27%) [11]. In comparison
with a research by Rao et al. (2020), the ash content of this research is also higher (3.57% compared to
1.93%, respectively) [12].
3.2. Changes in nutritional composition of MOC cookies supplemented with different MOC ratios
The changes in content of moisture, ash, protein, lipid, carbohydrate contents and energy value of
cookies added with different ratios of MOC are shown in Table 2.
Table 2. Chemical composition of MOC cookies
Sample
Moisture
(%)
Ash
(%)
Protein
(%)
Fat
(%)
Carbohydrate
(%)
Energy value
(kcal)
M0
4.14±0.01a
3.20 ± 0.18a
8.66b±0.39b
23.10±0.17c
60.91±0.56a
486.15±1.15c
M15
3.88±0.25ab
3.84±0.37a
9.96a±0.34a
26.50±0.24b
55.80±0.66b
501.58±3.43b
M20
3.55±0.07bc
3.87±0.18a
10.20a±0.11a
27.41±0.11a
54.97±0.11b
507.38±1.06a
M25
3.21±0.28c
3.39±0.66a
10.04a±0.03a
27.60±0.09a
55.76±0.80b
511.61±3.81a
Values are mean ± SD of three replicates. Means of the same column followed by superscript letters are
significantly different (p<0.05)
It can be seen that there is a decreasing trend in the moisture content from M0 to M25, the range is
from 4.14 to 3.21. A research on lemongrass added cookies showed similar result when low water
absorption capacity of lemongrass powder is the reason of moisture content reduction [13]. According
to TCVN 5909:1995, the MOC fortified cookies’ moisture fit the cookie moisture requirement (below
4%). It was reported that the lower moisture content prevents cookies from microbial spoilage and
lengthen shelf life [14]. When Chandra et al. (2015) conducted an experiment on rice flour, green gram
flour and potato flour in different ratios, they found out moisture content of composite flours decreased
with lower proportions of wheat flour [15].
The ash is generally an indicator of the mineral contents present in foods [16]. In this experiment,
the ash content ranged from 3.20 to 3.87%. The highest ash content was found in M20 while the lowest
was M0 (the control sample). It can be explained that the increase of MOC level in composite flour goes
with the increase of ash content [13]. However, the ash content of 4 samples are insignificantly different
(p>0.05)
Protein is essential to human health; cookies could be potential carriers of proteins because they are
widely accepted by consumers. Wheat flour contains less protein than MOC do. It can be seen that
protein content present in cookie samples ranged from 8.66 to 10.20%, which shows an upward trend
with the increase of MOC level. With the increasing proportion of MOC and the protein content in
cookies, the carbohydrate content obviously decreased, which reduced from 60.91% to 55.71%. Similar
result was reported in a research of soya cookies [7].
The fat content in foods is linked with textural characteristics, water holding ability and provides
product a mechanism to distribute and transfer heat at high temperatures [17]. Wheat flour used in this
experiment has a fat content of 3.00% while MOC fat content stands at 30.40%. The fat content present
in cookies increase with the increase of MOC level. M25 was the sample contains the highest fat level

ISSN: 2615-9740
JOURNAL OF TECHNICAL EDUCATION SCIENCE
Ho Chi Minh City University of Technology and Education
Website: https://jte.edu.vn
Email: jte@hcmute.edu.vn
JTE, Volume 19, Issue 03, 2024
44
while the control sample M0 was the lowest at fat content. The similar result was found in a study by
Ghosha et al. (2020) when they conduct a research on soymeal cookies [7].
The energy value ranged from 486.16 to 511.61 kcal, the difference in energy value may come mostly
from fat content of MOC. A similar result was reported by Ndife et al. (2014) when they evaluated the
substitution of soymeal in cookies [18].
3.3. Effect of MOC addition on physical properties of cookies
The physical properties of cookies added with various amounts of MOC are shown in Table 3. The
diameter of control sample M0 was the largest, while the diameter of other samples decreased when the
level of added to cookies increased. This phenomenon can be explained by a research [19] which claimed
that there is inverse correlation between protein content and diameter of cookies. However, there is no
statistically significant difference in terms of the diameter of cookies (p>0.05).
Table 3. The data of physical properties of MOC fortified cookies
Sample
Diameter (mm)
Thickness (mm)
Spread ratio (D/T)
Breaking strength (g)
M0
49.62±0.45a
7.98±0.16a
6.22±0.06a
3007.8±128.1c
M15
49.02±0.20a
7.55±0.39b
6.51±0.36a
3096.5±45.3c
M20
46.36±1.03a
7.12±0.11c
6.51±0.06a
3278.2±112.4b
M25
44.68±1.07a
7.11±0.13c
6.28±0.08a
4006.5±50.6a
Values are mean ± SD of three replicates. Means of the same column followed by superscript letters are
significantly different (p<0.05)
The thickness of MOC cookies also showed a downward trend among samples. A statistically
significant difference can be seen in case of thickness of cookies (p<0.05). A similar result can be found
in a previous study [20], when thickness and diameter, spread ratio of bamboo powder fortified cookies
all decrease.
Spread ratio can be used as a quality indicator for cookies, higher spread ratio is desirable for better
cookies [21]. Spread ratio of control sample (M0) was the slowest, while the sample M15 and M20
almost had the similar spread ratio value (6.51), which was slightly higher than the control sample. Some
researches show the similar decrease in spread ratio when the non-wheat flour used for cookies is high
in fiber [14, 22, 23]. Overall, spread ratio of 4 different ratio cookies are insignificantly different
(p>0.05).
The hardness of the cookies is influenced by air space formation, gluten network, and other ingredients
present in flour composite, and especially the moisture content [24]. Breaking strength is a factor shows
that how cookies work when put in mouth and pressed by teeth. The moderate crackling strength and
crispy mouthfeel affect the consumers’ acceptability [25]. The breaking strength is the force required to
break the cookies, which increases from 3007.8 g Force to 4006.5 g Force with the increase of MOC
level, the similar result was reported in moringa leaves fortified cookies [26]. The breaking strength of 4
samples are significantly different (p<0.05).
3.4. Changes in color values of cookies added with different ratios of MOC
The color of the cookies surface is one of important factors besides texture and taste, to evaluate the
initial consumer acceptability of the products [27]. The color of the cookies' surface was produced during
baking and may have been caused by non-enzymatic browning (Maillard reactions) between reducing
sugars and amino acids, it may be the result of starch dextrinization and sugar caramelization.
The result of surface color of cookies was evaluated by CIE L*a*b* system and shown in the Table4.
As shown in the Table 4, L* value of the control sample (M0) was significantly different (p<0.05)
from fortified samples. An increase was observed for sample M15 while samples M20 and M25 showed
decreases in L* value compared to the control. This suggests that the color tends to be darker with higher
the added amount of MOC.