VIETNAM ACADEMY
MINISTRY OF EDUCATION AND TRAINING OF SCIENCE AND TECHNOLOGY
GRADUATE UNIVERSITY SCIENCE AND TECHNOLOGY
… … … …***… … … …
ĐINH CHI LINH
STUDY OF PHASE TRANSITION, MAGNETIC ORDER AND MAGNETOCALORIC EFFECT IN PEROVSKITE MATERIAL SYSTEM BASED ON La0,7A0,3MnO3 (A = Ca, Sr, Ba)
Major: ELECTRONIC MATERIAL
Code: 9.44.01.23
SUMMARY OF MATERIAL SCIENCE DOCTORAL THESIS
HA NOI 2021
The thesis was accomplished in: Graduated University of Science and Technology – Vietnam Academy of Science and Technology
Supervisor 1: Prof. Dr. Tran Đang Thanh
Supervisor 2: Prof. Dr. Le Viet Bau
Reviewer 1: …………………………………………..
Reviewer 2: …………………………………………..
Reviewer 3: …………………………………………..
The thesis will be defended in front of the Institute of Doctoral Dissertation Assessment Council, taking place at the Graduate University Science and Technology Vietnam Academy of Science and Technology
at ……………, ……………, 2021
The thesis can be found at:
Library of Graduate University of Science and Technology
Vietnam National Library
LIST OF WORKS HAS BEEN PUBLISHED
1.
, T. D. Thanh, L. H. Anh, V. D. Dao, H. Piao, and S. Yu, D. C. Linh “Nadoped La0.7Ca0.3MnO3 compounds exhibiting a large magnetocaloric effect near room temperature,” Physica B532 (2018) 155–160.
2.
, T. D. Thanh, L. H. Anh, V. D. Dao, H. Piao, and S. Yu, D. C. Linh “Critical properties around the ferromagneticparamagnetic phase transition in La0.7Ca0.3xAxMnO3 compounds (A = Sr, Ba and x = 0, 0.15, 0.3),” J. Alloys Compds. 725 (2017) 484–495.
3.
T. D. Thanh, D. C. Linh, N. T. Uyen Tuyen, T.L. Phan, and S.C. Yu, “Magnetic and magnetocaloric properties in Badoped La0.7Ca0.3MnO3 nanoparticles,” J. Alloys Compds. 649 (2015) 981–987.
4.
T. D. Thanh, D. C. Linh, H. T. Van, T. A. Ho, T. V Manh, L. V Bau, T. L. Phan, and S. C. Yu “Magnetocaloric effect in La0.7Ca0.25Ba0.05MnO3 nanocrystals exhibiting the crossover of first and secondorder magnetic phase transformation,” Mater. Tran. 56 (2015) 1316–1319.
5.
T. D. Thanh, D. C. Linh, T. V. Manh, T. A. Ho, T. L. Phan, and S. C. Yu, “Coexistence of short and longrange ferromagnetic order in La0.7Sr0.3Mn1xCoxO3 compounds,” J. Appl. Phys.117 (2015) 17C101.
6.
ườ ư
, N. T. Dung, L. V. Bau, N. V. Dang, T. D. Thanh, D. C. Linh “Influence of Badoped on magnetic and magnetocaloric properties ạ of La0.7Ca0.3xBaxMnO3 compounds”, TCKH Tr ng ĐH S Ph m ộ Hà N i 2, 57 (2018) 1222.
7.
nhi , L. V. Báu, and T. Đ. Thành, “Tính ch t t
ề ệ ủ ệ ấ ừ t c a h ớ 0.7A0.3MnO3 v i A là Ca, Sr và
ườ Đ. C. Linh ệ ậ v t li u perovskite n n mangan La ồ Ba,” TCKH Tr ng ĐH H ng Đ c, ứ 39 (2018) 99–109.
ủ
8.
i h n c a h , N. T. Dung, T. Đ. Thành, “Tính ch t t
ể ậ
ấ ớ ạ ộ ứ ố ầ ấ ắ ệ ậ
ệ Đ. C. Linh ị ậ La0,7Sr0,3Mn1xMxO3 (M = Co, Ni)”, Tuy n t p Báo cáo H i ngh V t ọ lý Ch t r n và Khoa h c V t li u Toàn qu c l n th 11, Quy Nh n, ơ Quy n 1ể (2019) 62.
6
INTRODUCTION
Magnetic materials with large magnetocaloric effects (MCE) have been widely studied experimentally and theoretically, not only because of their optimistic future for magnetic refrigeration applications but also for fundamental interest. The MCE manifests as an isothermal magnetic entropy change or an adiabatic temperature change when the magnetic material is exposed to a varying magnetic field. Magnetic refrigeration based on the MCE is advantageous being an energy efficient refrigeration mechanism and environment friendly, which is considered to be a significant future cooling technology. A large value of MCE is well thoughtout to be the most important requirement of the application, and therefore it is desirable to find new materials with large MCE, especially at low magnetic fields and with a wide temperature range. Perovskite manganites (denoted as manganites) with a generally chemical formula of R1xAxMnO3 (R is a rare earth and A is an alkali earth or alkali element) are known to exhibit a significant MCE and because of their good chemical stability and low manufacturing cost, they are considered good refrigerants in future nearroom temperature magnetic cooling devices....
≈ The magnetic and transport properties of maganites have been investigated since the 1950s. It was shown that the physical properties of materials will be changed by substitution of R3+ by a divalent ion. Changing the rate of substitution, the materials can be either FM or AFM, and insulating, semiconducting or even metallic. Basically, magnetic and electrical properties in manganites are frequently explained base on the double exchange (DE) mechanism, where electron transports from Mn3+ to Mn4+ via an oxygen ion. It has been shown that the magnetic and transport properties of R1xAxMnO3 are strongly affected by the MnO bond length and MnOMn bond angle controlled by the R/Asite ions radii and Mn3+/Mn4+ ratio which modifies the DE and the super exchange (SE) interactions. The reports also shown the colossal magnetoresistance (CMR) and the MCE in manganites can be easily tuned by doping some chemical elements into the sites of R (or A) and Mn. Among holedoped 0.3 (corresponding to manganites, the La1xAxMnO3 compounds with x
7
Mn3 +/Mn4+ = 7/3) usually show the strongest physical effects. However, it is well known that the DE and the SE interactions between Mn3+ and Mn4+ ions alone cannot explain all the behaviors observed in manganites. Thus, many studies suggest that it is rely on strong electronphonon interaction known as the JahnTeller effect, the average Resite cationic radius, and the oxygen deficiency, etc. However, the origin of the observed properties is still not fully understood. Among these, the magnetic interactions near the FMPM transition region are still a controversial issue and what universality class governs the FMPM transitions in the manganites. To better understand the nature of the magnetic interactions near the FMPM phase transition, it is important to study in detail the critical exponents associated with the FMPM transition.
Among the holedoped lanthanum manganites La1xAxMnO3, La0.7Ca0.3MnO3 (LCMO) material is known as a typical material exhibiting the CMR and MCE values larger than those obtained from the other manganites. For example, a CMR effect has been observed on La2/3Ca1/3MnO3 thin film with the value of magnetoresistance MR > 100000% at 77 K for H = 60 kOe and a maximum magnetic entropy change (|ΔSM|) of 5 J/kg.K under an applied magnetic field change ΔH = 10 kOe has been also observed for La0.7Ca0.3MnO3 polycrystalline. However, La0.7Ca0.3MnO3 in the polycrystalline and/or singlecrystal bulk sample has been found that its FMPM phase transition is followed up with structure changes, which is known as a FOPT. We know that the width of the FM PM transition region of the FOPT materials is very narrow. Additionally, the thermal/magnetic hysteretic in these materials is significant. These limit the applicability of the FOPT materials. To improve these restrictions, it is necessary to widen the FMPM transition region upon modifying the FOPT of La0.7Ca0.3MnO3 to a SOPT.
From the above mentioned problems, we choose the research topic: “Study of phase transition, magnetic order and magnetocaloric effect in perovskite material systems based on La0,7A0,3MnO3 (A = Ca, Sr, Ba)”.
Research objectives of the thesis
The thesis is implemented to achieve the following objectives: (i)
8
Clarification influence of the elements Na, Sr and Ba substituting for La/Ca and crystal size on the magnetic properties, phase transition and magnetocaloric effects of La0,7Ca0,3MnO3 materials; (ii) Found the materials for significant mmagnetocaloric parameters have potential for applications in magnetic refrigeration; (iii) Determine the effect of replacing Sr/Ba for Ca in La0,7Ca0,3MnO3 and Co substituting for Mn in La0,7Sr0,3MnO3 on their critical behavior as well as the ferromagnetic interactions order.
Research content of the thesis
(i) Fabricating samples material according to the thesis's objectives; (ii) Determined the Xray diffraction data as well as magnetic measurement data of the sample; (iii) Analyze experimental data, evaluate the results and write scientific reports; (iv) Synthesize the results obtained and write the thesis.
Research methods of the thesis
The thesis is done by a combination of experimental methods and theoretical comparison. About the experiment: (i) Fabrication of bulk materials by solid state reaction method; fabricating crystal nanoparticle materials by combining solid state reaction with high energy ball milling; (ii) Perform Xray diffraction measurements for material samples, thereby determining lattice parameters as well as factors related to crystal structure and size; (iii) Making measurements temperaturedependent magnetization at different magnetic fields M(T, H) and the magnetization depends on the magnetic field at different temperatures M(H, T), thereby determining the magnetic properties, magnetocaloric parameters and the set of critical exponents of materials.
For the theoretical comparison, based on the theoretical of critical phenomena, the critical behavior of material samples is assessed through their critical exponent. In addition, comparing these exponents with critical exponents of ferromagnetic models such as mean field theory (MFT), Heisenberg model, Ising model ... we predict the ferromagnetic interaction order and the change of this property according to the degree of
9
substitution of some elements in the materials.
CHAPTER 1. MAGNETOCALORIC EFFECT AND PEROVSKITE MAGANITE MATERIAL
1.1. Magnetocaloric effect
The magnetocaloric effect is defined as the change in the adiabatic temperature of magnetic materials as the external magnetic field apply on them changes.
In the case of ferromagnetic materials, they heatup as magnetized and cooldown as demagnetized. Basically, the MCE is directly related to the magnetic entropy change, ∆Sm(T, H), and the adiabatic temperature change, ΔTad(T, H). They are determined by the following equations:
∆Sm(T, H) = Sm(T, H) – Sm(T, 0) = (1.7)
(1.9)
In fact that, if using the magnetic materials for magnetic refrigeration application, another useful parameter is relative cooling power (RCP) defined by:
RCP = |ΔSM|×δTFWHM, (1.11)
where δTFWHM = T2 – T1 is the fullwidthathalf maximum of the ΔSm(T) curve and it corresponds to the amount of heat that can be transferred between the cold and hot parts of the refrigerator in an ideal thermodynamic cycle. 1.2. Perovskite manganite material
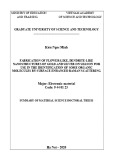
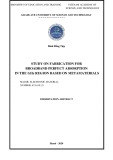
Fig.1.8. Illustration of the ideal ABO3 perovskite structure. Manganites crystallize in the various derivatives of the socalled perovskites structure named after the mineral perovskite, CaTiO3. Fig. 1.8 illustrates the ideal cubic perovskite structure, with the general formula ABO3. The structure may be conceived as a closepacked array formed of O2 anions and A cations with B cations located at the octahedral
10
interstitial sites. The BO6 octahedra make contact to each other by their vertices and form a threedimensional network. In holedoped lanthanum manganites the Asites of the perovskite structure are occupied by R3+ and, if x > 0, the substituted cations (Ca2+, Sr2+, etc.). The Bsites are occupied by Mn ions.
The manganites offers a degree of chemical exibility which permits the relation between the oxides’ structure, electronic and magnetic properties to be examined in a systematic way. Research on the manganite s has revealed new phenomena such as colossal and dense granular magnetoresistance, and has led to the formulation of important physical concepts such as double exchange and the Jahn Teller polaron. Early research was motivated by a need to develop insulating ferromagnets with a large magnetization for highfrequency applications . More recent work has been driven by a desire to understand and exploit the large negative magnetoresistance effects which appear near and below the Curie temperature. The manganites also have potential as solid electrolytes, catalysts, sensors and novel electronic materials. Their rich electronic phase diagrams reflect the fine balance of interactions which determine the electronic ground state. These compounds represent, in microcosm, the interplay of experiment, theory and application which is at the heart of solid state physics.
In the case of ferromagnetic manganites, Curie temperature can be tailored in a wide range (from ∼150 to ∼375 K) by substituting divalent ions (Ca2+, Ba2+, Sr2+, Pb2+, etc.) or monovalent ions (Na1+, K1+, Ag1+, Li1+, etc.) for La or by creating an excess of oxygen. The average radii of the cations at the different sites also affect the ground state of these manganites. This property can be tuned by partial substitution of La3+ with another trivalent R ion, Y3+ or Bi3+, or in La free Pr or Nd manganites (71). A characteristic parameter used to describe the manganite behavior is the ionic size tolerance factor, defined as:
(1.26)
11
The first studies on MCE of manganites appeared in 1996; to date, there is no clear correlation, for these compounds, of ∆Sm (or RCP) with the tolerance factor and thus with TC. However, it is worth noting that nonstoichiometric systems likely affect their magnetic properties and could explain the dispersion of the reported data. Several factors apart from compositional changes affect MCE signal: grain size, chemical order, sintering temperature, and pressure application.
CHAPTER 2. CRITICAL PHENOMENA IN MAGNETIC PHASE TRANSITION
2.1. Definition and classification of phase transitions
The concept of phase is a term that describes the state of matter (or a thermodynamic system) with characteristics of physical properties and symmetry. The process of changing the phase of an object under the influence of external conditions (temperature, pressure, magnetic field ...) is called phase transition.
There are in fact several ways that have been introduced in order to
classify of phase transitions:
Thermodynamic classification: according to this classification, phase transitions can be divided in two groups: those which generate latent heat and those which don't
Ehrenfest’s classification: according to this classification, a phase transition is said to be an nth order transition if the nth derivative of any of the thermodynamic potentials of the system is discontinuous at the transition. For example, according to Ehrenfest's classification the solid liquid or liquidgaseous transitions for a fluid are all first order transitions. On the other hand, an example of a second order transition is the conductorsuperconductor transition for a metal, since in this case there is a jump in the specific heat (which is the second derivative of the free
12
energy). However, Ehrenfest's classification is ultimately incorrect since at the time it was formulated it was still not known that in some transitions there are thermodynamic quantities that actually diverge instead of exhibiting a simple discontinuity.
Modern classification: it is essentially a generalization of Ehrenfest's one; according to this classification a phase transition is said to be first order if there is a jump discontinuity in one (or more) of the first derivatives of an appropriate thermodynamic potential (which depends on the system considered), and higher order, continuous or critical if the first derivatives of the thermodynamic potentials are continuous, but the second derivatives are discontinuous or diverge 2.2. Some popular ferromagnetic models and universal classes
The ferromagnetism of the material can be explained by some of theoretical models such as mean field model, Ising model, Heisenberg model ...
MS(T) and c 0
b
For secondorder phase transition ferromagnetic materials, during the transition phase FMPM, at vicinity of the critical temperature TC, the 1(T) versus temperature thus obey the variations of asymptotic relations:
g
, ε < 0;
1(T) = (H0/M0)ε
, ε > 0;
ε = 0.
ε = (T TC)/TC is the
MS(T) = M0(−ε) (2.15) c 0 (2.16) M(TC) = DH1/δ, (2.17) where M0, H0 and D are critical amplitudes, and reduced temperature. Table 2.1 Value of critical exponents for some ferromagnetic models according to the number of spatial dimensions and component vectors. Δ 15 4,82 β 1/8 0,325 γ 7/4 1,241 m 1 1 D 2 3
3 3 0,365 1,382 4,8 Model 2D Ising 3D Ising 3D Heisenberg
13
≥ 4 All m MFT 0,5 1 3
Table 2.1 shows the values of conventional critical exponents for some common ferromagnetic models. In general, for ferromagnetic materials, when critical exponents follow the Ising model, the material exhibits an anisotropic shortrange ferromagnetic order, following the Heisenberg model will exhibit the isotropic shortrange ferromagnetic order and when following the MFT model the material exhibits an isotropic longrange ferromagnetic order. In this thesis, the critical exponents are determined by the method of changing the Arrott lines (MAP) or the KouvelFisher method (KF).
CHAPTER 3. EXPERIMENTAL
In this thesis, we have fabricated three block sample systems by solid state reaction method: La0,7xNaxCa0,3MnO3 (x = 0; 0,05; 0,1); La0,7Ca0,3 xAxMnO3 (A = Sr and Ba, x = 0; 0,15; 0,3); La0,7Sr0,3Mn1xCoxO3 (x = 0; 0,05; 0;10; 0,15 and 1). To fabricate La0,7Ca0,275Ba0,025MnO3 nanocrystal samples, we use the solid phase reaction method with high energy ball milling. Then, the structure of the samples is determined by Xray diffraction of the powder sample and the temperature or magnetic field dependence of the magnetization is measured by a vibrating sample magnetometer (VSM).
CHAPTER 4. PHASE TRANSITION AND MAGNETOCALORIC
EFECT OF La0,7xNaxCa0,3MnO3 MATERIAL SYSTEM
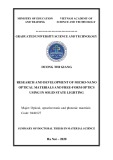
4.3. Phase transition and magnetocaloric effect of La0,7xNaxCa0,3MnO3 (x = 0; 0,05 và 0,1) system Temperature dependences of magnetization, M(T), at H = 100 Oe of La0.7 xNaxCa0.3MnO3 compounds, herein the value of magnetization is normalized magnetization at 100 K [M(T)/M(100K)], are shown in Fig.
14
1.2
0
1
0.2
)
0.8
0.4
0.6
0.1 0.05 0
0.6
K 0 0 1 ( M
T d / M d
0.1 0.05 0
H = 100 Oe
0.8
0.4
/ ) T ( M
H = 100 Oe
1
0.2
(a)
(b)
1.2
0 100
150
200
250
300
350
100
150
200
250
300
350
T (K)
T (K)
4.3(a). All the samples show a ferromagneticparamagnetic phase transition. TC value (determined as the temperature where dM/dT value is minimum, see the inset of Fig.4.3(b) is 260 K for undopedsample (x = 0). Then it is effectively towards room temperature by increasing Na concentration, TC = 284 and 298 K for x =0.05 and 0.1, respectively.
Fig. 4.3. (a) M(T)/M(100 K) versus T and dM/dT versus T (b) measured at 100 Oe for the samples.
The increase of TC value could be related to the size mismatch at the A site and the change of the structure parameters. Na+ ion with a slight larger ionic radius (rNa+ = 1.39 Å) substitutes for La3+/Ca2+ ion with a slight smaller radius (rLa3+ = 1.36 Å, rCa2+=1.34 Å) in Asite leading to an enhancement in < rA > and tG. Additionally, the decrease in the MnO bond length and the increase in the MnOMn bond angle were observed that raise the overlap integrals between the 3d orbital of Mn ions and the 2p orbital of the oxygen ion. These factors contributed to enhance the strength of the FM double exchange interaction. The value of TC thus increases with increasing Na content.
About the magnetocaloric effect of the La0,7xNaxCa0,3MnO3 system. The temperature dependences of the magnetic entropy change for all the samples have been calculated under different applied magnetic field changes from 2 to 12 kOe and plotted in Fig. 4.5. For each applied field, the variation of the magnetic entropy change as a function of temperature. There is a maximum value on ΔSm(T) curves (|ΔSM|) taking place at temperature close to the FMPM phase transition. However, the maximum position on ΔSm(T) curves of the samples x = 0 and 0.05 shifts towards higher temperature (from 257 to 259 K for x=0 and from 284 to 287 K for
15
x=0.05 when magnetic field increasing from 2 to 12 kOe), whereas this behavior is absent in the sample x=0.1. This result can be associated to a difference in the nature of the FMPM phase transition in samples. Maybe the phase transition in the samples x = 0 and 0.05 is a firstorder phase transition, whereas the sample x = 0.1 is a secondorder one.
Fig. 4.5. ΔSm(T) curves under different field changes for the samples (a) x=0, (b) x = 0.05, and (c) x = 0.1.
In each sample, the value of |ΔSM| increases strongly with higher magnetic field changes. With an enhancement of field change from 2 kOe to 12 kOe, the value of |ΔSM| of the sample x = 0 increases from 0.85 J/kgK to 5.19 J/kgK. This value is higher than that of Gd metal (2.8 J/kgK at 10 kOe). The large MCE in LCMO compound was explained based on the double exchange interaction and the spinlattice coupling. It is also reported that the FMPM phase transition in bulk LCMO sample accompanied with the structure changes that is so called as the FOPT. A structural transition driven by an applied field occurs due to the coupling between the lattice structure and magnetism was observed in manganites.
16
The large value of the magnetic entropy change in manganites is related to the spinlattice coupling in the magnetic ordering process. The changes in the structural parameters, namely the MnO bond distance and MnOMn bond angle, would support the spinordering. A more abrupt variation of magnetization will thus appear near the phase transition point, resulting in a large value of the magnetic entropy change of materials.
Doping Na into Asite (La/Casite) modifies the nature of the phase transition from the first to the secondorder. However, the magnetic entropy change thus declines. In our case, for an applied field change of 12 kOe, |ΔSM| value decreases from 5.19 J/kgK at TC = 260 K for x = 0 to 1.47 J/kgK at TC = 298 K for x = 0.1. Although a partial substitution Na+ into Asite reduces the magnetic entropy change of LCMO, its ΔSm(T) curve is extended significantly and shifts towards RT region, making this material becomes more useful for applicability. A simple parameter often used to determine the width of the temperature region happened the MCE is δTFWHM, which is the full width at half maximum of ΔSm(T) curve. In present case, under 12 kOe, δTFWHM enhances from 11 K for x=0 to 51.5 K for x = 0.1, therefore, RCP = |ΔSM| × δTFWHM thus increases from 57.12 J/kg to 75.88 J/kg. We can see that the value of RCP obtained in the second order La0.6Na0.1Ca0.3MnO3 compound (x = 0.1) is quite high (see table 4.4). If compared in the same applied field change, our result is slight higher than that reported for pure Gd metal (63.4 J/kg at 10 kOe). Table 4.4. The characteristic magnetocaloric parameters of La0,7 xNaxCa0,3MnO3 (x = 0; 0.05; 0.1) system and of Gd metal.
Sample TC (K) Ref.
Thesis Thesis Thesis
La0,7Ca0,3MnO3 La0,65Na0,05Ca0,3MnO3 La0,60Na0,10Ca0,3MnO3 Gd 259 287 298 294 ΔH (kOe) 12 12 12 10 |ΔSM| (J/kgK) 5,19 1,91 1,47 2,8 RCP (J/kg) 57,12 73,45 75,88 63,4
CHAPTER 5: PHASE TRANSITION AND MAGNETOCALORIC EFFECT
17
OF La0,7Ca0,3xAxMnO3 (A = Sr, Ba) MATERIAL SYSTEM
5.1. Phase transition and magnetocaloric effect of La0,7Ca0,3xAxMnO3 (A = Sr, Ba) system
Fig. 5.2(a) show that normalized thermomagnetization curves
(M/M100K vs. T) measured under an applied field of 100 Oe in the zero
field cooled mode for the samples show a sharp FMPM phase transition.
This phase transition is associated with the La0.7Ca0.3xAxMnO3 perovskite
phase in the samples, in a good agreement with the above presented
structure analysis. The FMPM phase transition is effectively tuned to
higher temperature by increasing Sr or Ba substitution. Generally, the
increase in TC can be related to an increasing
Fig. 5.2. (a) Normalized thermomagnetization curves M/M100K vs. T
measured under a field of 100 Oe in the zerofield cooled mode for
the samples, (b) the variation of TC value in
18
different temperatures, M(H, T), and then studied their critical behavior and MCE. Figs. 3(a)(c) show the M(H, T) curves around TC for LC, LB and LS samples. In below TC region, the M(H) curves are nonlinear, the magnetization increases quickly in low fields and then approached to saturation above 2 kOe as a character of the FM state. At temperatures above TC, the magnetization increases linearly with the magnetic field due to the PM state. The FMPM phase separation in the samples would be clearer if we perform the Arrott plots of H/M versus M2. There the nonlinear parts in the lowfield region at temperatures below and above TC are driven towards two opposite directions revealing the FMPM separation. Figs. 5.3(d)(f) present tree representative LC, LB, and LS samples. Our results pointed out that the nonlinear parts in the lowfield region at temperatures below and above TC of the H/M versus M2 curves are driven towards two opposite directions, corresponding to the FMPM phase transition in the samples. However, the slope of some H/M versus M2 curves at temperatures above TC of LC sample is negative, Fig. 5.3(d), whereas the slopes of all H/M versus M2 curves for Sr and Ba substitutions are positive, Figs. 5.3(e) and (f). Comparing with the Banerjee's criteria, we conclusion that the LC sample is a FOPT material, whereas the Sr and Basubstituted samples with x = 0.15 and 0.3 exhibit the SOPT characterization. Furthermore, the H/M versus M2 curves at high magnetic field region for Sr and Ba substitution samples are not completely parallel, the line at TC does not pass through the origin. These suggest that there is a deviation from the MFT, which could be related to an existence of the magnetic inhomogeneities in these samples.
19
Fig. 5. 3. (a)(c) M(H) curves and (d)(f) H/M versus M2 curves measured at different temperatures around the FMPM phase transition for three representative LC, LB, and LS samples.
Based on the initial magnetization curve data measured at different temperatures M(H, T), we have calculated the values of the magnetic entropy change of La0,7Ca0,3xAxMnO3 material system according to equation (1.7). Temperature dependences of ΔSm(T) for several applied magnetic field change D H = 410 kOe (with step of 1 kOe) are calculated and shown in Fig. 5.4. One can see that the ΔSm(T) curves as the functions of temperature. For each sample, the ΔSm(T) curve reaches the maximum value (denoted as |ΔSM|) around its TC, and the |ΔSM| value increases with an increasing D H. Further, LC sample (x = 0) undergoing FOPT shows a larger |ΔSM| value and a narrower MCE than SOPT ones. Among these, the |ΔSM| value obtained for LC sample is highest, |ΔSM| = 5 J/kg K under D H = 10 kOe. For the case of the SOPT samples, the jDSmaxj values are found to be 2.19 and 1.90 J/kg.K for LCS and LS samples (Srdoped), and 1.67 and 1.37 J/kg.K for LCB and LB samples (Badoped), respectively, under D H = 10 kOe.
20
xAxMnO3 (A = Sr, Ba; x = 0; 0,15; 0,3) system.
Fig. 5. 4. ∆Sm(T) curves under different field changes of La0,7Ca0,3
Table 5.2. TC temperature and magnetocaloric parameters of the La0,7Ca0,3 xAxMnO3 (A = Sr, Ba) system compared with the Gd metal.
Sample TC (K) Ref.
260 333 360 ΔH (kOe) 10 10 10 |ΔSM| (J/kgK) 4,92 1,37 1,91 RCP (J/kg) 42,75 48,46 39,99 Thesis Thesis Thesis
300 10 1,67 36,62 Thesis
322 10 Thesis 2,19 44,0
La0,7Ca0,3MnO3(LC) La0,7Ba0,3MnO3 (LB) La0,7Sr0,3MnO3 (LS) La0,7Ca0,15Ba0,15MnO3 (LCB) La0,7Ca0,15Sr0,15MnO3 (LCS) Gd 294 10 2,8 63,4
21
Fig. 5.7. |ΔSM|/ΔH versus TC of La0,7Ca0,3xAxMnO3 (A = Sr, Ba) and Gd
metal. For convenience, we used the ratio of |ΔSM|/ΔH to compare the magnitude of the MCE for Gd metal and some Sr and Ba doped La0.7Ca0.3MnO3 compounds. Fig. 5 shows the ratio of |ΔSM|/ΔH versus TC data obtained from our samples and Gd metal, and some manganites. Most these compounds exhibit |ΔSM|/ΔH ratio to be about 0.10.2 J/kg.K.kOe except La0.7Ca0.3MnO3 compounds (|ΔSM|/ΔH = 0.5 J/kg.K.kOe). In our case, |ΔSM|/ΔH ratio found to be about 0.1370.492 J/kg.K.kOe. To explain the large MCE in manganites, in addition of the DE mechanism proposed by Zener, several authors suggested that the spinlattice coupling in the magnetic ordering process should be main cause, and the change in lattice parameters of manganites, namely the MnO bond distance and MnOMn bond angle, would in turn favor the spin ordering. A large magnetic entropy change in these compounds will thus be appeared. 5.2. transition and magnetocaloric effect Phase of
La0,7Ca0,275Ba0,025MnO3 nanocrystalline system
22
8
0
(a)
(b)
0.2
6
0.4
4
) g / u m e (
T d / M d
0.6
M
2
S0 S1 S2 S3
0.8
S0 S1 S2 S3
1
0 0
50
100
200
250
300
200
300
150 T (K)
250 T (K)
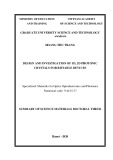
Figure 5.10. (a) M (T) curves and (b) temperature dependent dM/dT of samples measured at H = 100 Oe in ZFC mode La0,7Ca0,275Ba0,025MnO3 (d = 200, 88, 62, 38 nm) nanocrystalline system Figure 5.10 (a) shows the curves of the M (T) temperature dependence in a magnetic field of 100 Oe, measured in the freemagnetic cooling (ZFC) mode of the nanocrystalline system La0,7Ca0,275Ba0,025MnO3. The results showed that all samples appeared phase transition in the range from 250 to 270 K. As the temperature increases, the sample temperature increases gradually and reaches a maximum, then decreases rapidly at the ambient temperature of the FMPM phase transition temperature. Besides, we can see that the sharpness of the FMPM transitions in the curves is different. The sharpness of the FMPM phase transition decreases as the crystal size decreases from 200 to 38 nm, and at the same time their phase transition is enlarged. TC values of samples were determined at the minimum positions of the first order differentials from degrees to temperature (Figure 5.10 (b)). TC values of 260, 258, 256 and 256 K correspond to samples with crystal sizes d = 200, 88, 62, 38 nm. Visible, while d decreased quite quickly, the TC temperature only decreased slightly by a few K. The cause of this phenomenon is due to a slight decrease in the conductive width W when the particle size decreases from 20038 nm.
23
1
1.2
(a)
(b)
0.8
232270 K (cid:0) T = 2 K
S0
S1
232280 K (cid:0) T = 3 K
0.8
0.6
) u m e / g . e O
) u m e / g . e O
3
3
0.4
0 1 x (
0 1 x (
0.4
/
/
M H
M H
0.2
0 0
1
4
5
6
0 0
1
2
4
3
6
7
2 3 M2 (x 103 emu2/g2)
5 M2 (x 103 emu2/g2)
1
1.2
(c)
(d)
1
232270 K (cid:0) T = 2 K
232270 K (cid:0) T = 2 K
0.8
S2
S3
0.8
0.6
) u m e / g . e O
) u m e / g . e O
3
3
0.6
0 1 x (
0.4
0 1 x (
0.4
/
/
M H
M H
0.2
0.2
0 0
0 0
1
2
3
4
5
1
3
4
M2 (x 103 emu2/g2)
2 M2 (x 103 emu2/g2)
Fig. 5.13. Family of M2 dependent H/M curves in the vicinity of the FM PM transition region of the La0,7Ca0,275Ba0,025MnO3 (d = 200, 88, 62, 38 nm) nanocrystalline samples. Figure 5.15 shows the variation of magnetic entropy according to the temperature of the nanocrystalline samples La0,7Ca0,275Ba0,025MnO3 in the magnetic field variations from 540 kOe. The results show that the magnetic entropy variation of the nanocrystalline samples is a function of temperature and reaches the maximum near the FMPM phase transition temperature. With ΔH = 40 kOe, |ΔSM| obtained for the samples were 8.6 respectively; 7.2; 6.2 and 5.25 J/kgK respectively d = 200, 88, 62, 38 nm.Thus, the thermal effect of the samples is significantly influenced by the crystal size, | ΔSM | of the samples decreased as d decreased (Figure 5.16 (a)).
24
8
8
7
(a)
(b)
(cid:0) H = 540 kOe
(cid:0) H = 540 kOe
)
)
6
1
1
S1
K
K
6
S0
.
.
5
1
1
4
g k . J (
g k . J (
4
m
m
S
S
3
(cid:0)
(cid:0)
2
2
1
0 230
240
250
260
270
280
240
250
260
270
280
0 230
T (K)
T (K)
7
6
(c)
(d)
6
5
(cid:0) H = 540 kOe
(cid:0) H = 540 kOe
)
)
1
1
5
S3
K
S2
K
.
4
.
1
1
4
3
g k . J (
g k . J (
m
3
m
S
S
2
(cid:0)
(cid:0)
2
1
1
0 230
240
250
260
270
280
0 230
240
250
260
270
280
T (K)
T (K)
Figure 5.15 The temperature dependence of magnetic entropy change of the La0,7Ca0,275Ba0,025MnO3 (d = 200, 88, 62, 38 nm) nanocrystalline samples.
In summary, the S2 and S3 nanocrystalline samples exhibiting quadratic phase transition and intersection between two types of phase transition have a wide phase transition temperature range and quite large RCP values. Furthermore, their magnetic resistance is very small (HC < 180 Oe), so the energy loss caused by magnetic hysteresis is negligible. Therefore, we can hope that the La0,7Ca0,275Ba0,025MnO3 crystalline nanoparticle system will continue to attract more research interest to improve the technology conditions, to gradually approach the adaptability used in magnetic cooling techniques.
CHAPTER 6. CRITICAL BEHAVIOR OF La0,7A0,3MnO3 (A = Ca, Sr, Ba) MATERIAL SYSTEM
6.1. Critical behavior of La0,7Ca0,3xAxMnO3 (A = Sr, Ba, x = 0,15; 0,3)
1(T)
Figure 6.3 shows the temperature changes of the MS(T) and (cid:0) 0
25
1(T) data around the FMPM phase transition of LCB,
data in the final step of the modify Arrott (symbols). The critical parameters obtained of samples are also presented in Figure 6.3, and listed in Table 6.1.
Fig. 6.3. MS(T), (cid:0) 0
LCS, LB, and LS samples Table 6.1. The values of the critical parameters obtained for the theoretical models and La0,7Ca0,3xAxMnO3 (A = Sr, Ba) sample system.
β γ δ Model/Sample Method Ref.
MFT 3D Heisenberg 3D Ising TMFT TC (K) 3,0 4,80 4,82 5,0 Theory Theory Theory Theory
299,2 MCE
LCB Thesis
LCS Thesis
LB 0,5 1,0 0,365 1,386 0,325 1,241 0,25 1,0 0,44 4 298,2 0,431 1,069 298,2 0,438 1,032 3,36 319,2 0,435 319,8 0,453 1,097 319,2 0,491 1,054 334,5 0,50 3,15 KF MAP MCE KF MAP MCE Thesis
26
β γ δ Model/Sample Method Ref. TC (K)
LS Thesis
KF MAP MCE KF MAP 4 330,3 0,494 1,058 332,3 0,493 1,059 361,5 0,414 360,4 0,382 1,191 1,16 360,2 0,382 3,15 4,03
γ
γ
γ β = 0.382 and
In comparison, the values of the critical exponents obtained for our samples and those expected for theoretical models (the mean field, the 3D Heisenberg, the 3DIsing and the tricritical meanfield models) are shown in Table 6.1. Though La0.7Ca0.3MnO3 compound exhibits the FOPT characterization but Sr or Ba replacement for Ca modified this compound to the SOPT material. For Srsubstitution case, the critical exponents are β = 0,491 and 0.382, = 1.054 and 1.160 for x = 0.15 and 0.3, respectively. Clearly, β and determined for the sample x = 0.15 are very close to those expected for the meanfield theory, which proves the existence of a long = 1.160 obtained range FM order in LCS sample. While for sample x = 0.3 are quite close to those expected for 3DHeisenberg model. It suggests that the shortrange FM order exists in LS sample. In other word, La0,7Ca0,3xSrxMnO3 compounds with (x = 0,150,3). may be more magnetically inhomogeneous with more Sr concentration, which favors establishing the shortrange FM order. In contrast, with increasing Ba concentration in La0,7Ca0,3xBaxMnO3 compounds, the b value increases toward that expected for the MFT. It means that Ba doping favors establishing the longrange FM order in La0,7Ca0,3xBaxMnO3 (x = 0,150,3). However, the β values obtained for both Sr and Ba substitutions for Ca are smaller than 0.5, which indicates the existence of magnetic inhomogeneities due to the formation of the FM clusters, leading to short range magnetic order in the samples. This is in good agreement with the discussion related to the M(H) analyses. 6.2. Critical behavior of La0,7Sr0,3Mn1−xCoxO3 (x = 01)
γ β With and
values obtained from the final step of KF method, the Arrot plots for two representative samples with x = 0 and 1 are shown in
27
15
50
4 104
344 K
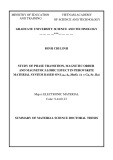
Fig. 3(a). Here, the Fig. 3(b) show the KF plots for these samples. It comes to our attention that these M1/b versus (H/M)1/c curves at high fields around TC are parallel straight lines. Additionally, the TC values obtained from KF method are very close to those determined from the minimum of dM/dT versus T curves. These reflect that the critical parameters b, c, and TC determined from KF method as described above are reliable.
(a)
(c)
)
40
La
Sr
0.7
0.3
MnO 3
3 104
1
(cid:0)
7 7 3 . 0 / 1
= 0.377 (cid:0) = 1.168 = 360.2 K T C
10
0
1
30
) T d /
S
. ( d(cid:0)
(cid:0) T = 2 K
2 104
0
) g / u m e ( (
1
M d ( .
S
20
M
5
/ d T )
7 7 3 . 0 / 1
1
M
1 104
10
K 6 7 3
350
370
0 340
0 380
0 0
100
200
300
360 T (K)
50 250 150 (H/M)1/1.168 ((Oe.g/emu)1/1.168)
50
15
2 103
208 K
(cid:0)
(b)
(d)
)
40
4 1 4
.
La
Sr
0.7
0.3
CoO 3
(cid:0)
1
0 / 1
= 0.414 (cid:0) = 1.208 = 224.2 K T C
10
0
1
30
) T d /
S
. ( d(cid:0)
(cid:0) T = 2 K
1 103
0
) g / u m e ( (
1
M d ( .
20
S
4 1 4
.
M
5
/ d T )
0 / 1
1
M
10
K 0 4 2
0
0
0 100 0
200
300
400
210
220
230
240
100 H/M1/1.208 ((Oe.g/emu)1/1.208)
T (K)
(cid:0)
Fig. 6.10. (a) Modified Arrot plots, M1/β versus (H/M)1/γ, for two representative LSCMO compounds with x = 0 and x = 1. (b) The insets show the KF construction for these samples
Critical parameters of the LSMCO material system are shown in Table 6.2. Comparing with the theoretical models, see Table 6.1, the values β, γ, and δ obtained from our works do not belong to any universality class. Our results show that the values β = 0.377 and γ = 1.168 are close to δ = 0.365 of the 3DHeisenberg model and γ = 1.241 of 3DIsing model, respectively, for the sample x = 0 (La0.7Sr0.3MnO3). This suggests an existence of FM shortrange order in the x = 0 sample. Whereas, for the Codoped sample, the β values (β = 0.403–0.457) are located in between
28
xCoxO3 (x = 01) material system
those expected for the MFT and 3DHeisenberg, while γ values (1.114– 1.208) are in between those expected for the MFT and 3DIsing models. With the values of critical exponents obtained, we suggest that there coexists short and longrange FM order in our samples. This could be ascribed to a coexistence of FM DE and AFM SE interactions as well as an existence of magnetic inhomogeneities. Notably, the β values obtained for Codoped samples shift towards that expected for the MFT. Table 6.2. The value of the critical exponent of the system La0,7Sr0,3Mn1
β γ δ Sample Method Ref.
La0,7Sr0,3MnO3 La0,7Sr0,3Mn0,95Co0,05O3 La0,7Sr0,3Mn0,9Co0,1O3 La0,7Sr0,3Mn0,85Co0,15O3 La0,7Sr0,3CoO3 KF KF KF KF KF TC (K) 360,2 0,377 1,168 320,4 0,403 1,159 1,114 0,457 281,6 1,187 0,418 273,9 1,208 0,414 224,2 4,10 3,88 3,44 3,84 3,92 Thesis Thesis Thesis Thesis Thesis
CONCLUSION
1. Successfully fabricated perovskite material systems: La0,7 xNaxCa0,3MnO3 (x = 00,1), La0,7Ca0,3xAxMnO3 (A = Sr, Ba and x = 00,3), La0,7Sr0,3Mn1xCoxO3 (x = 01) and La0,7Ca0,275Ba0,025MnO3 (d = 38200 nm) nanocrystal system by solid state reaction and highenergy ball milling method.
≈ ≈ 40 K and RCP
2. Found the two materials with the best magnetocaloric parameters, and they have the potential to apply in magnetic cooling technology are: (i) La0,6Na0,1Ca0,3MnO3 (TC = 298 K, δTFWHM = 51,5 K and RCP = 75,88 J/kg under ∆H = 12 kOe) and (ii) La0,7Ca0,275Ba0,025MnO3 with crystal size in the range of 3862 nm, TC = 256 K, δTFWHM 200 J/kg under ∆H = 12 kOe ).
3. Control of phase transition nature from first to second order, phase transition temperature and magnetocaloric parameters of some perovskite material systems base on La0,7Ca0,3MnO3 through: (i) Adjust concentration
29
and substitution element: replacing Na for La in La0,7xNaxCa0,3MnO3 (x = 00,1) system, replacing Sr or Ba for Ca in La0,7Ca0,3xAxMnO3 (x = 00,3) system and replacing Co for Mn in La0,7Sr0,3Mn1xCoxO3 (x = 01) system; (ii) Adjust crystal size in La0,7Ca0,275Ba0,025MnO3 (d = 38200 nm) nanocrystal system.
4. Applied the phenomenological model to analyze M(T) data of La0,7xNaxCa0,3MnO3 material system to predict the changing laws of magnetocaloric parameters in the vicinity of FMPM phase transition at different magnetic fields. This is a new method, simple and allows simultaneous predict many physical parameters include: D Sm(T,H), D Tad(T,H), |D SM|(H) và RCP(H)...
5. Using the universal master curve method applied to the magnetic entropy change data to verify the Banerjee’s criteria for distinction phase transition order of materials. The results are confirmed: La0,7Ca0,3MnO3, La0,65Na0,05Ca0,3MnO3 and La0,7Ca0,275Ba0,025MnO3 (with d = 88200 nm) are first order phase transition materials; La0,6Na0,1Ca0,3MnO3, La0,7Ca0,3 xAxMnO3 (A = Sr, Ba; x = 0.15 and 0.3), La0,7Sr0,3Mn1xCoxO3 (x = 01) and La0, 7Ca0,275Ba0,025MnO3 (with d = 38 nm) are second order phase transition materials. Meanwhile, La0,7Ca0,275Ba0,025MnO3 (with d = 62 nm) is located in between the FOPT and SOPT materials (i.e., the crossover of the first tosecond order phase transformation). The universal master curve method clearly shows the advantages when combined with Banerjee’s criterion in the study of materials that exhibit the crossover between two phase transition order.
6. Using the modify Arrott plots and Kouvel – Fisher method to determine the critical parameters in the vicinity of FMPM phase transition of the material systems: La0,7Ca0,3xAxMnO3 (A = Sr, Ba và x = 0,15; 0,3) and La0,7Sr0,3Mn1xCoxO3 (x = 01). The reliability of the critical parameters has been verified by the scaling function: H/Mδ = h(ε/M1/β) and the ArrottNoakes equation of state: (H/M)1/γ = aε + bM1/β. The results showed that there is coexistence of short and long range ferromagnetic order. However, depending on element and doped concentration, the ferromagnetic order in the materials will have different forming preferences:
30
Srdoping favors establishing the shortrange FM order in La0,7Ca0,3
xSrxMnO3.
Badoping favors establishing the longrange FM order in La0,7Ca0,3
xBaxMnO3.
Codoping favors establishing the longrange FM order in
La0,7Sr0,3Mn1xCoxO3.
NOVEL CONTRIBUTIONS OF THESIS
≈ ≈ 200 J/kg under ∆ 40 K and RCP
1. Two magnetocaloric materials with some advances charaters, have been successful synthesized they could be used in the in magnetic cooling technology: (i) La0,6Na0,1Ca0,3MnO3 bulk with TC = 298 K, δTFWHM = 51,5 K and RCP = 75,88 J/kg under ∆H = 12 kOe), and (ii) La0,7Ca0,275Ba0,025MnO3 nanocrystals with crystal size in the range of 38 62 nm, TC = 256 K, δTFWHM H = 12 kOe ).
2. Controling the nature of the phase transfomation from the first to the second order, Curie temperature and magnetocaloric parameters of some perovskite materials based on La0,7Ca0,3MnO3 through: (i) adjust concentration and substitution elements: replacing Na for La in La0,7 xNaxCa0,3MnO3 (x = 00,1), replacing Sr or Ba for Ca in La0,7Ca0,3 xAxMnO3 (x = 00,3) and replacing Co for Mn in La0,7Sr0,3Mn1xCoxO3 (x = 01) system; (ii) adjust crystal size in La0,7Ca0,275Ba0,025MnO3 (d = 38 200 nm) nanocrystals
3. Pointed out a coexistence of the short and the long range ferromagnetic (FM) order in La0,7Ca0,3xAxMnO3 (A = Sr, Ba; x = 0,15; 0,3) and La0,7Sr0,3Mn1xCoxO3 (x = 01) materials. However, depending on element and doped concentration, the ferromagnetic order in the materials will have different forming preferences:
Srdoping favors establishing the shortrange FM order in La0,7Ca0,3
xSrxMnO3.
Badoping favors establishing the longrange FM order in La0,7Ca0,3
xBaxMnO3.
31
Codoping favors establishing the longrange FM order in
La0,7Sr0,3Mn1xCoxO3.