Journal of Water Resources & Environmental Engineering - No. 87 (12/2023)
88
A physically-based model for streaming potential
in fully saturated porous media
Nguyen Manh Hung
1,2,3
, Nguyen Van Nghia
1
, Luong Duy Thanh
1*
Abstract: The streaming potential that originates from water flow in porous media plays an importa
nt
role in geophysical applications since it is sensitive to groundwater flow. In this work,
we develop a
physically-
based model for the streaming potential in porous media using a bundle of capillary tubes
model. The model is expressed in terms of microst
ructure properties, fluid properties and
physicochemical properties at the fluid-solid interfaces. Additionally, we obtain an expression for
the
characteristic length scale as a function of
microstructure properties. The model is successfully validated
by comparisons with 12 samples of uniform glass bead available in literature.
The model proposes a
simple way to model the streaming potential generation in porous media under fully saturated
conditions.
Keywords: Streaming potential, porous media, capillaries, pore size distribution.
1. Introduction
*
Streaming potential (SP) originates from
water flow in porous media and it is directly
related to the electrical double layer at solid-
fluid interfaces. The SP method is a passive
geophysical method based on measurements of
voltage which is naturally generated in the
subsurface. The SP method plays an important
role in geophysical applications since SP data
are sensitive to groundwater flow. For example,
SP measurements have been utilized for
detecting and monitoring groundwater flow,
dam leakage detection, studies of sinkhole,
caves, conduits, and faults etc. (e.g., Barde et
al., 2021 and references therein). Although SP
data are relatively easy to measure, the
extraction of useful information from obtained
data is not an easy task since there are different
1
Faculty of Electrical and Electronics Engineering,
Thuyloi University
2
Graduate School, Phenikaa University
3
Phenikaa Institute for Advanced Study (PIAS), Phenikaa
University
*
Corresponding author
Received 10
th
Nov. 2023
Accepted 28
th
Dec. 2023
Available online 31
st
Dec. 2023
contributions to the SP signal (e.g., Guarracino
and Jougnot, 2018). Hence, understanding how
microstructure and physicochemical parameters
affect the SP signal is crucial. One of the most
important parameters quantifying the coupling
between the water flow and measured signal,
that is voltage, is defined as the streaming
potential coefficient (SPC) given by
,
P
V
C
S
(1)
where ∆V (V) is a measured voltage and ∆P
(Pa) is an applied pressure difference across a
probed sample.
There are usually two approaches for the
SPC under fully saturated conditions. The first
one is classically based on the so-called
Helmholtz-Smoluchowski (HS) equation
(Smoluchowski, 1903) that has been widely
used when the surface conductivity is
negligible. According to the HS equation, the
SPC is expressed in term of physicochemical
parameters and fluid properties as
,C
w
or
S
(2)
where ε
r
(unitless) is the relative
permittivity of the fluid (taken as 80 for

Journal of Water Resources & Environmental Engineering - No. 87 (12/2023)
89
water), ε
o
(F/m) is the dielectric permittivity
in vacuum (taken as 8.854×10
-12
), η (Pa.s) is
the dynamic viscosity of the fluid (taken as
10
-3
for water), σ
w
(S/m)
is the water electrical
conductivity and ζ (V) is the zeta potential.
When the surface conductivity is significant,
one needs to apply the modified HS equation
given by for the SPC (e.g., Ishido and
Mizutani, 1981)
,C
s
w
or
S
2
(3)
where Σ
s
(S) is the specific surface
conductance and Λ (m) is a so-called
characteristic length scale of porous media.
The second one for the SPC is more recent
and based on the excess charge that is dragged
by the water flow (e.g., Revil and Leroy,
2004) as
,
kQ
C
v
S
ˆ
(4)
where
v
Q
ˆ
(C/m
3
), k (m
2
) and
(S/m) are
the effective excess charge density,
permeability and electrical conductivity of
fully saturated porous media.
In this work, we focus on the framework
of the HS equation using a bundle of
capillary (BOC) model with consideration of
the surface conductivity. The BOC model is a
simple representation of the real pore space
that have been effectively applied to study
transport phenomena in porous media
(Guarracino and Jougnot, 2018, Thanh et al.,
2019). In the context of the BOC, a porous
medium is conceptualized as composed by an
equivalent bundle of parallel capillary tubes
with varying radii. The BOC model has been
successfully applied to study the SP in
porous media using different distributions of
pore size (PSD) such as fractal PSD (e.g.,
Guarracino and Jougnot, 2018) or lognormal
PSD (e.g., Thanh et al., 2022). However, it
was shown that the similarly skewed PSD
(Jackson, 2008) and the non-monotonic PSD
that was determined from direct
measurements (Vinogradov et al., 2021) are
also applicable for natural porous media.
Therefore, we apply a BOC model following
the similarly skewed PSD to develop a model
for the SP in porous media. The proposed
model shows the influences of microstructure
properties, fluid properties and
physicochemical properties at the fluid-solid
interfaces on the SPC. Finally, we validate
the proposed model using published
experimental data.
2. Model development
A porous medium is made up of mineral
solid grains such as silicates, oxides,
carbonates etc. When solid grain surfaces are
in contact with water, they generally become
electrically charged, creating an electrical
double layer (EDL) containing an excess of
charge that counterbalances the charge
deficiency of the solid surface (Hunter,
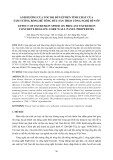
1981). The EDL comprises an inner compact
(Stern) layer and an outer diffuse (Gouy-
Chapman) layer (see Fig. 1). In the Stern
layer, there are only counter-ions coating the
mineral with a very limited thickness. In the
diffuse layer, there are both counter-ions and
co-ions but with a net excess charge. The
shear plane, which can be approximated as a
border plane between the Stern layer and
diffuse layer, separates the mobile and
immobile part of the water molecules when
subjected to a pressure gradient. The
electrical potential at this plane is called ζ
potential. When the water flows through pore
spaces under application of an external
pressure gradient, it drags a fraction of the
excess charge that give rise to a streaming
current and, hence, an electrical potential
field that is termed the streaming potential
(e.g., Ishido and Mizutani, 1981).
Journal of Water Resources & Environmental Engineering - No. 87 (12/2023)
90
Figure 1. Stern model for the charge
and electric potential distribution in the EDL
at a solid-liquid interface (e.g., Ishido and
Mizutani, 1981).
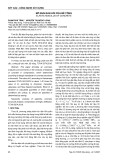
To develop a model for the SPC under fully
saturated conditions, we consider a cubic
representative elementary volume (REV) of a
porous medium of side length L
o
and cross-
section area A
REV
as shown in Fig. 2. According
to the BOC model, the REV is conceptualized
as a bundle of tortuous cylindrical capillaries
with radii varying from a minimum pore radius
r
min
to a maximum pore radius r
max
. All
capillaries are parallel and there are no
intersections between them. The pore size
distribution f(r) is such that the number of
capillaries with radius in the range from r to r +
dr is given by f(r)dr. Depending on the specific
PSDs such as the fractal or lognormal or
similarly skewed, one has different functions for
f(r). In this work, we use the similarly skewed
PSD that is given by (e.g., Jackson, 2008)
,
rr
rr
Arf
m
maxmin
max
)(
(5)
where A and m are constants depending on
characteristics of porous media.
Figure 2. The bundle of capillary tubes model
Under a thin double layer assumption for
which the thickness of the EDL is much smaller
than the pore radius, the streaming current in a
single saturated capillary of radius r due to the
charge transport by water is given by (Rice and
Whitehead, 1965)
,r
L
P
ri
or
s
2
)(
(6)
where ∆P (Pa) is the applied pressure
difference across the capillary and
L (m) is the
real length of the tortuous capillary as shown in
Fig. 2.
The total streaming current through the REV
is the sum of the streaming currents over all
capillaries saturated by water with radii ranging
from r
min
to r
max
.)d()(
max
min
REV
r
r
ss
rrfriI
(7)
Combining Eq. (6) and Eq. (7) yields
.)d()d(
max
min
max
min
22REV
r
r
or
r
r
or
s
rrfr
L
P
rrfr
L
P
I
(8)
As a consequence of the streaming current,
an electrical potential difference that is termed
the streaming potential (ΔV) is established
across the REV. This streaming potential, in

Journal of Water Resources & Environmental Engineering - No. 87 (12/2023)
91
turn, generates an electric conduction current
in opposite direction with the streaming
current. The conduction current in a single
saturated capillary of radius r is given by
(e.g., Abaza, 1996).
).2()(
2
rr
L
V
ri
swc
(9)
Similarly, the total conduction current in the
REV is given by
.)d()2()d()(
max
min
max
min
2REV
r
r
sw
r
r
cc
rrfrr
L
V
rrfriI
(10)
Under a steady state condition, the total
streaming current
REV
s
I
(A) is equal to the total
conduction current
REV
c
I
(A) in magnitude.
Therefore, we obtain the following equation
.)d(2)d(
max
min
max
min
22
r
r
r
r
sw
or
rrfrr
L
V
rrfr
L
P
(11)
Arranging Eq. (11) in combination with Eq. (1), we obtain the SPC for water-saturated porous
media as
.
)d(
)d(2
max
min
max
min
2
r
r
r
r
s
w
or
S
rrfr
rrrf
C
(12)
It is important to remark that Eq. (12) has been built up for any pore size distribution f(r). In
this work, we use the similarly skewed PSD given by Eq. (5). Substituting Eq. (5) into Eq. (12),
we obtain
,
)2)(1()1(22
)1(1)3(2
2
max
mmmr
mm
C
s
w
or
S
(13)
where
maxmin
/rr
.
Eq. (12) is one of the key results in this work.
It shows the dependence of microstructure
properties (m,
min
r
,
max
r
), fluid properties (η, σ
w
)
and physicochemical properties at the fluid-
solid interfaces (ζ, Σ
s
) on the SPC. Eq. (13) is in
the similar form to Eq. (3). When the surface
conductivity is negligible, i.e. Σ
s
= 0, Eq. (13)
reduces to the well-known HS equation given
by Eq. (1).
Comparing Eq. (13) and Eq. (3), we obtain
an expression for the characteristic length scale
as a function of microstructure properties
(m,
min
r
,
max
r
):
.
)1(1)3(
)2)(1()m1(22
2
max
mm
mmr
(14)
Journal of Water Resources & Environmental Engineering - No. 87 (12/2023)
92
It should be noted that, for nonconsolidated
granular media (e.g., packs of sands or glass
beads), one can approximately determine
max
r
from the mean grain diameter d and porosity
as (e.g., Cai et al., 2012)
1
)1(411
2
8
max
d
r
.(15)
3. Results and discussion
Figure 3. Variation of the characteristic length scale with parameters m
and β for a representative value of r
max
=100 μm.
To show the sensitivity of the model with input
parameters, we plot the characteristic length scale
Λ as a function of parameters m and β for a
representative value of r
max
=100 μm based on Eq.
(14) as shown in Fig. 3. The result indicates that
the characteristic length scale Λ, and hence C
S
are
strongly dependent on parameters m and β. The
characteristic length scale increases with
increasing m and increasing β.
To validate the expressions proposed in this
work, which are given by Eq. (13) and Eq. (14),
we compare those with experimental data
reported by Glover and Déry, 2010 for a set of
glass bead packs. Properties of the samples
(mean grain diameter, porosity and effective
pore radius) and measured parameters of the
SPC and zeta potential at two values of σ
w
(2.43×10
-3
S/m and 2.41×10
-2
S/m) are reported
in Glover and Déry, 2010 and summarized in
Table 1. Note that there are not much published
data with sufficient parameters to validate our
proposed expressions.
Table 1. Properties and measured parameters for a set of glass bead packs by Glover
and Déry, 2010. Symbols d,
, r
p
, C
S
and ζ stand for the mean grain diameter, porosity,
effective pore radius, streaming potential coefficient and zeta potential, respectively
For σ
w
= 2.43×10
-3
S/m For σ
w
= 2.41×10
-2
S/m
Sample d
(μm)
(unitles
s) r
p
(μm)
C
S
(10
-6
V/Pa) ζ (mV) C
S
(10
-6
V/Pa) ζ (mV)
1 1.05 0.41 0.16 0.59 81 0.15 28
2 2.11 0.40 0.31 1.11 81 0.26 28
3 5.01 0.38 0.68 2.98 81 0.44 28
4 11.2 0.40 1.64 5.40 81 0.57 28
5 21.5 0.38 2.94 9.14 81 0.69 28
6 31.0 0.39 4.40 11.43 81 0.71 28