Journal of Water Resources & Environmental Engineering - No. 87 (12/2023)
25
Tire-road separation: Problem and solving method
Nguyen Dang Quy
1
, Vu Ngoc Tuan
1*
, Nguyen Truong Sinh
1
, Vu Van Tan
2
Abstract: The paper discusses the movement of a quarter-
car concerning whether the tires are in contact
with the road or not. A set of equations is formulated to highlight the two different states, and a new
approach is p
resented to solve these equations while also considering the separation of the tires. A
comparison between the new and old models shows that previous studies lacking this consideration
must be reevaluated. A simulation is conducted to demonstrate how the c
haracteristics of the road and
suspension affect vertical displacement. Ultimately, this research provides more accurate outcomes that
can be used to inform future suspension design.
Keywords: Quarter-car vibrations, vehicle vibrations, vibration dynamics, tire-road separation, v
ehicle
safety, ride comfort.
1. Introduction
*
Previous research on vehicle vibrations has
traditionally assumed that the vehicle remains in
contact with the road (Jazar, 2017). However, in
real-world scenarios, cars can experience instances
where they lose contact with the road due to
various factors (Jazar, 2023). Recent studies in
separation dynamics have demonstrated that
accounting for the possibility of separation between
the wheel and the ground leads to a more realistic
representation of the system (Nguyen, 2022a),
(Nguyen, 2021), (Nguyen, 2021a), (Nguyen,
2021b), (Nguyen, 2022b), (Khazaie, 2018).
To observe the normal vibration dynamics,
researchers have employed vibrating half-car
models or more comprehensive models such as
the full-car model (Gillespie, 1992). However,
solving the governing equations for these
models, particularly in their discontinuous states
due to wheel and suspension constraints, can be
more complex (Nguyen, 2021b). A quarter-car
model, which focuses on studying the vertical
1
Le Quy Don Technical University, Hanoi, Vietnam
2
University of Transport and Communications, Hanoi,
Vietnam
*
Corresponding author; Email: tuan.vungoc@lqdtu.edu.vn
Received 20
th
Sep. 2023
Accepted 23
rd
Oct. 2023
Available online 31
st
Dec. 2023
responses and investigates a single corner of the
vehicle with body bounce, is widely used and
popular (Jazar, 2017). Moreover, the quarter-car
model is also suitable for vibration optimization
purposes (Wong, 2008).
Therefore, this paper aims to investigate how
the progress of separation affects the vertical
dynamics of a 2-degree-of-freedom (2DOF)
quarter-car model and validates the ride comfort
of the system under specific conditions. By
focusing on the tire-road separation with 2DOF,
this study provides a solid foundation for
understanding the basics of vibration dynamics
and serves as a valuable resource for gaining
insights into ride comfort.
2. Vehicle modeling
This section, the focuses on modeling the
progress of separation in a quarter-car system
and the numerical method employed to solve the
dynamic equation system. The separation
phenomenon is incorporated into the model to
capture its effects on the system's behavior.
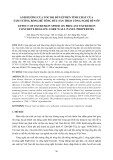
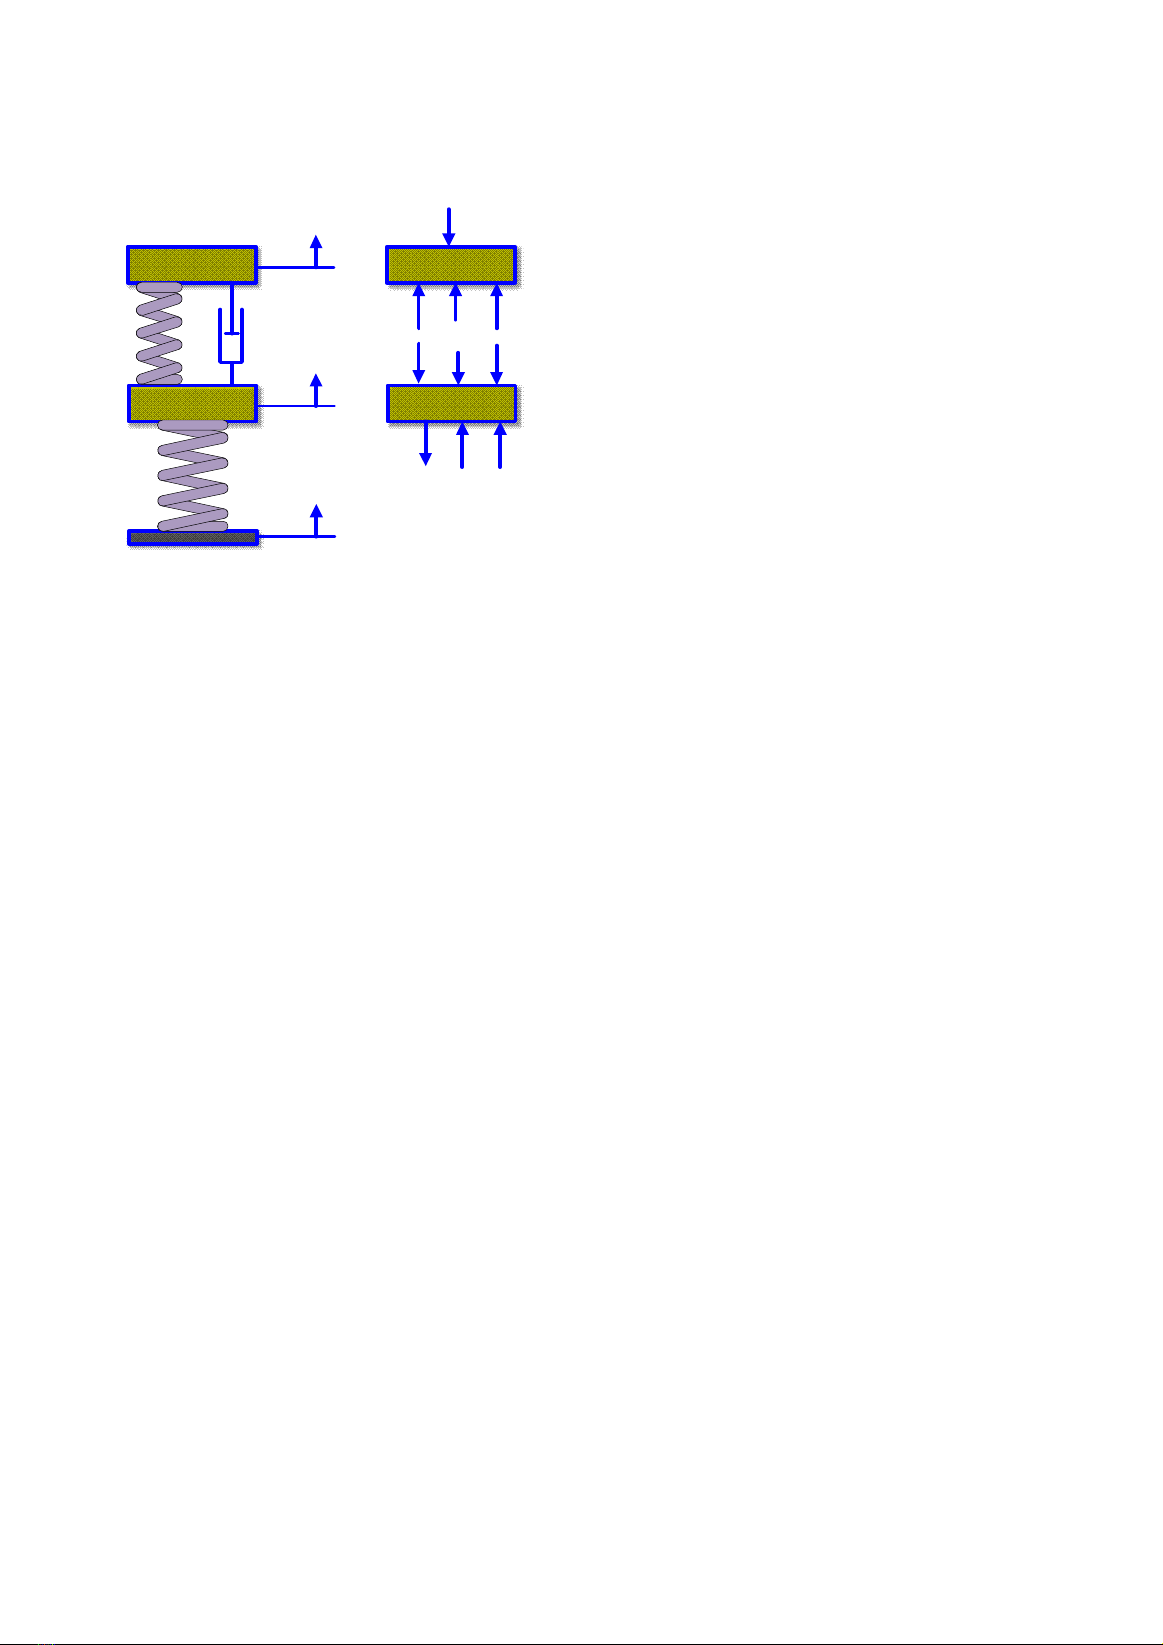
2.1. Dynamic Equations of Motion
In order to obtain the dynamic equations of
motion, we analyze the free-body diagram of
the masses at a particular moment, as shown in
Figure 1. Note that the forces from the gravity
of the masses cancel with the static spring
Journal of Water Resources & Environmental Engineering - No. 87 (12/2023)
26
forces. Next, we will examine the free-body
representation to derive the equations of motion
for each component.
m
s
m
u
x
s
x
u
y
c
s
k
s
k
u
m
s
m
u
F
s
F
c
F
u
F
st
W
s
W
u
F
Ts
Figure 1. Quarter-car model and free body
diagram
Applying Newton’s second law of motion,
the vertical response of sprung mass may be
expressed in equation form as follows:
s s C S ST S
m x F F F W
(1)
where, the component forces acting upon the
sprung mass as known:
( )
c s u s
F c x x
is the damping force.
( )
s s u s
F k x x
is the spring force.
st s
F m g
is the static spring
compressive force.
s s
W m g
is the sprung mass’s weight.
Substituting the existing force into equation
(1), the equation of motion of the sprung might
be written as:
( ) ( ) 0
s s s s u s s u
m x c x x k x x
(2)
For the in-contact state, application of the
second law to the unsprung mass leads to:
u u C S U ST U Ts
m x F F F F W F
(3)
Again, the component forces acting inversely
upon the unsprung mass can be obtained:
( )
u u u
F k y x
is the tire spring force.
u u
W m g
is the unsprung mass’s weight.
( )
T s u ST s u
F k x m m g
is the static
compressive force of the tire, where,
ST
x
is the
static tire deflection.
Thus, the equation of motion of unsprung
massin the contact state:
( ) ( )
u u s u s u s u s s u
m x c x x k k x k x k y
(4)
Separation condition is:
u ST
x y x
no contact (5)
u ST
x y x
in contact (6)
When the tire looses contact with the road,
0
T s
F
,
0
U
F
(Khazaie, 2018), thereby, the
equation of the unsprung mass will be:
( ) ( ) ( ) 0
u u s u s s u s u s
m x c x x k x x m m g
(7)
One of the major limitations of quarter-car
models without separation assumption is the
linearity. However, the differential equations
governing the system here are switched from (2)
and (4) to (2) and (7) for the sprung and
unsprung masses respectively when the
separation condition (5) and (6) happens.
Therefore, the system would be nonlinear and
more complicated.
To investigate vertical vibrations in the
dimensional field, assuming that a periodically
varying ground excitation with period
2 /
and the system vibrates harmonically with a
function
0
sin( )y y t
, where
0
y
is the road
amplitude,
is the input frequency.
2.2. Solving method
By employing these numerical methods, the
dynamic equation system is solved iteratively
over time, capturing the progress of separation
and its impact on the overall system response.
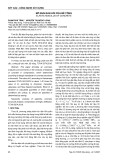
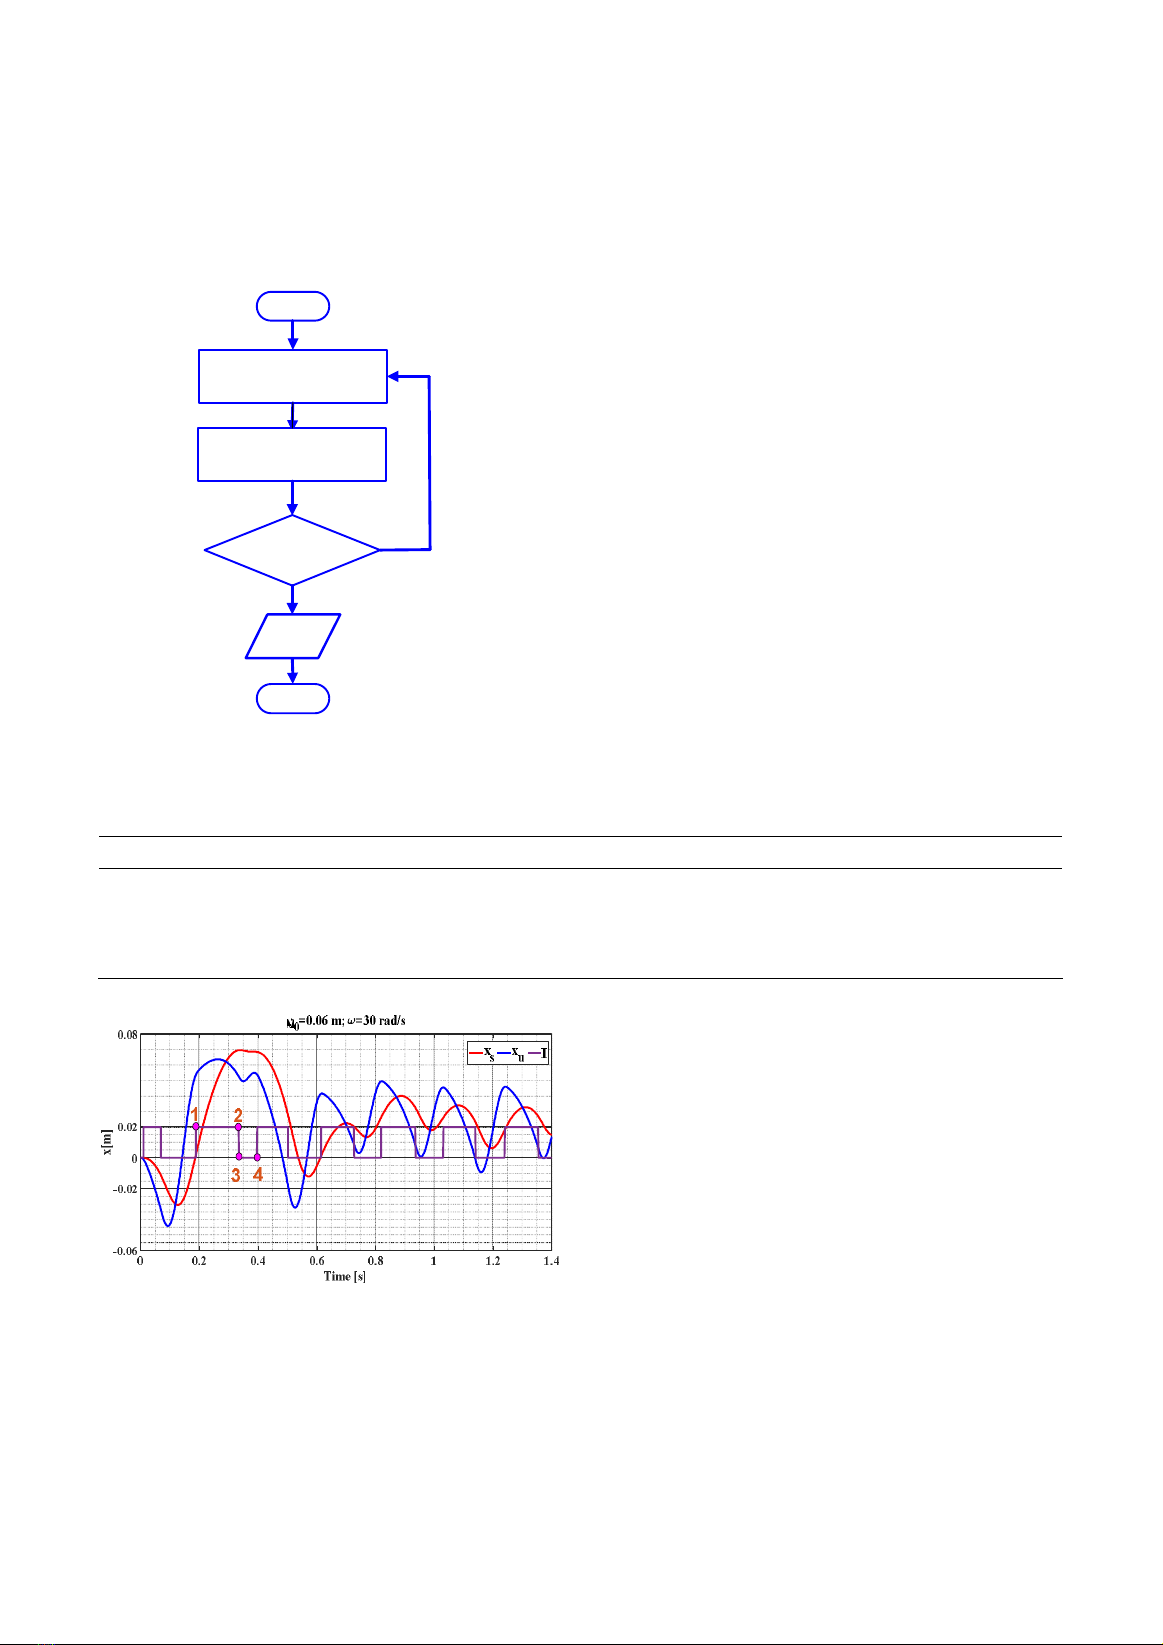
To solve the governing equation system of
motion, this study uses a loop in MATLAB
software throughout the complete interval. The
ode45 method is utilized, which automatically
adjusts the resolution across the investigation
time by dividing the time interval into smaller,
adequately spaced steps to generate evaluation
points. Using the provided input data, the solver
examines the separation condition for each
Journal of Water Resources & Environmental Engineering - No. 87 (12/2023)
27
interval instance and assigns a value of 0.02 to
an indicator variable when there is no contact
and a value of 0 when there is contact. The
program follows the flow chart presented below
during execution.
Start
Initial Condition
End
Evaluate Equations No
Yes
Separation
Condition
Data
Figure 2. Flow chart for Time Response Program
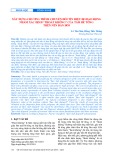
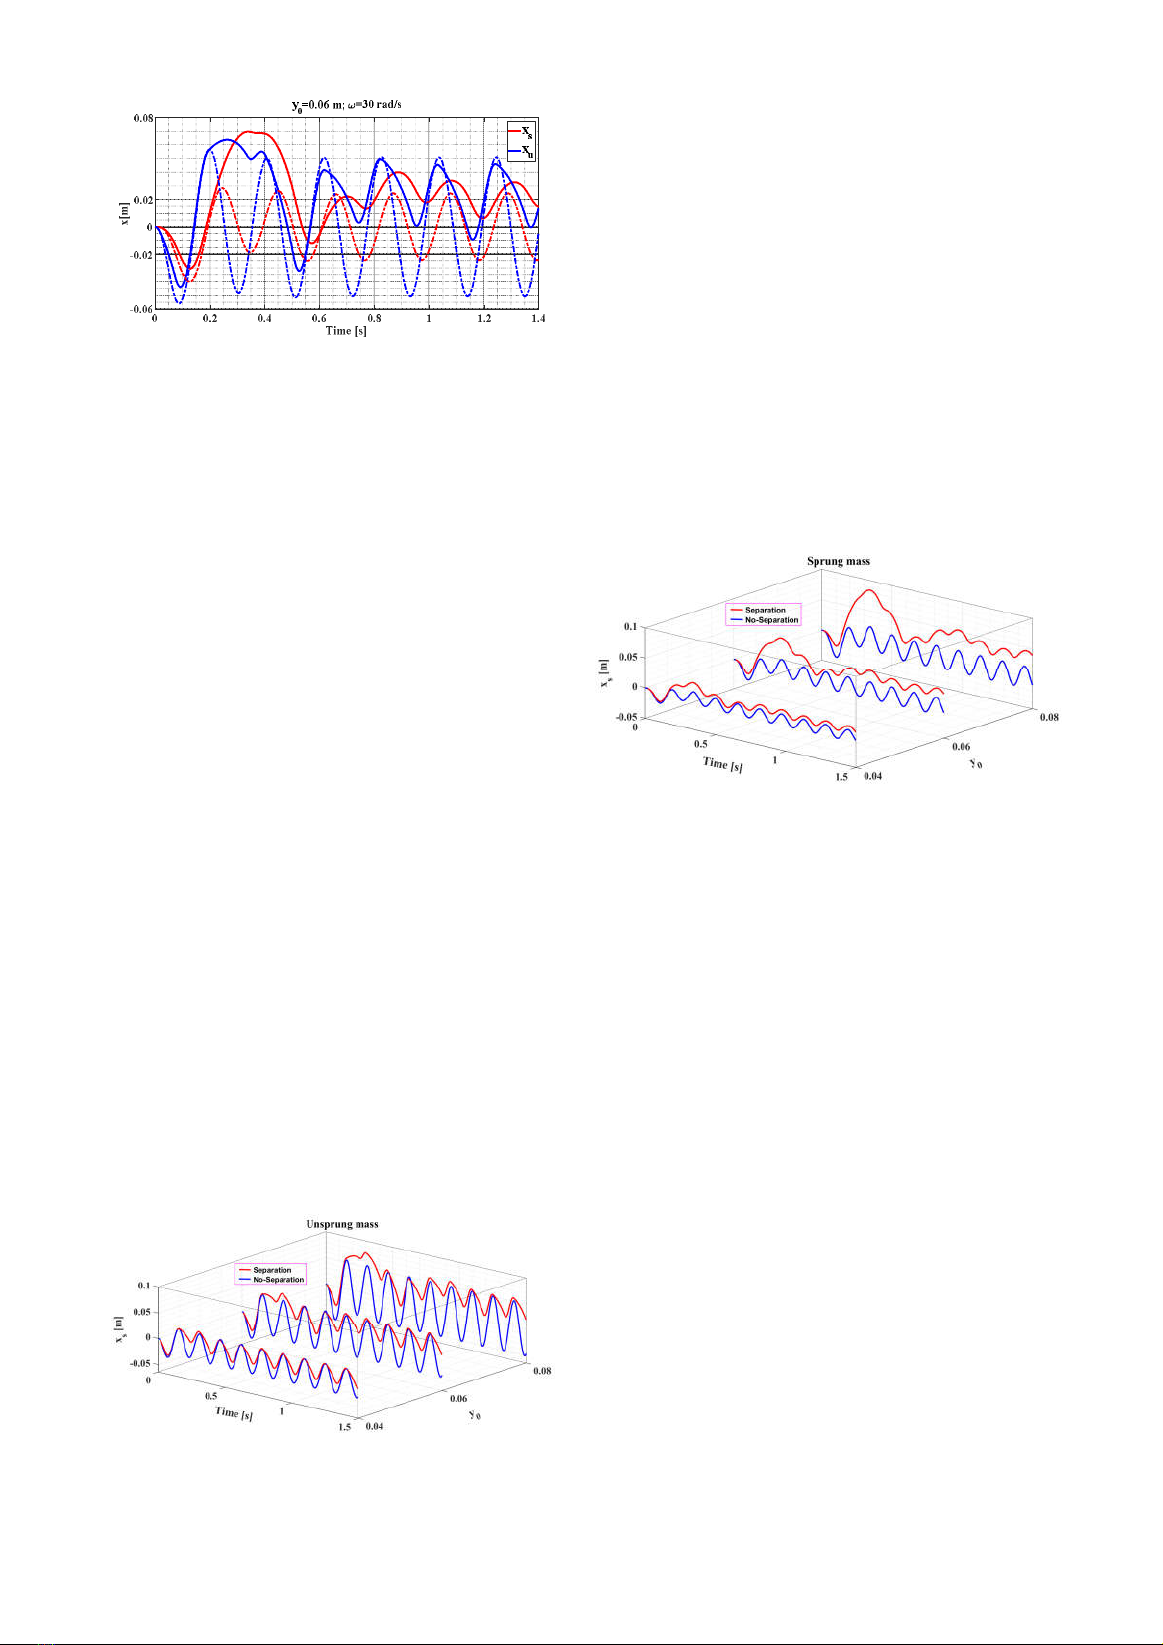
3. Results and discussion
By utilizing the parametric inputs provided
for a practical quarter-car model in Table 1
(Alvarez-Sánchez, 2013), the simulation
program generates a time response considering
the assumption of no contact, as depicted in
Figure 3. The separation dynamics are observed
in response to a sinusoidal input with an
amplitude of 0.06m and a frequency of 30rad/s.
Two distinct curves can be seen for the
unsprung and sprung masses. Initially, the
vertical displacements experience a sudden
jump, reaching approximately 0.08m, then
stabilize to a steady-state separation. To observe
a no-contact period, the study employs an
indicator variable, denoted as I. In this case, the
indicator takes a value of 0.02 during the
interval from point 1 to point 2, indicating the
presence of separation, while the tire makes
contact with the road profile (I=0) from point 3
until point 4.
Table 1. The parameters of a quarter-car model.
Parameter Value [Unit] Parameter Value [Unit]
s
m
208 [kg]
s
k
18709 [N/m]
u
m
28 [kg]
u
k
127200 [N/m]
s
c
3000 [Ns/m]
ST
x
2.7 [mm]
Figure 3. Time response with tire-road
separation
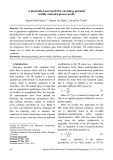
When the tire loses contact with the road, the
displacements of the sprung and unsprung
masses (
s
x
and
u
x
) behave unpredictably in a
linear system. Using the input data in Figure 3,
Figure 4 illustrates an example of the changes in
s
x
and
u
x
. The solid curves represent the
displacements of the actual system, while the
dotted curves show the displacements without
considering the separation assumption. These
curves only coincide during each contact period
(I = 0), indicating that the assumptions of
contact and no-contact align at those points.
However, outside of those periods, the
displacements of the real system and the system
without the separation assumption differ
significantly.
Journal of Water Resources & Environmental Engineering - No. 87 (12/2023)
28
Figure 4. Comparison of displacements
between contact and no-contact consideration.
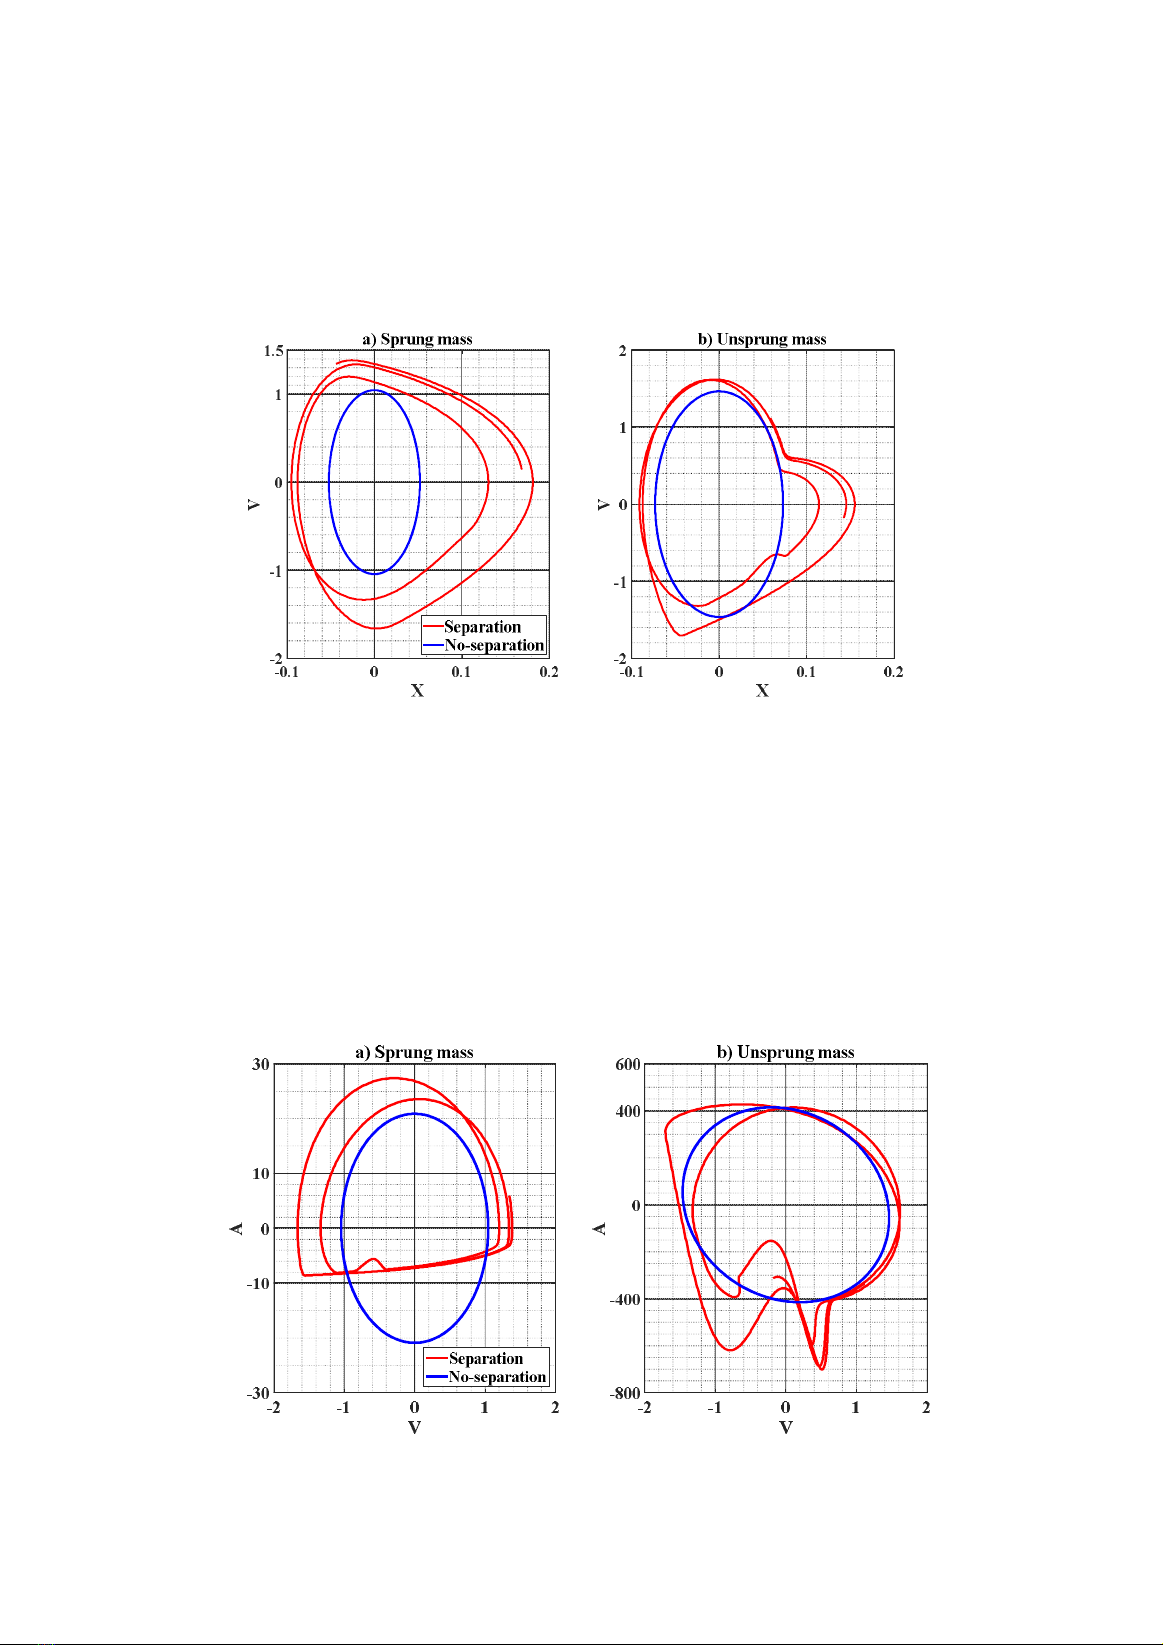
Furthermore, the research conducted
simulations to study the separation phenomenon
across a wide range of road amplitudes. A series
of time responses of the unsprung mass
s
x
can
be seen from Figure 5 which exhibit multiple
displacements simultaneously in response to a
high-frequency excitation of ω = 40rad/s. These
displacements are depicted in three planes
denoted by
0
y
. The value of the road amplitude
0
y
has a significant impact on the deflection of
the unsprung mass, causing it to increase from
0
0.04y m
to
0
0.08y m
. During tire contact
with the road surface, all dynamic behaviors
appear to exhibit harmonic responses. However,
there are notable differences between the real
systems with separation consideration and those
without. Unexpected effects on vertical ride
comfort have been greatly reduced at high
amplitudes of road excitation when separation is
taken into account. This highlights the
importance of accounting for separation when
analyzing the phase portraits and understanding
the true behavior of the system.
Figure 5. Series of time response for unsprung mass
Among all the factors influencing passenger
comfort, the vibrations of the sprung mass play
a vital attention as they generate vertical forces
on the human body. Thus, the dynamic response
of the sprung mass has been analyzed for
different road excitations, as depicted in Figure
6. It is observed that the vertical displacement of
the sprung mass, taking into account the
separation assumption, is significantly greater
than the original displacement. This emphasizes
the importance of incorporating the effects of
tire-road separation when analyzing the
behavior of such systems.
Figure 6. Series of time response for sprung mass
Phase plane analysis is a highly useful and
widely adopted method for studying the
behaviors of nonlinear systems. It involves
creating a phase portrait, which is typically a
two-dimensional plot in the configuration space
of the dynamic system. This plot illustrates the
trajectories of the system in terms of two
systemic state variables when the model is
initialized with various initial conditions. In the
case of tire-road separation, the nonlinearity of
the system causes the trajectories of the
dynamic response to deviate from those of the
linear system that does not consider the
separation assumption.
Figure 7 presents phase portrait graphs in
the dimensional field, excluding the transient
period. The phase portraits illustrate the
relationship between the vertical
displacement X and vertical velocity V.
Journal of Water Resources & Environmental Engineering - No. 87 (12/2023)
29
Figures 7a and 7b precisely depict the phase
portraits for the sprung and unsprung masses,
respectively. Without of the separation
assumption, the displacement and velocity
exhibit harmonic outputs, resulting in an
elliptic relationship in the phase portraits.
However, in a real system that considers the
effects of separation, this relationship
undergoes changes. The presence of tire-road
separation introduces nonlinear dynamics
that can alter the shape and characteristics of
the phase portraits.
Figure 7. Phase portraits in a no-contact zone.
Acceleration plays a significant role in
assessing vehicle ride comfort. Figure 8 displays
two phase portraits depicting the relationship
between velocity and acceleration of the sprung
and unsprung masses. In a similar fashion to the
previous analysis, when considering the
separation phenomenon, the dynamic response
exhibits chaotic behavior and deviates
substantially from the elliptical trajectories
observed in the absence of separation. This
highlights the impact of separation on the
acceleration patterns and emphasizes the need to
account for it when evaluating vehicle ride
comfort.
Figure 8. Phase portraits between acceleration and velocity