
RESEARC H Open Access
Regulation of hypoxia inducible factor-1a
expression by the alteration of redox status in
HepG2 cells
Wen-sen Jin
1*
, Zhao-lu Kong
2
, Zhi-fen Shen
2
, Yi-zun Jin
2†
, Wu-kui Zhang
1
and Guang-fu Chen
1
Abstract
Hypoxia inducible factor-1 (HIF-1) has been considered as a critical transcriptional factor in response to hypoxia. It
can increase P-glycoprotein (P-Gp) thus generating the resistant effect to chemotherapy. At present, the
mechanism regulating HIF-1ais still not fully clear in hypoxic tumor cells. Intracellular redox status is closely
correlated with hypoxic micro-environment, so we investigate whether alterations in the cellular redox status lead
to the changes of HIF-1aexpression. HepG2 cells were exposed to Buthionine sulphoximine (BSO) for 12 h prior to
hypoxia treatment. The level of HIF-1aexpression was measured by Western blot and immunocytochemistry
assays. Reduce glutathione (GSH) concentrations in hypoxic cells were determined using glutathione reductase/5,5
’
-
dithiobis-(2-nitrob-enzoic acid) (DTNB) recycling assay. To further confirm the effect of intracellular redox status on
HIF-1aexpression, N-acetylcysteine (NAC) was added to culture cells for 8 h before the hypoxia treatment. The
levels of multidrug resistance gene-1 (MDR-1) and erythropoietin (EPO) mRNA targeted by HIF-1ain hypoxic cells
were further determined with RT-PCR, and then the expression of P-Gp protein was observed by Western blotting.
The results showed that BSO pretreatment down-regulated HIF-1aand the effect was concentration-dependent,
on the other hand, the increases of intracellular GSH contents by NAC could partly elevate the levels of HIF-1a
expression. The levels of P-Gp (MDR-1) and EPO were concomitant with the trend of HIF-1aexpression. Therefore,
our data indicate that the changes of redox status in hypoxic cells may regulate HIF-1aexpression and provide
valuable information on tumor chemotherapy.
Keywords: Hypoxia Redox, Multidrug resistance, HepG2
Introduction
The majority of transcriptional responses in cells to
hypoxia are mediated by hypoxia inducible factor-1(HIF-
1), a heterodimeric protein that consists of the steadily
expressed HIF-1b/ARNT and the highly regulated HIF-
1asubunits. The HIF-1asubunit, under normoxic con-
ditions, is hydroxylated by prolyl hydroxylasamses
(PHDs) at praline residues 402 and 564 in the oxygen-
dependent degradation (ODD). Then it is targeted for
proteasome-mediated degradation through a protein ubi-
quitin ligase complex containing the product of the von
Hippel Lindau tumor suppressor (pVHL) [1,2]. Many
data revealed that there was a rapid biodegradation of
HIF-1aprotein within 5-10 min when hypoxic condition
was changed into normoxic condition; furthermore the
expression of HIF-1aprotein was undetectable by the
end of 30 min in normoxia [3,4]. In contrast, the degra-
dation pathway is blocked when cells are exposed to a
hypoxic environment, thereby allowing HIF-1ato accu-
mulate and migrate to the nucleus, where more than 100
genes have been identified as direct targets of HIF-1a
[5,6]. Among these genes, many are responsible for the
physiological or pathophysiological activities of hypoxic
cells, including cell survival, glucose metabolism, glycoly-
sis and therapeutic resistance [7-9].
The expression level of HIF-1ais regulated by differ-
ent factors involving cell signal transduction pathway,
cytokines, heat-shock protein 90, reaction oxygen (ROS)
and nitric oxide (NO) [10-13]. It is well known that
* Correspondence: wensenjn@139.com
†Contributed equally
1
Teaching & Research Section of Nuclear Medicine, An-hui Medical
University, Hefei, China
Full list of author information is available at the end of the article
Jin et al.Journal of Experimental & Clinical Cancer Research 2011, 30:61
http://www.jeccr.com/content/30/1/61
© 2011 Jin et al; licensee BioMed Central Ltd. This is an Open Access article distributed under the terms of the Creative Commons
Attribution License (http://creativecommons.org/licenses/by/2.0), which permits unrestricted use, distribution, and reproduction in
any medium, provided the original work is properly cited.

intracellular antioxidant systems, such as reduce glu-
tathione (GSH), superoxide dismutase, glutathione per-
oxide, etc, can scavenge the excess ROS and sustain the
redox equilibrium in cells [14]. Studies have shown that
GSH play a role in protecting cells from oxide free radi-
cals, ROS and nitrogen radicals [15-17]. It is, therefore,
possible that the level of HIF-1aexpression may be
regulated by modifying the redox status of hypoxic cells.
To test this hypothesis, we used redox reagents to
alter the contents of intracellular GSH, which resulted
in the changes of redox status in hypoxic cells, then to
evaluate whether the modifications of redox status in
hypoxic cells can regulate HIF-1aprotein levels.
Materials and methods
Cell viability assay (MTT)
The effect of BSO on tumor cell growth was determined
using an MTT colorimetric assay [18]. Cells were seeded
in 96-well plates at a density of 5 × 10
3
cells per well.
They were, then, treated with different concentrations of
BSO for 12 h. Furthermore, the medium was replaced
with fresh medium allowing cells to be continuously
grown up to 72 h. The 3-(4,5-dimethylthiazol-2-yl)-2,5-
diphenyltetrazo-lium bromide (MTT, Sigma) dye was
added to a final concentration of 50 mg/ml and cells
were subsequently incubated for another 4 h at 37°C.
The media containing residual MTT dye was carefully
aspirated from each of the wells and 200 μlDMSOwas
added to each well to dissolve the reduced formazan
dye. The effect of BSO on the growth of cells was deter-
mined from differences in absorbance. The fraction of
cells viability was calculated by comparing the optical
absorbance of culture given a BSO treatment with that
of the untreated control.
Cells culture and treatment
HepG2 cells (Cell Bank, Chinese Academy of Sciences)
were cultured in RPMI-1640 medium (GIBCO BAL,
USA) supplemented with 10% FBS, penicillin (100 U/
ml), streptomycin (100 μg/ml) at 37°C in an incubator
containing humid atmosphere of 95% air and 5%CO
2
and propagated according to protocol given by the
American Type Culture Collection. Hypoxic treatment
was in a controlled chamber maintained with 1% O
2
,
99%N
2
for 4 h. The medium was changed prior to
experiments. To investigate the effect of redox state on
the hypoxia induction of HIF-1aexpression, the cells
were cultivated for 12 h in the absence or presence of
50 μM, 100 μMand200μM DL-Buthionine sulphoxi-
mine (BSO, Sigma, USA) before the 4-h hypoxia treat-
ment. In addition, 5 mM N-acetylcysteine (NAC)
(Sigma, USA), an antioxidant and GSH precursor, was
used to culture cells for 8 h before hypoxia to further
confirm the mechanism of BSO modulating the
expression of HIF-1aby the changes of micro-environ-
ment redox status in the cells.
Intracellular GSH assay
After the triplicate samples of 10
6
cells were treated
under different conditions, The GSH/GSSG ratios were
measured with the glutathione reductase/5,5
’
-dithiobis
-(2-nitrobenzoic acid) (DTNB) recycling assay kit (Beyo-
time, China) under the methods recommended by the
manufacturer. The standard sample and checking sam-
ple cuvettes were placed into a dual-beam spectrophot-
ometer, and the increases in absorbance at 412 nm were
followed as a function of time. The standard curves of
total glutathione and GSSG concentrations were fitted
with absorbance, followed by determining the concen-
tration of checking samples. Concentrations were con-
verted to nmol/mg protein, and reduced GSH
concentrations were obtained by subtracting two times
GSSG from total glutathione. Finally, GSH/GSSG ratio,
with different treatment, was calculated through cellular
GSH concentration divided by GSSG concentration.
RNA purification
Cells were lysed by TRIzol Reagent and RNA was
extracted according to manufacturer’s instruction (San-
gon, China). To avoid genomic DNA contamination,
extracted RNA was then purified with the RNeasy kit
(Invitrogen, USA). The quantity and quality of RNA was
determined by the OD measurement at 260 and 280
nm. The integrity of RNA was checked by visual inspec-
tion of the two rRNAs 28S and 18S on an agarose gel.
RT-PCR
Two micrograms RNA was used for cDNA synthesis
using Olig-(dt)
18
as primer and AMV reverse transcrip-
tase. The RT reaction was started with 10 min incuba-
tion at room temperature, and then at 42°C for 60 min,
followed by 10 min at 70°C to terminate the reaction.
Subsequently, a 2 μl aliquot of cDNA was amplified by
PCR in a total volume of 25 μl containing 2.5 μl10×
PCR buffer (0.2 M Tris-HCl, pH 8.4, 0.5 M KCl), 0.2
mM dNTP mix, 1.5 mM MgCl
2
,0.2μM of each primer
and 1.25 units of Platinum Taq DNA polymerase (Invi-
trogen, USA). The thermal cycler was set to run at 95°C
for 5 min, 30 cycles of 94°C for 30 s, 52°C for 30 s, 72°C
for 1 min, and a final extension of 72°C for 10 min. The
primers specific for multidrug resistance gene-1 (MDR-
1) and erythropoietin (EPO) (MDR-1 upstream: 5’-CCA
ATGATGCTGCTCAAGTT-3’; downstream: 5’-GTTC
AAACTTCTGCTCCT GA-3’; 297-bp fragment; EPO
upstream: 5’-ATATCACTGTCCCAGACACC-3’;down-
stream: 5’-AGTGATTGTTCGGAGTGGAG-3’;290-bp
fragment) were used, and for b-actin (upstream: 5’-GTT
GCGTTACACCCTTTCTTG-3’;downstream:5’-GACT
Jin et al.Journal of Experimental & Clinical Cancer Research 2011, 30:61
http://www.jeccr.com/content/30/1/61
Page 2 of 9

GCTGT CACCTTCACCGT-3’; 157-bp fragment) were
as control. PCR products were analyzed by electrophor-
esis in 1.2% agarose gel. The specific bands were visua-
lized with ethidium bromide and digitally photographed
under ultraviolet light, furthermore scanned using Gel
Documentation System 920 (Nucleo Tech, San Mateo,
CA). Gene expression was calculated as the ratio of
mean band density of analyzed specific products to that
of the internal standard (b-actin).
Western blot analysis of HIF-1aexpression
Cells were scraped off from culture flasks and lysed in
lysis buffer containing 10% glycerol, 10mMTris-HCL(PH
6.8), 1%SDS, 5 mM dithiothreitol (DTT) and 1× com-
plete protease inhibitor cocktail (Sigma, USA). The
method of Bradford was used to assay concentrations of
protein in diverse samples. Protein concentration was
measured using an auto multifunction microplate
reader. Fifty micrograms of cellular proteins were sepa-
rated by 8% polyacrylamide-SDS inconsecutive gel elec-
trophoresis. The separated proteins were
electrophoretically transferred to polyvinylidene difluor-
ide membrane. Membranes were blocked with a 5%
skim milk in Tris-buffered saline (TBS) containing 0.1%
Tween 20 at room temperature for 1 h and then incu-
bated with mouse anti-human monoclonal HIF-1a
(Abcam, USA) at a 1:500 dilusion and P-glycoprotein
(P-Gp) antibody (Abcam, USA) at a 1:200 dilusion over-
night at 4°C, followed by goat anti-mouse IgG for 1 h at
room temperature. Signals were detected with enhanced
chemiluminescence (ECL plus, Amersham, USA).
Microtubule protein (Tubulin, Abcam, USA) at a 1:1000
dilution was used as internal control to observe the
changes of HIF-1aand MDR-1 bands.
Immunocytochemistry analysis of HIF-1aexpression
Cells grew on coverslips in 6-well culture dishes to
approach 70% confluence; they were then treated with
BSO and NAC as above description, following 4 h
hypoxic treatment. After the medium was completely
removed by suction, the cells were rinsed briefly with
phosphate buffer saline (PBS). Then, 4% Formaldehyde
was used to fix the cells on coverslips for 10 min at
room temperature, and then methanol fixed the cells for
10 min at -20°C. To utilize 0.5% TritonX-100 enhanced
permeabilizations of the cells for 10 min at room tem-
perature. The coverclips were pre-incubated with 3%
hydrogen peroxide (H
2
O
2
)-methyl alcohol mix solution
for 10 min to block endogenous peroxidase activity, fol-
lowed by incubation for 30 min with block solution at
room temperature. Cells were incubated with primary
antibody, a mouse anti-human monoclonal HIF-1aanti-
body, at a 1:1300 dilution overnight at 4°C. Then cells
were incubated with biotinylated secondary antibody,
followed by a routine immunoperoxidase processing.
After washed twice with PBS, these coverslips were
developed using diaminobenzidine (DAB) as a chromo-
gen, rinsed, gradient dehydrated by alcohol, and then
mounted on slides. The coverslips without primary anti-
body treatment was regarded as the negative control. H-
score values were used as a semi-quantitative evaluation
for immunocytochemistry [19].
Statistical analysis
Data were reported as the means ± SEM of three sepa-
rate experiments. Statistical significance was measured
by independent sample ttest and analysis of variance. A
value of p< 0.05 was considered as statistically
significant.
Results
Selection of sublethal concentration of BSO
In order to select the appropriate concentration of BSO
for the study, a 12 h dose-response study was conducted
by exposing cells to different concentrations of BSO.
Cell viability was measured by the MTT assay. The
results showed that there was not significant decrease in
viability over a 12 h exposure to BSO concentration ran-
ging from 12.5 to 200 μM (Figure 1). In subsequent stu-
dies, the concentrations of BSO used were set at 50,
100, 200 μM.
Variations of intracellular redox status
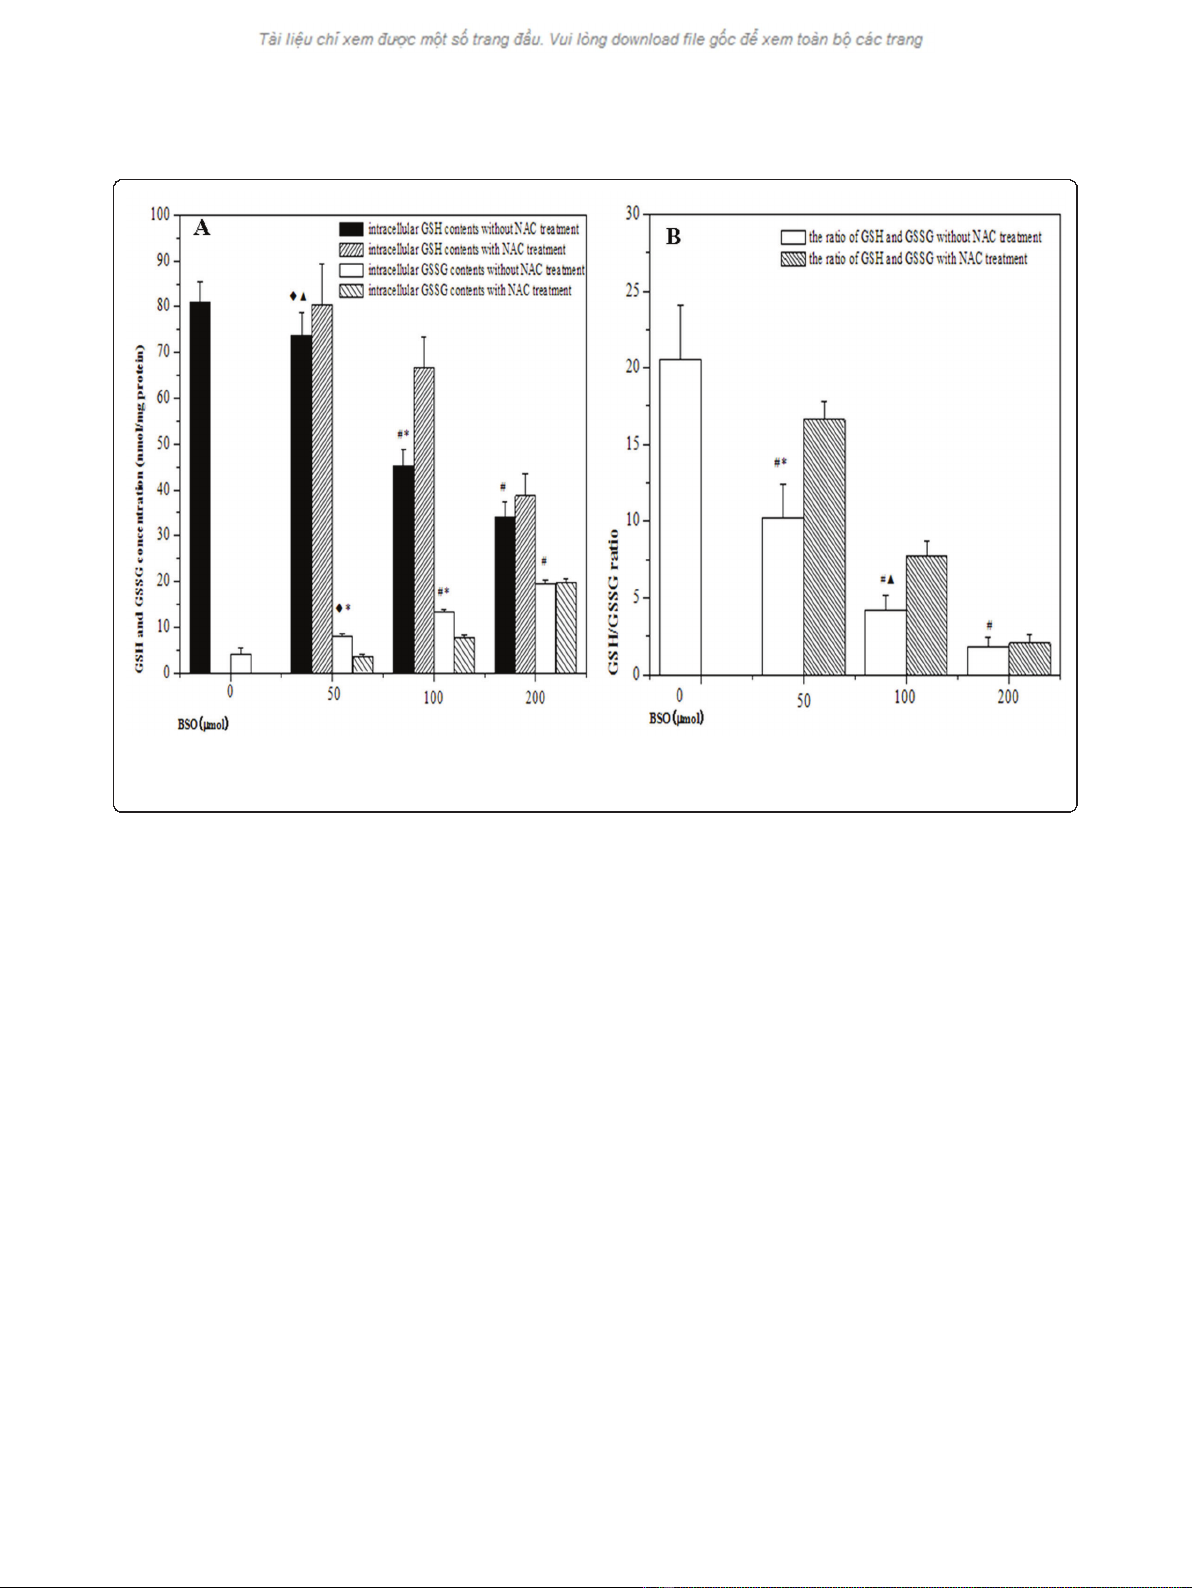
As shown in Figure 2, BSO treatment led to significant
reduction of intracellular GSH level and the effect was
in a concentration-dependent manner. Intracellular
GSSG contents were increased concomitant with BSO
concentrations, resulting to subsequent reductions of
GSH/GSSG ratios. The declines of GSH level were par-
tially restored from hypoxic cells by the addition of 5
mM NAC prior to hypoxia. Compared with the cells in
the absence of NAC, there was an increase in GSH/
GSSG ratio in the presence of 5 mM NAC. It indicated
that BSO inhibited the accumulation of GSH in cells,
but the effect could be partially reversed by NAC
treatment.
Effect redox status on HIF-1aexpression
HIF-1aprotein levels were measured using Western
blot after BSO pretreatment. When BSO concentration
reachedat50μM, the down-regulation of HIF-1a
expression, under the hypoxia condition, was observed
in HepG2 cells. It is then very clear that HIF-1apro-
teins in hypoxic cells were significantly decreased with
BSO concentrations gradually increasing. In addition,
the inhibition of HIF-1aexpression was reversed by 5
mM NAC supplement. However, we also found that
NAC failed to elevate the level of HIF-1aexpression
Jin et al.Journal of Experimental & Clinical Cancer Research 2011, 30:61
http://www.jeccr.com/content/30/1/61
Page 3 of 9
inhibited by BSO concentration at 200 μM. These
results were shown in Figure 3
To further verify the effect of redox status on HIF-1a
levels, we detected the expressions of HIF-1aproteins
by using immunocytochemistry technique (ICC). As
shown in Figure 4, cells showed more negative staining
than control group after BSO pretreatment and NAC
decreased the inhibition. The results were basically con-
sistent with Western blot result.
Changes of genes targeted by HIF-1
The levels of MDR-1 and EPO transcription were
detected through semi-quantitative RT-PCR. The results
displayed that the levels of MDR-1 and EPO mRNA
were declined in hypoxic cells when BSO concentration
was at 50 μM,butitwasn’t shown that there was a sta-
tistical significance at the MDR-1 and EPO mRNA of 50
μM BSO pretreatment compared with those of the
hypoxic control. Concomitant with the increases of BSO
concentrations, the levels of MDR-1 and EPO mRNA in
hypoxic cells were gradually decreased. And then the
inhibitory effects on MDR-1 and EPO mRNA, BSO con-
centrations reaching at 100 μMand200μM respec-
tively, were shown statistical differences. Meanwhile,
NAC could reduce the inhibition of BSO to MDR-1 and
EPO mRNA. Furthermore, the expression of P-gp by
MDR-1 translation, tested with western blotting, was
also confirmed with the change of MDR-1 mRNA.
Above experimental results were displayed in Figure 5
andFigure6.Itisthereforeclearthatredoxmicro-
environment may influence the levels of target genes
located at the downstream of HIF-1.
Discussion
Among intracellular antioxidative factors, GSH is the
tripeptide thiol L-g-glutamyl-L-cysteinyl-glycine, a ubi-
quitous endogenous antioxidant. It plays an important
role in maintaining intracellular redox equilibrium and
in augmenting cellular defenses in oxidative stress
[20,21]. In above antioxidant response, GSH is con-
verted into glutathione oxidized disulfide (GSSG), which
is recycled back to 2GSH by GSSG reductase, then
forming what is known as a redox cycle. Under normal
condition, the majority of glutathione is in the reduced
form. Shifting redox equilibrium is in favor of a redu-
cing or oxidizing state; that is in modification of the
redox status in cells [22,23]. The g-glutamylcysteine
sythetase (g-GCS) is the key rate-limiting enzyme
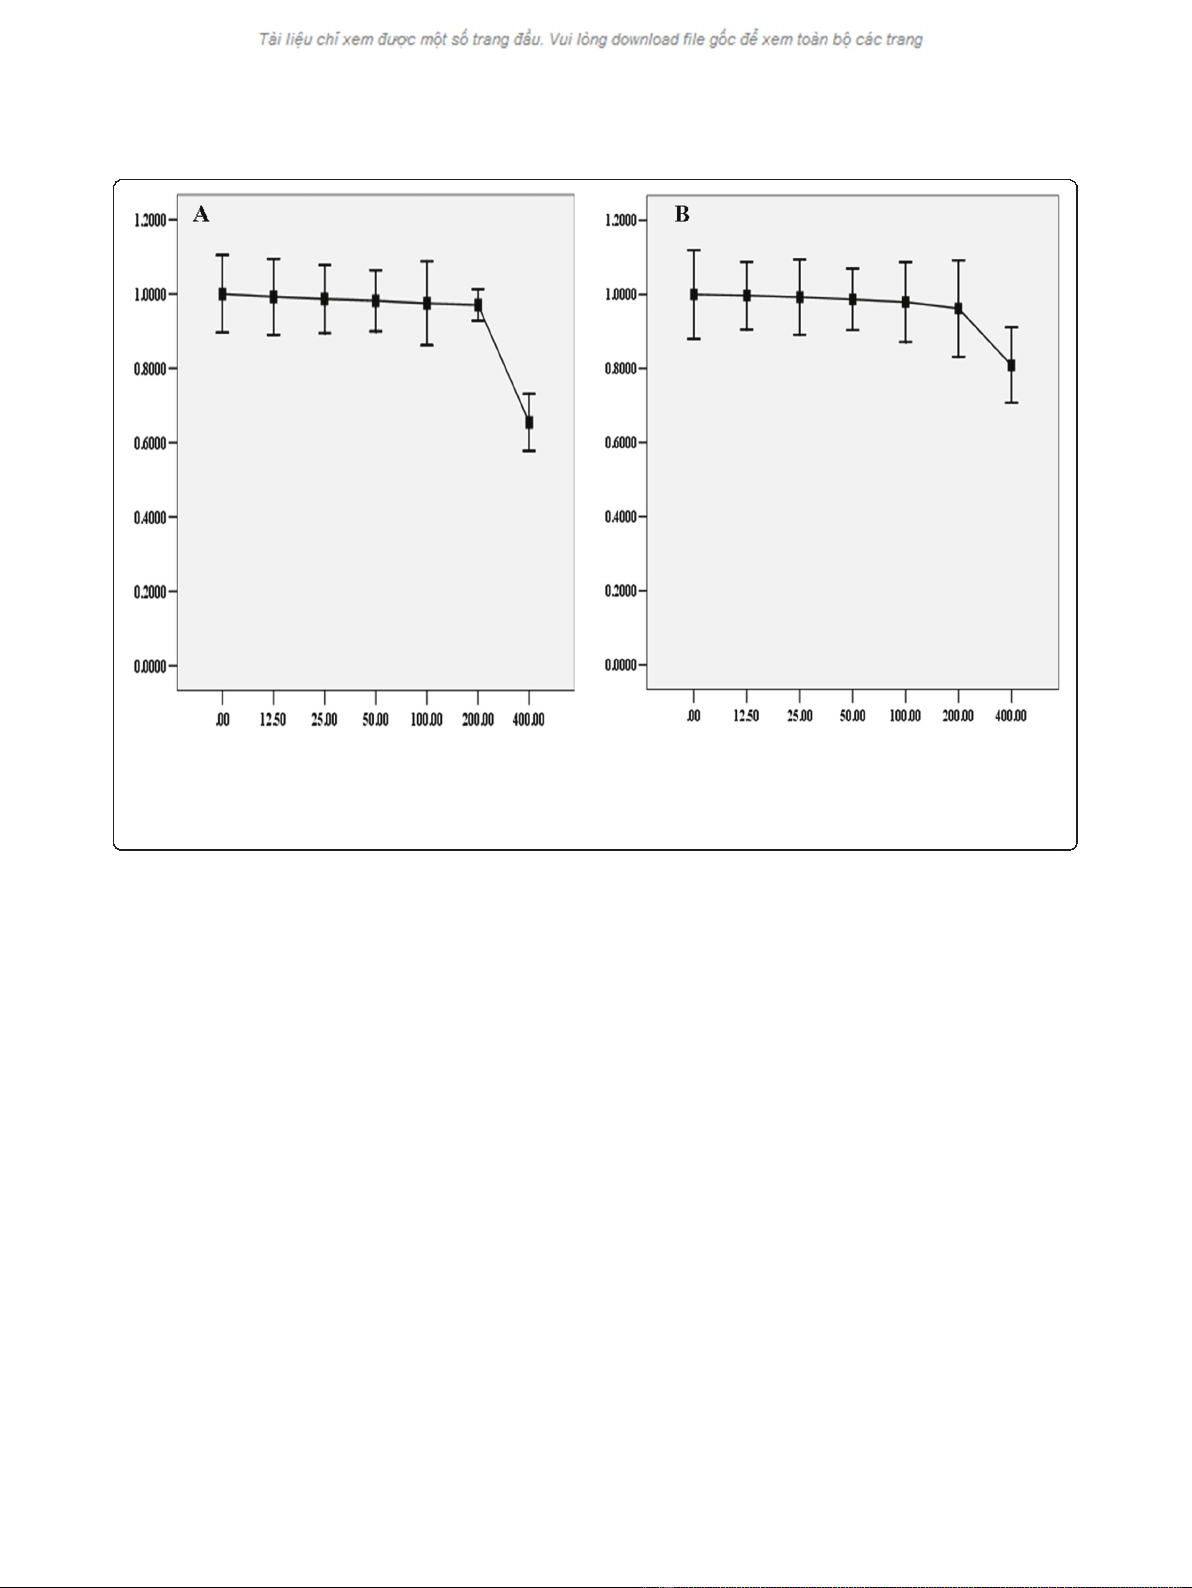
Figure 1 Toxicity of BSO on HepG2 cells. Under normoxic or hypoxic condition, HepG2 cells were treated with different concentration of BSO
for 12 h before subjected to the MTT assay. The viability was calculated by subtracting the background absorbance and divided by the control
absorbance. Both normoxia and hypoxia, the results showed that there was not significance in the decrease of cells viability until the
concentration of BSO was at 400 μM. The change of cells viability, under normoxia or hypoxia, was displayed in Diagram A and Diagram B
respectively.
Jin et al.Journal of Experimental & Clinical Cancer Research 2011, 30:61
http://www.jeccr.com/content/30/1/61
Page 4 of 9
synthesizing intracellular GSH, so intracellular GSH
contents can be decreased by the inhibition of g-GCS
[24,25]. In the present study, our results showed that
BSO, an inhibitor of g-GCS, down-regulated the expres-
sion of GSH under hypoxia condition and the inhibitory
effect was concentration-dependent. Conversely, intra-
cellular GSH contents could be increased by adding
NAC to medium. It is therefore apparent that the ratios
of GSH and GSSG revealed the alterations of redox sta-
tus in hypoxic cells by redox reagents pretreatment.
Interestingly, we also noted that, as a precursor of GSH
biosynthesis, NAC could not significantly decrease the
suppression of GSH contents in the cells by 200 μm
BSO pretreatment. One possibility was that, as high-
concentration of BSO irreversibly suppresses the most
parts of g-GCS activities [24], the synthesis of GSH had
been saturated without conspicuous increased by the
addition of enzyme substrate.
Our following research showed that the down-regula-
tion of HIF-1ain hypoxic cells by different concentra-
tions BSO pretreatment, on the contrary, NAC could
partly decrease the inhibitory effect. Similar to our
results, the previous studies also showed that NAC,
under chemical and physiological hypoxia, increased the
expression of HIF-1aby changing cytoplasmic micro-
environment redox state [26-28]. So it was clear that the
redox status in hypoxic cells could influence the expres-
sion of HIF-1aprotein. Combining the previous
researches with our results, we considered the mechan-
ism, the redox status influencing the expression of HIF-
1a, as following: (i) The biosynthesis of GSH impose a
reducing micro-environment, subsequently prolonging
thehalf-lifeofHIF-1aand protracting its stability in
cytosol and favouring its translocation [28]; (ii) GSH
anti-oxidant system can effectively clear away free radi-
cals and ROS that may suppress the expression of HIF-
1aaccording to many previous studies [29,30]. How-
ever, it should be noted that some recent reports
showed the opposite results, GSH contents being nega-
tive correlation with the levels of HIF-1a[31,32]. Based
on other data, there could be the following factors con-
tributing to these controversial phenomena: (i) Various
cell types and experimental methods were used in differ-
ent studies; (ii) The varies of GSH/GSSG equilibrium in
different cells could exist in a certain range [23]. Exces-
sive reducing status led to the extreme scavenging of
the most of ROS and free radicals in hypoxic cells, but a
bit of ROS generation from mitochondria possibly
induced the expression of HIF-1a[33].
To further judge our finding, the expressions of MDR-
1 and EPO, the down-stream target genes by HIF-1 pro-
moting transcription in hypoxic cells, were observed in
Figure 2 The changes of redox status in hypoxic cells by different pretreatment. (A) showed the alteration of intracellular GSH and GSSG
contents in HepG2 cells under hypoxic condition; (B) showed the ratios of GSH and GSSG in HepG2 cells under hypoxic condition. (
◆
p< 0.05,
#
p
< 0.01, as compared with hypoxia control;
▲
p< 0.05, *p< 0.01, as compared with the cells by NAC treatment).
Jin et al.Journal of Experimental & Clinical Cancer Research 2011, 30:61
http://www.jeccr.com/content/30/1/61
Page 5 of 9


![Vaccine và ứng dụng: Bài tiểu luận [chuẩn SEO]](https://cdn.tailieu.vn/images/document/thumbnail/2016/20160519/3008140018/135x160/652005293.jpg)


%20--%3e%3cdefs%3e%3cstyle%3e%20.st0%20{%20fill:%20%23fff;%20}%20.st1%20{%20fill:%20%237800fa;%20}%20%3c/style%3e%3c/defs%3e%3cpath%20class='st1'%20d='M117.78,12.18H43.11c2.9,3.47,4.65,7.94,4.65,12.82,0,5.6-2.3,10.66-6.01,14.29h76.02l7.22-13.56-7.22-13.56Z'/%3e%3cg%3e%3cpath%20class='st0'%20d='M53.58,26.17h-.59v-1.46h.59v-4.96h2.83c1.78,0,2.67.94,2.67,2.82v5.76c0,1.87-.89,2.81-2.67,2.81h-2.83v-4.96ZM55.36,21.37v3.34h1.1v1.46h-1.1v3.34h1.01c.61,0,.91-.37.91-1.1v-5.93c0-.74-.3-1.1-.91-1.1h-1.01Z'/%3e%3cpath%20class='st0'%20d='M65.99,31.14h-1.8l-.31-2.07h-2.19l-.31,2.07h-1.64l1.82-11.39h2.62l1.82,11.39ZM65.28,18.04c-.25.46-.51.77-.75.94-.21.15-.47.22-.79.22-.26,0-.57-.07-.92-.22l-.38-.15c-.14-.05-.26-.07-.37-.07-.3,0-.53.18-.71.54l-.91-.68c.25-.46.51-.77.75-.94.21-.14.48-.21.79-.21.26,0,.57.07.92.21l.38.15c.14.05.26.07.37.07.3,0,.53-.18.71-.54l.91.68ZM61.91,27.52h1.73l-.87-5.76-.87,5.76Z'/%3e%3cpath%20class='st0'%20d='M74.53,26.89v1.52c0,1.91-.89,2.86-2.67,2.86s-2.67-.95-2.67-2.86v-5.93c0-1.91.89-2.86,2.67-2.86s2.67.95,2.67,2.86v1.11h-1.69v-1.22c0-.75-.31-1.12-.93-1.12s-.93.37-.93,1.12v6.15c0,.74.31,1.11.93,1.11s.93-.37.93-1.11v-1.63h1.69Z'/%3e%3cpath%20class='st0'%20d='M81.4,31.14h-1.8l-.31-2.07h-2.19l-.31,2.07h-1.64l1.82-11.39h2.62l1.82,11.39ZM75.9,19.2l1.52-1.91h1.71l1.51,1.91h-1.61l-.76-.95-.75.95h-1.61ZM77.32,27.52h1.73l-.87-5.76-.87,5.76ZM83.1,15.99l-1.76,1.91h-1.26l1.17-1.91h1.86Z'/%3e%3cpath%20class='st0'%20d='M84.86,19.75c1.78,0,2.67.94,2.67,2.82v1.48c0,1.87-.89,2.81-2.67,2.81h-.85v4.28h-1.79v-11.39h2.64ZM84.01,21.37v3.86h.85c.58,0,.87-.36.87-1.08v-1.71c0-.71-.29-1.07-.87-1.07h-.85Z'/%3e%3cpath%20class='st0'%20d='M93.51,19.75c1.78,0,2.67.94,2.67,2.82v1.48c0,1.87-.89,2.81-2.67,2.81h-.85v4.28h-1.79v-11.39h2.64ZM92.66,21.37v3.86h.85c.58,0,.87-.36.87-1.08v-1.71c0-.71-.29-1.07-.87-1.07h-.85Z'/%3e%3cpath%20class='st0'%20d='M98.8,31.14h-1.79v-11.39h1.79v4.88h2.03v-4.88h1.83v11.39h-1.83v-4.88h-2.03v4.88Z'/%3e%3cpath%20class='st0'%20d='M105.36,24.55h2.46v1.62h-2.46v3.34h3.09v1.63h-4.88v-11.39h4.88v1.63h-3.09v3.18ZM108.17,17.29l-1.76,1.91h-1.26l1.17-1.91h1.86Z'/%3e%3cpath%20class='st0'%20d='M112.2,19.75c1.78,0,2.67.94,2.67,2.82v1.48c0,1.87-.89,2.81-2.67,2.81h-.85v4.28h-1.79v-11.39h2.64ZM111.35,21.37v3.86h.85c.58,0,.87-.36.87-1.08v-1.71c0-.71-.29-1.07-.87-1.07h-.85Z'/%3e%3c/g%3e%3ccircle%20class='st1'%20cx='25'%20cy='25'%20r='20'/%3e%3cpath%20class='st0'%20d='M32.78,19.27c2.92,0,4.43,2.55,5.28,5.33l.71,2.17c.14.38-.33.75-.71.75h-5.61c.19-.33.24-.71.09-1.08l-.75-2.45c-.43-1.32-.99-2.64-1.79-3.77.75-.57,1.65-.94,2.78-.94h0ZM25,18.38c3.25,0,4.9,2.78,5.89,5.89l.76,2.45c.14.42-.33.8-.8.8h-11.69c-.42,0-.94-.38-.8-.8l.75-2.45c.99-3.11,2.64-5.89,5.89-5.89h0ZM25,11.35c1.74,0,3.11,1.37,3.11,3.11s-1.37,3.11-3.11,3.11-3.11-1.41-3.11-3.11,1.41-3.11,3.11-3.11h0ZM17.27,19.27c1.08,0,1.98.38,2.73.94-.8,1.13-1.37,2.45-1.74,3.77l-.8,2.45c-.14.38-.05.75.09,1.08h-5.56c-.42,0-.9-.38-.75-.75l.71-2.17c.9-2.78,2.41-5.33,5.33-5.33h0ZM17.27,12.91c1.51,0,2.78,1.27,2.78,2.83s-1.27,2.83-2.78,2.83-2.83-1.27-2.83-2.83,1.27-2.83,2.83-2.83h0ZM32.78,12.91c1.56,0,2.78,1.27,2.78,2.83s-1.23,2.83-2.78,2.83-2.83-1.27-2.83-2.83,1.27-2.83,2.83-2.83h0ZM27.07,28.56v.09c0,.57-.24,1.08-.61,1.46h0v.05c-.38.33-.9.57-1.46.57s-1.08-.24-1.46-.61h0c-.38-.38-.61-.9-.61-1.46v-.09h1.41v.09c0,.19.05.38.19.47v.05c.09.09.28.19.47.19s.38-.09.47-.19v-.05c.14-.09.24-.28.24-.47t-.05-.09h1.41ZM30.99,28.56v.09c0,1.65-.66,3.16-1.74,4.24-1.08,1.08-2.59,1.79-4.24,1.79s-3.16-.71-4.24-1.79l-.05-.05c-1.04-1.08-1.7-2.55-1.7-4.2v-.09h1.41v.09c0,1.27.47,2.4,1.27,3.25h.05c.85.85,1.98,1.37,3.25,1.37s2.4-.52,3.25-1.37c.85-.8,1.37-1.98,1.37-3.25v-.09h1.37ZM34.99,28.56v.09c0,2.78-1.13,5.28-2.92,7.07-1.79,1.79-4.29,2.92-7.07,2.92s-5.23-1.13-7.07-2.92c-1.79-1.79-2.92-4.29-2.92-7.07v-.09h1.41v.09c0,2.4.94,4.53,2.5,6.08,1.56,1.56,3.72,2.5,6.08,2.5s4.52-.94,6.08-2.5c1.56-1.56,2.5-3.68,2.5-6.08v-.09h1.41Z'/%3e%3c/svg%3e)