intTypePromotion=1
zunia.vn Tuyển sinh 2024 dành cho Gen-Z zunia.vn zunia.vn
ADSENSE

Spectrophotometric assay of pioglitazone hydrochloride using permanganate in acidic and basic media

Chia sẻ: Hoàng Lê Khanh Phong | Ngày: | Loại File: PDF | Số trang:12

12
lượt xem
1
download
 
  Download Vui lòng tải xuống để xem tài liệu đầy đủ

Pioglitazone hydrochloride (PGH) is an oral anti-hyperglycemic agent used in the treatment of type-2 diabetes mellitus. Potassium permanganate was found to oxidize PGH both in acidic and basic conditions, based on which two simple and sensitive methods were developed for its determination in bulk sample and tablets, and validated.

Chủ đề:
Lưu

Nội dung Text: Spectrophotometric assay of pioglitazone hydrochloride using permanganate in acidic and basic media

  1. Current Chemistry Letters 7 (2018) 45–56 Contents lists available at GrowingScience Current Chemistry Letters homepage: www.GrowingScience.com Spectrophotometric assay of pioglitazone hydrochloride using permanganate in acidic and basic media Kanakapura Basavaiaha* and Nagaraju Rajendraprasadb a Department of Chemistry, University of Mysore, Manasagangothri, Myssuru-570 006, Karnataka, India b PG Department of Chemistry, JSS College of Arts, Commerce & Science, B N Road, Mysuru-570 025, Karnataka, India CHRONICLE ABSTRACT Article history: Pioglitazone hydrochloride (PGH) is an oral anti-hyperglycemic agent used in the treatment Received December 22, 2017 of type-2 diabetes mellitus. Potassium permanganate was found to oxidize PGH both in acidic Received in revised form and basic conditions, based on which two simple and sensitive methods were developed for its March 21, 2018 determination in bulk sample and tablets, and validated. In the first method (indirect method), Accepted March 25, 2018 PGH was reacted with a measured excess of standard permanganate in H2SO4 medium, and Available online the residual oxidant was determined by measuring its absorbance at 550 nm. The second March 25, 2018 method (Direct method) entails treating PGH with permanganate in NaOH medium, followed Keywords: by the measurement of the resulting bluish-green manganite at 610 nm. Experimental variables Pioglitazone Determination affecting the reactions were studied and optimized. Under optimum conditions, linear Permanganate relationships with good correlation coefficients were found between absorbance and Spectrophotometry concentration in the ranges, 1.25 – 25 µg mL-1 (Indirect method) and 1-12 µg mL-1 (Direct Pharmaceuticals method) with respective molar absorptivity values of 1.10 × 10⁴ and 2.77 × 10⁴ l mol-1 cm-1. The limits of detection (LOD) and quantification (LOQ) were 0.36 and 1.08 (Indirect method) and 0.23 and 0.69 µg mL-1 (Direct method). Intra-day and inter-day precisions were satisfactory, with %RSD values of ≤2.11, and the respective accuracies were excellent with %RE values of ≤2. The methods were also validated for robustness, ruggedness and selectivity. The methods were applied to the determination of PGH in its tablets with good accuracy and precision, and no interference from the tablet additives was encountered. The results were also compared with those obtained by a reference method. © 2018 Growing Science Ltd. All rights reserved. 1. Introduction Pioglitazone hydrochloride (PGH), chemically known as 5-[[4-[2-(5-ethyl-2-pyridinyl) ethoxy] phenyl] methyl]-2,4-thiazolidinedione monohydrochloride (Fig. 1),1 is an oral anti-hyperglycemic agent.2It addresses the main pathophysiological defects, i.e., insulin resistance, and hence used alone or in combination with insulin, metformin or sulphonyl ureas (glipizide and glibenclamide), as an agent to treat diabetes.3 No monographs are available in any pharmacopeia for assay of this drug. Various analytical methods developed for its determination in pharmaceuticals and biological samples have recently been * Corresponding author. E-mail address: kanakapurabasavaiah@gmail.com (K. Basavaiah) 2018 Growing Science Ltd. doi: 10.5267/j.ccl.2018.03.002      
  2. 46   reviewed.4 Various techniques such as uv-spectrophotometry,5-23 potentiometry,224-26 voltammetry,27-28 high-performance liquid chromatography,29-39 ultra-performance liquid chromatography,40 high- performance thin layer chromatography41-46 and capillary electrophoresis47 have been reported for the determination of PGH in bulk sampleand tablets. Fig. 1. Structure of PGH Visible spectrophotometry is still the most sought-after technique in industrial quality control and research laboratories because of its speed, cost-effectiveness, ease of performance, and fair selectivity and sensitivity. Despite these advantages, technique has been scantily applied for the determination of PGH, with only two reports being found in the open literature9, 10. PGH is reported to form ion-pair complexes with acidic dyes: methyl orange and bromocresol green, in chloroform and these complexes were measured at 267 and 297 nm, respectively, allowing its determination in 2.5 – 20 µg mL-1 range.9 In a similar method10 using bromocresol green as ion-pair agent, the coloured species formed in phthalate buffer of pH 2.4 was extracted into chloroform and absorbance measured at 419 nm. Beer’s law was obeyed over 2.5 -14 µg mL-1 concentration range and the method was applied to tablets. In the first case,9 absorbance is measured in the uv region where the interference from co-formulated substances is expected to be high and the extractive method9 has several disadvantages such as need for pH adjustment, liquid-liquid extraction step and use of large quantities of organic solvents. Thus arises, need for simple, facile and reliable visible spectrophotometric methods for the determination of PGH in pharmaceuticals. In the presence of reducing agent, potassium permanganate gets reduced to different oxidation states in both acidic and basic media. In acidic solution, manganese(VII) is reduced to manganese(II), whereas in basic medium, it gets reduced to manganese(VI) as shown below:48 MnO4- + 8H+ + 5e- = Mn2+ + 4H2O MnO4- + e- = MnO42- The innate intense purple color of permanganate solution which absorbs in the vicinity of 550 nm and the bluish-green color of manganite ion48 with a λmax at 610 nm, the reduced form of permanganate in alkaline medium have been exploited for the spectrophotometric determination of many pharmaceutical compounds.49-60 In spite of its extensive application in pharmaceutical analysis, permanganate, as per the literature, has not been used for the determination of PGH. In this work, permanganate was used as an oxidimetric agent for developing two spectrophotometric methods. In the Indirect method, the residual permanganate was measured at 550 nm, after allowing the reaction between PGH and known amount of oxidant in H2SO4 medium. Whereas in the direct method, the bluish-green color of manganite, the product of reaction between drug and permanganate in alkaline medium, was measured at 610 nm, which served as the basis of the Direct method. The methods were found to be much simpler and more sensitive than the existing spectrophotometric methods. 2. Results and discussion The proposed methods are based on the redox reaction between permanganate and PGH in acid (Indirect method) or in basic (Direct method) medium. In Indirect method, a known excess of standard KMnO4 was added to PGH in acid medium followed by the determination of the residual oxidant by measuring its absorbance at 550 nm. The decrease in absorbance at 550 nm with respect to water blank was taken as the measure of PGH concentration. In Direct method, K2MnO4 resulting from the
  3. K. Basavaiah and N. Rajendraprasad / Current Chemistry Letters 7 (2018) 47 reduction of KMnO4 by PGH in alkaline medium was measured at 610 nm and related to PGH concentration. The possible reaction pathways and basis of assays are given in Scheme 1. + Oxidation product of PGH + Mn2+ + Unreacted KMnO4 H Absorbance measured at 550 nm PGH + KMnO4 (Indirect method) OH - Oxidation product of PGH + MnO42- Bluish-green colour, measured at 610 nm (Direct method)    Scheme 1. Reaction pathways and basis of determination 1.1. Optimization of experimental conditions 1.1.1. Indirect Method Preliminary experiments were performed to determine the permanganate concentration which would give a reasonable maximum absorbance at 550 nm in H2SO4 medium; and this was found to be 60 μg mL-1. Hence, different concentrations of PGH were reacted with 1 mL of 600 μg mL-1 KMnO4 in acid medium, and after the elapsed contact time, the absorbance of the residual permanganate was measured and related to PGH concentration. When a fixed concentration of KMnO4 (60 μg mL-1) was reacted with varying concentrations of PGH, the former was consumed in proportion to PGH concentration and there occurred a concomitant fall in the concentration of KMnO4 as shown by the 
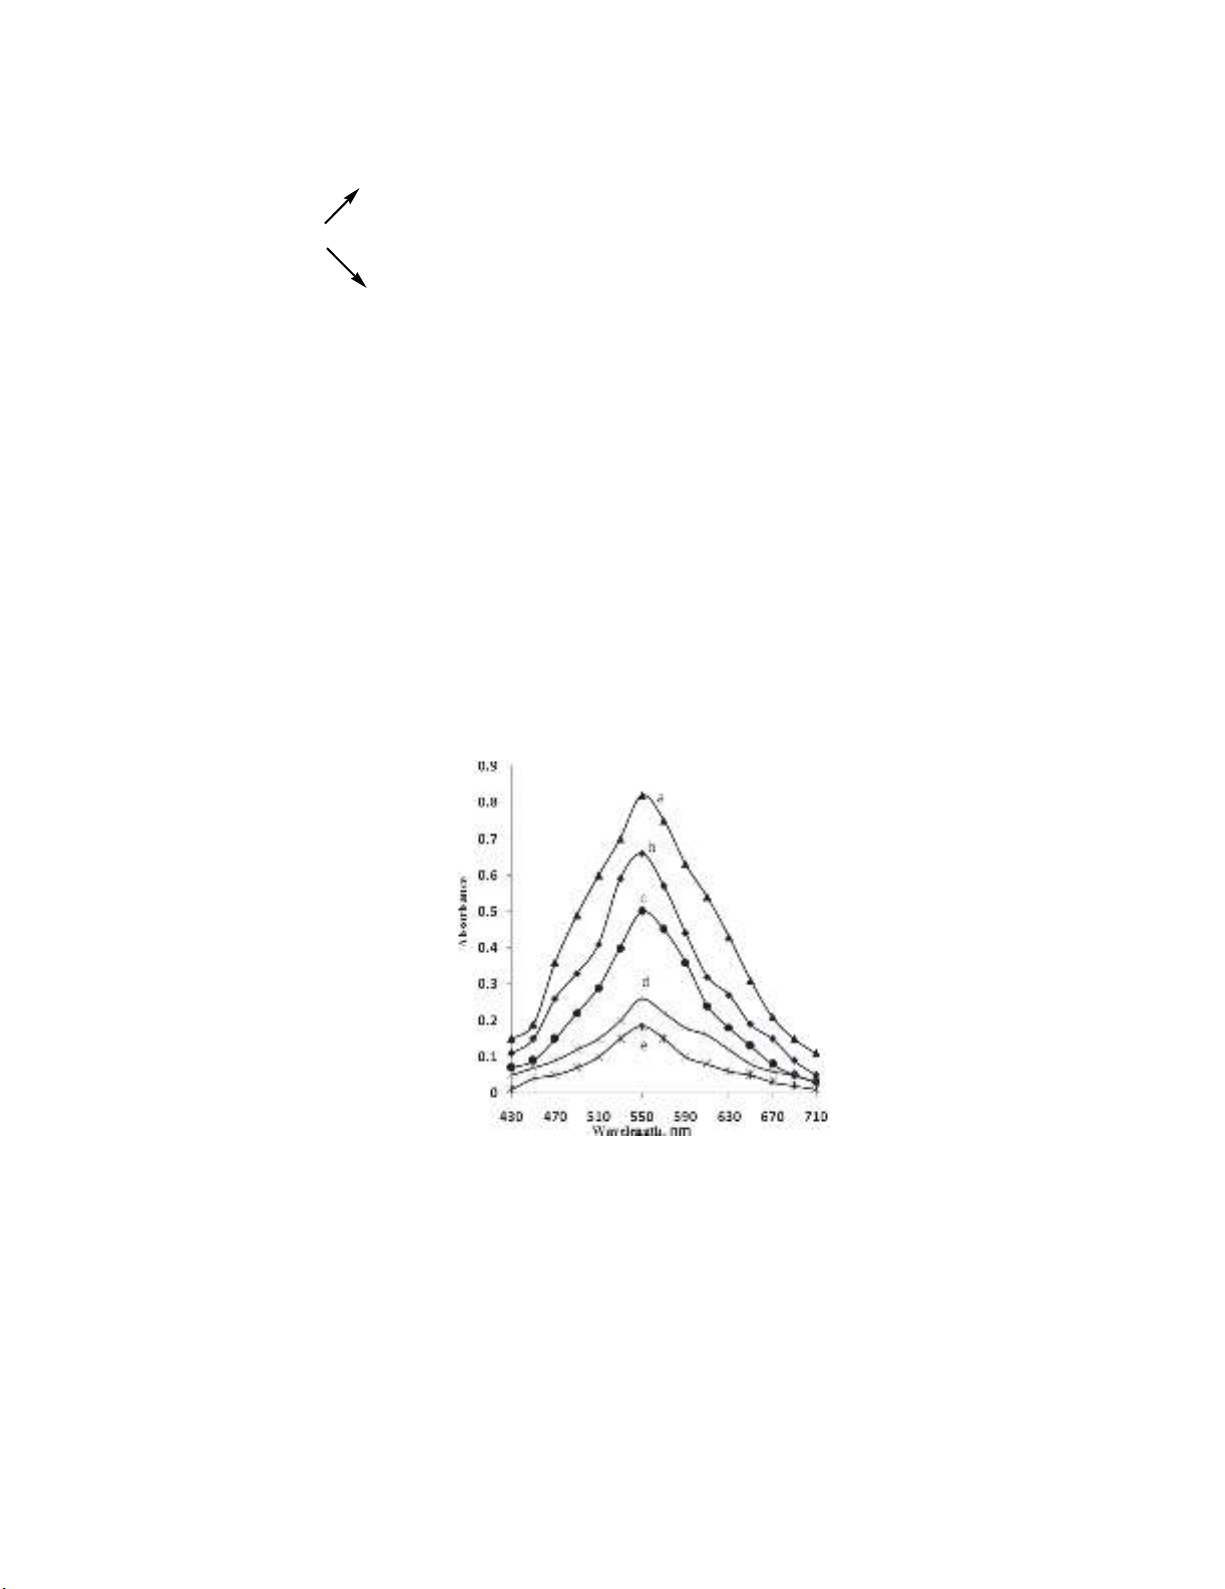
decreasing absorbance values at 550 nm with increase in the PGH concentration. This is depicted in Fig. 2. This facilitated the evaluation of the linear range over which the method could be applicable to the determination of PGH. Fig. 2. Absorption spectra of KMnO4 (60 μg mL-1) after reacting with PGH (μg mL-1): a) 0.0, b) 5.0, c) 10.0, d) 17.5 and e) 20.0 Sulphuric acid is the most suitable acid, since it has no action upon permanganate in dilute solution. With hydrochloric acid, there is the likelihood of the reaction taking place and some permanganate may be consumed in the formation of chlorine.61 Hence, the reaction of the oxidant with the drug was carried out in H2SO4 medium. Experiments were performed with 0.5-3.0 mL of 2 M H2SO4 and it was found that constant and reproducible absorbance readings were obtained in the range studied. Hence, 2 mL of 2M H2SO4 in a total volume of 10 mL was fixed as the optimum. The redox reaction with 10 μg mL-1 PGH was complete in 15 min, and the absorbance of residual oxidant remained constant for the next 45 min at room temperature (28±2 ᴼC).
  4. 48   
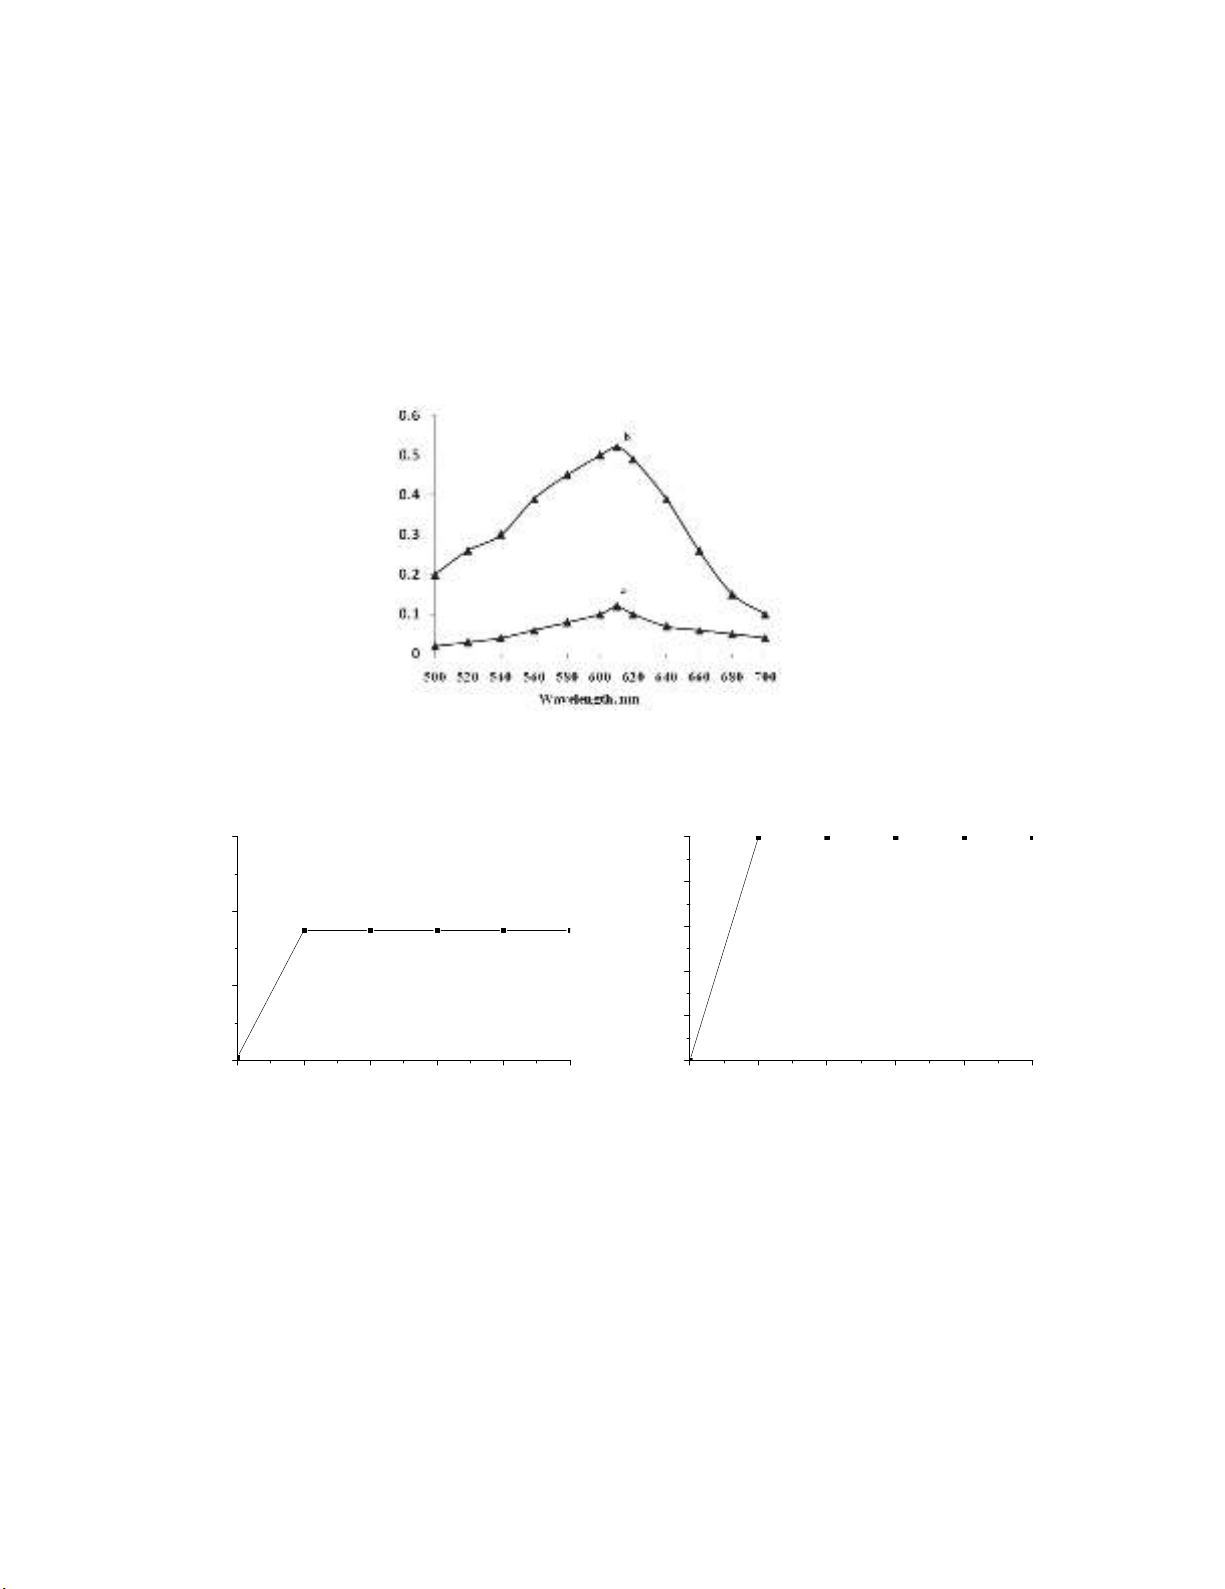
2.1.2. Direct method This method is based on the reduction of permanganate to manganite by PGH in the presence of NaOH, the bluish-green colored chromogen62 having the absorption maximum at 610 nm (Fig. 3). The formation of the colored product and the sensitivity of the reaction were found to be influenced by the alkali and permanganate concentrations. Maximum and constant absorbance readings were observed with 1 mL of 0.5M NaOH in a total volume of 10 mL (Fig. 4a). The reaction took 10 min for completion, and the bluish-green manganite color was stable for 40 min thereafter (Fig 4b). When a separate experiment was conducted to study the effect of permanganate concentration, it was found that maximum absorbance associated with a minimum blank reading was obtained when 1 mL of 0.1% KMnO4 in a total volume of 10 mL was used. Higher concentrations of permanganate resulted in increased sensitivity, but the blank absorbance showed an increasing trend simultaneously. Fig. 3. Absorption spectra of: a) Blank, b) bluish-green color produced for 6 μg mL-1 PGH, in Direct method 0.56 0.5 0.4 0.52 0.3 Absorbance Absorbance 0.2 0.48 0.1 0.44 0.0 0 1 2 3 4 5 0 10 20 30 40 50 mL NaOH (0.5 M) Time, minutes (a) (b) Fig. 4. Effects of: a) NaOH concentration, b) reaction time and stability of colored species (6 μg mL-1 PGH) 2.2. Method validation 
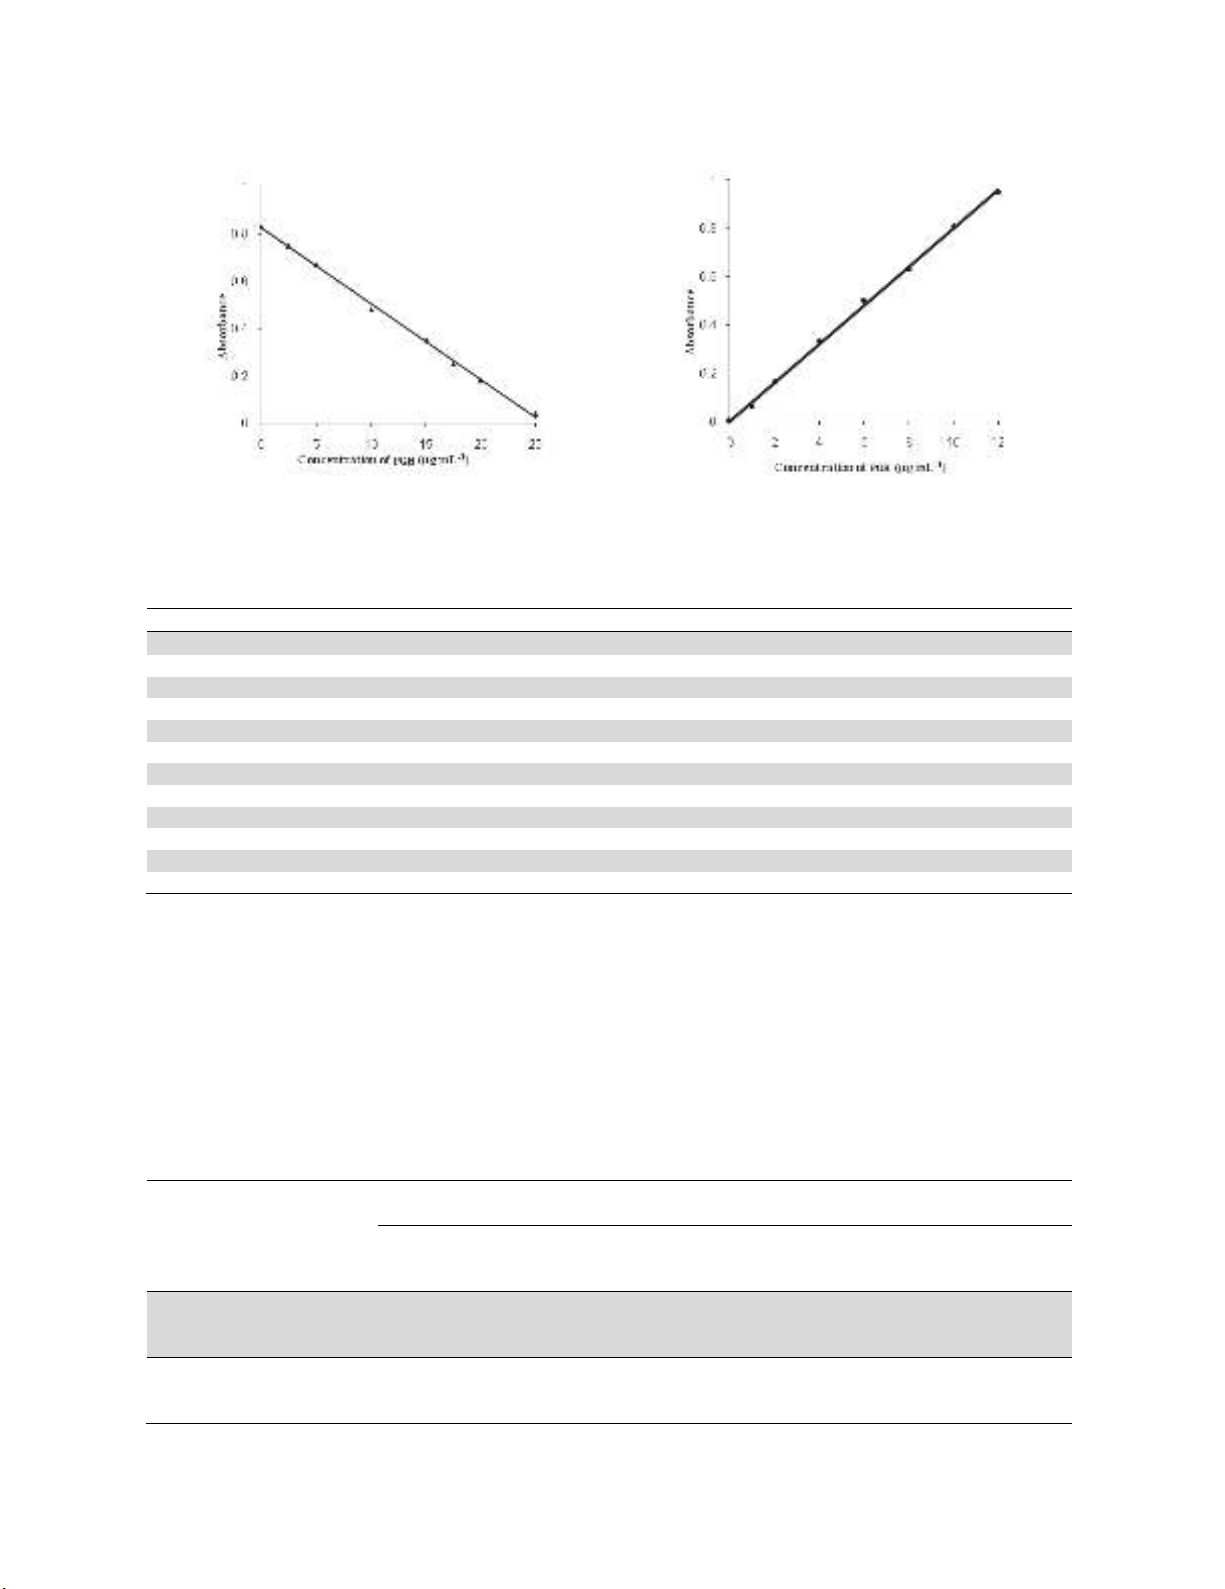
2.2.1 Linearity, sensitivity, limits of detection and quantification A linear correlation was found between absorbance at λmax and concentration of PGH (Fig. 5). The slope (m), intercept (b) and correlation coefficient (r) for each system were evaluated using the method of least squares. Optical characteristics such as Beer’s law limits, molar absorptivity and
  5. K. Basavaiah and N. Rajendraprasad / Current Chemistry Letters 7 (2018) 49 Sandell sensitivity values are presented in Table 1. The limits of detection (LOD) and quantitation (LOQ) are also calculated according to ICH guidelines63 and these data are presented in Table 1. (a) (b) Fig. 5. Calibration curves: a) Indirect method and b) Direct method Table 1. Sensitivity and regression parameters Parameter Indirect method Direct method max, nm 550 610 Linear range, µg mL-1 1.25 – 25.0 1.0-12.0 Molar absorptivity(ε), L mol-1 cm-1 1.16 × 10⁴ 2.77 × 10⁴ Sandell sensitivity*, µg cm-2 0.0315 0.0128 Limit of detection (LOD), µg mL-1 0.36 23 Limit of quantification (LOQ), µg mL-1 1.08 0.69 Regression equation, y* Intercept (b) 0.821 0.0024 Slope (m) -0.0318 0.0804 Standard deviation of b (Sb) 0.0017 0.0009 Standard deviation of m (Sm) 7.52 × 10⁻⁴ 1.53 × 10⁻³ Correlation coefficient (r) -0.9972 0.9991 *y=mx+b, where y is the absorbance, x concentration in μg mL-1, b intercept, m slope. 2.2.2. Precision and accuracy To check the precision and accuracy of the proposed methods, the assays described under “general procedures” were repeated seven times within the day (intra-day precision and accuracy) and five times on five different days (inter-day precision and accuracy). These assays were performed at three levels of analyte. The RSD values were ≤2.06% (intra-day) and ≤ 2.11% (inter-day) indicating high precision of the methods. %RE values of ≤ 2.0% demonstrate the fair accuracy of the proposed methods. The results of this study are summarized in Table 2. Table 2. Results of accuracy and precision study Intra-day accuracy and Inter-day accuracy and PGH precision (n=7) precision (n=5) Method taken, PGH PGH μg mL-1 found, %RE %RSD found, %RE %RSD μg mL-1 μg mL-1 15 15.15 1.00 1.89 15.19 1.27 2.11 Indirect 20 20.19 0.95 1.45 20.21 1.05 1.35 25 25.23 0.92 2.06 25.26 1.04 1.48 4 4.06 1.50 1.67 4.08 2.00 1.25 Direct 6 6.10 1.67 1.48 6.11 1.83 0.95 8 8.13 1.62 1.88 8.14 1.75 1.50 RE-Relative error, RSD-Relative standard deviation
  6. 50   2.2.3. Robustness and ruggedness The robustness of the methods was evaluated by making small incremental changes in the volume of reagent and reaction time and the effects of the changes were studied. To determine ruggedness, analyses were performed by three different analysts, and also with three different cuvettes by a single analyst. The intermediate precision, expressed as percent RSD, which is a measure of robustness and ruggedness, was within the acceptable limits as shown in the Table 3, reflecting the robustness and ruggedness of the methods. Table 3. Results of robustness and ruggedness study expressed as intermediate precision (%RSD) Robustness (%RSD) Ruggedness (%RSD) Conditions altered* PGH Volume Method taken, Reaction Inter-analysts Inter-cuvettes of μg mL-1 time* (n=4) (n = 4) reagent** (min) (mL) 15 0.89 0.98 0.57 1.34 Indirect 20 1.09 1.24 0.85 1.09 25 0.86 0.69 0.36 0.58 4 1.12 0.63 0.89 1.05 Direct 6 1.38 1.15 0.87 1.24 8 1.88 0.92 1.07 1.56 *Reaction times were 13, 15 & 17 min in Indirect method and 8, 10 & 12 min in Direct method. **In Indirect method, H2SO4 volumes were 1.8, 2.0 and 2.2 mL, and NaOH volumes in Direct method were 0.8, 1.0 and 1.2 mL. 2.2.4. Selectivity There was hardly any change in the absorbance of permanganate when reacted with placebo blank (Indirect method) and no discernible colour developed in direct method. The percentage recoveries of PGH from synthetic mixture solution were 99.67±1.94 for Indirect method and 98.72±1.45 for Direct method. This unequivocally demonstrated the non-interference of the inactive ingredients in the assay of PGH. 2.2.5. Application to tablets The proposed methods were applied to the quantification of PGH in commercial tablets. The results were compared with those of reference method.5 The reference method involve analytical procedure for measurement of absorbance of PGH at 269 nm in 0.1 M HCl. of The accuracy and precision of the proposed methods were further evaluated by applying Student’s t- test and variance ratio F- test, respectively. The t- and F-values at 95% confidence level did not exceed the tabulated values and this further confirms that there is no significant difference between the reference method and proposed methods with respect to accuracy and precision. The results of this study are presented in Table 4. Table 4. Results of analysis of tablets by the proposed methods Found* (Percent of label claim ±SD) Tablet brand Label claim, Reference Proposed methods name mg/tablet method Indirect Method Direct Method 98.47±2.14 99.45±1.07 Oglo-15 15 98.99±1.54 t= 0.44 t= 0.55 F= 1.93 F= 2.07 99.01±2.05 98.47±2.14 Neoglit-30 30 100.5±1.66 t= 1.29 t= 1.7 F= 1.53 F= 1.66 *Mean value of five determinations 2.2.6. Accuracy assessment by recovery study Recovery test was performed by applying the standard-addition procedure. The test was done by spiking the pre-analyzed tablet powder with pure PGH at three different levels (50, 100 and 150%) of the content present in the tablet powder (taken) and the total was determined by the proposed methods.
  7. K. Basavaiah and N. Rajendraprasad / Current Chemistry Letters 7 (2018) 51 Each test was repeated three times. The recovery percentage values ranged between 98.56 and 103.1% with standard deviation in the range 0.98-2.01% reflecting the high accuracy as well as selectivity of the methods. The results are shown in Table 5. Table 5. Results of recovery study by standard addition method Tablet Indirect method Direct method studied PGH in Pure Total Pure PGH PGH in Pure Total Pure PGH tablet, PGH PGH recovered tablet, PGH PGH recovered μg mL-1 added, found, (Percent±SD*) μg mL-1 added, found, (Percent±SD*) μg mL-1 μg mL-1 μg mL-1 μg mL-1 9.85 5.0 15.00 101.1±1.23 3.98 2.0 6.11 102.2±1.12 Oglo-15 9.85 10.0 20.25 102.0±1.05 3.98 4.0 8.18 102.5±0.98 9.85 15.0 24.49 98.56±1.98 3.98 6.0 10.15 101.7±1.39 9.90 5.0 15.12 101.5±1.11 3.94 2.0 6.03 101.5±1.90 Neoglit- 9.90 10.0 20.39 102.5±1.78 3.94 4.0 8.18 103.1±1.40 30 9.90 15.0 25.44 102.2±2.01 3.94 6.0 10.13 101.9±1.78 *Mean value of three measurements 3. Conclusion Reaction of pioglitazone with permanganate in acid and basic media was successfully exploited for the spectrophotometric determination of drug. The reactions provide relatively simple and rapid means of assay of pivoglitazone and its tablet dosage form. The proposed methods are more sensitive than the presently available methods, and have wider linear dynamic ranges. Acknowledgement Authors thank Glenmark Pharmaceuticals, Mumbai, India, for gifting pioglitazone pure sample. Prof. K. Basavaiah gratefully acknowledges the financial assistance by UGC, New Delhi, India, in the form of BSR Faculty fellowship. 5. Experimental 5.1. Apparatus A Systronics model 106 digital spectrophotometer (Systronics, Ahmedabad, Gujarat, India) equipped with 1-cm matched quartz cells was used for absorbance measurements. 5.2. Materials and reagents All chemicals used were of analytical reagent grade and double distilled water was used throughout the study. An approximately 0.01M solution of potassium permanganate was prepared by dissolving 0.395 g of the chemical (Merck Ltd., Mumbai, India) in water, the solution was boiled for 10 min to remove any residual manganese(IV) ions, cooled, filtered using glass wool and diluted to 250 mL, and standardized using H.A Bright’s procedure.64 This solution was diluted stepwise to get 600 μg mL-1 for Indirect method and 0.1% for Direct method. Sulphuric acid (0.1M and 2M) were prepared by appropriately diluting required volumes of concentrated acid (S.D. Fine Chem., Mumbai, India, sp. gr. 1.84) with water to get the required concentrations. A 0.5 M solution of sodium hydroxide were prepared by dissolving about 10.0 g NaOH (Merck, Mumbai, India) in 500 mL of water and standardized against pure potassium hydrogenphthalate.65 This was diluted to get 0.1M with water. 5.3. Standard drug solution Pure sample of PGH was kindly supplied by Glenmark Pharmaceuticals, Mumbai, India, as gift. A 500 μg mL-1 stock standard solution was prepared by dissolving 50 mg of PGH in 0.1M H2SO4 and
  8. 52   made up to 100 mL with same acid in a calibrated flask. It was diluted to 50 μg mL-1 PGH for use in Indirect method. Forty mg of PGH were weighed accurately and dissolved in 0.1M NaOH in a 100 mL calibrated flask and diluted to the mark with the same solvent. The solution was then diluted with water to get a working concentration of 40 μg mL-1 for use in Direct method. Two brands of PGH-containing tablets: Neoglit-30 (30 mg) (Novus Life Sciences Private Limited, Mumbai, India), Oglo-15 (15 mg) (Panacea Biotech., Mumbai, India) were procured from the local market. 5.4. General procedures 5.4.1. Procedure for bulk drug 5.4.1.1. Preparation of calibration graphs 5.4.1.1.1. Indirect Method Different aliquots (0.25-5.0 mL, 50 μg mL-1) of PGH solution were transferred into a series of 10 mL standard flasks by means of micro burette and the total volume was adjusted to 5.0 mL with 0.1M H2SO4. Two mL of 2M H2SO4 were added to each flask followed by 1 mL of 600 μg mL-1 KMnO4 solution. The flasks were kept aside for 15 min with occasional shaking before diluting to the mark with water. The absorbance was recorded at 550 nm against a water blank. 5.4.1.1.2. Direct Method Into a series of 10 mL volumetric flasks, 0.25-3.0 mL of 40 μg mL-1 PGH solution were buretted and the total volume was made up to 3.0 mL with 0.1M NaOH. To each flask was added 1 mL of 0.5M NaOH followed by 1 mL of 0.1% KMnO4 solution. The flasks were kept aside for 10 min with occasional shaking and the volume was made upto the mark with water. The absorbance was recorded at 610 nm against the reagent blank. Calibration graphs were prepared by plotting either decreasing absorbance values in Indirect method or increasing absorbance values in Direct method versus concentration of PGH. The unknown concentration was computed from the regression equation, derived using Beer’s law data. 5.4.1.1.3. Procedure for tablets A quantity of tablet powder containing 25 mg of PGH was accurately weighed into a 50 mL calibrated flask, added 30 mL of 0.1M H2SO4 and shaken for 20 min. Then, the volume was diluted to the mark with 0.1M H2SO4, mixed and filtered using a Whatman No. 42 filter paper. First 10 mL of the filtrate were discarded and a suitable aliquot of the subsequent portion (500 μg mL-1 in PGH) was diluted with 0.1M H2SO4 to obtain 50 μg mL-1 solution and the analysis was completed following the procedure described earlier by taking 3 mL aliquot in five replicates (Indirect method). In Direct method, a portion of the tablet powder equivalent to 20 mg of PGH was accurately weighed into a 100 mL beaker. The powder was extracted with three 10 mL portions of chloroform and each time the extract was filtered with a Whatman No. 42 filter paper. The filtrate was collected in 100 mL calibrated flask, chloroform was evaporated over a water bath and the residue was dissolved in 0.1M sodium hydroxide and diluted to the mark in a 100 mL calibrated flask with same solvent. The solution was diluted to 40 µg mL-1and assayed by taking 2 mL aliquot (n = 5). 5.4.1.1.4. Procedure for placebo blank and synthetic mixture A placebo blank containing starch (10 mg), acacia (15 mg), hydroxyl cellulose (10 mg), sodium citrate (10 mg), talc (20 mg), magnesium stearate (15 mg) and sodium alginate (10 mg) was prepared by homogeneous mixing. A 20 mg portion was weighed and solution prepared as described under ‘procedure for tablets’ and then subjected to analysis.
  9. K. Basavaiah and N. Rajendraprasad / Current Chemistry Letters 7 (2018) 53 A synthetic mixture was separately prepared by mixing 50 mg of pure PGH with 40 mg of placebo. Portions containing 25 mg or 20 mg of PGH were separately taken and solutions were prepared as described under “procedure for tablets” and analyzed following the general procedures, and the percentage recovery of PGH was computed. References 1. Neil J.O. (2001). The Merck Index, Merck Research Laboratories. 13th Ed., Martindale, Merck. 2. Scheen A.J. (2012). Outcomes and lessons from the PROactive study. Diabet. Res. Clin. Prac., 98, 175–186. 3. Pfützner A., Forst T. (2006). Pioglitazone: an antidiabetic drug with the potency to reduce cardiovascular mortality. Expert Opin Pharmacother. 7, 463-476. 4. Satheeshkumar N., Shantikumar S., Srinivas R. (2014). Pioglitazone: A Review of Analytical Methods. J. Pharm. Anal., 4, 295-302. 5. Mahadik P.S., Senthilkumar G.P. (2012). Method development & validation of pioglitazone in bulk and pharmaceutical dosage forms by using spectrophotometric method. Asian J. Biochem. Pharm. Res., 2, 159-165. 6. Mohd S., Kulkarni A.P., Zaheer Z., Dehghan M.H. (2012). Spectroscopic estimation of pioglitazone hydrochloride. Int. J. Pharm. Frontier Res., 2, 87-94. 7. Shakya P., Singh K. (2010). Determination of pioglitazone hydrochloride in bulk and pharmaceutical formulations by UV spectrophotometric method. Int. J. Pharm. Sci. Res., 1, 153- 157. 8. Ali M.Y., Swamy P.V. , Borgaonkar P. (2008). UV-spectrophotometric determination of pioglitazone in pharmaceutical dosage forms. Int. J. Chem. Sci., 6, 2062-2065. 9. Patil S., Dwivedi S., Bagade S. (2011). Development of spectrophotometric method for the estimation of pioglitazone HCl from two different marketed brands. Am. J. PharmTech Res.,1, 264-275. 10. Sunitha P.G., Deattu N., Umarani N. (2010). Spectrophotometric method for the determination of Pioglitazone in pharmaceutical dosage forms. Der Pharm. Chem., 2, 202-204. 11. Bodar J.D., Kumar S., Yadav Y.C., Seth A.K., Deshmukh G.J., Sen A.K., Shah A. (2011). Development of the spectrophotometric method for the simultaneous estimation of piogliazone and metformin. Pharma Sci. Monitor An Int. J. Pharm. Sci., 2: 236-243. 12. Kumar S.S., Krishnaveni Y., Ramesh G. (2012). Simultaneous estimation of sitagliptin and pioglitazone by UV-spectroscopic method and study of interference of various excipients on this combination of drugs. Int. J. Curr. Pharm. Res., 4, 113-116. 13. Adhikari L., Jagadev S., Sahoo S., Murthy P.N., Mishra U.S. (2012). Devlopement and validation of UV–visible spectrophotometric method for simultaneous determination of pioglitazone HCl, metformin HCl and glipizide in its bulk and pharmaceutical dosage form (tablet). Int. J. ChemTech Res., 4, 625-630. 14. Deepa P., Laxmanbhai P., Madhabhai P., Advaita P.B. (2011). Simultaneous estimation of glimepiride, pioglitazone HCl and metformin HCl by derivative spectrophotometry method. Int. Res. J. Pharm.,2, 111-114. 15. Dhole S.M., Khedekar P.B., Amnerkar N.D. (2013). UV spectrophotometric absorption correction method for the simultaneous estimation of pioglitazone HCl, metformin HCl and glibenclamide in multicomponent formulation. Int. J. Anal. Bioanal. Chem., 3, 18-22. 16. Game M.D. (2011). First order derivative spectrophotometric method for simultaneous estimation of glimepiride and pioglitazone HCl in combined dosage form. J. Pharm. Res., 4, 4301-4310. 17. Havele O.S., Havele S.S. (2011). Simultaneous determination of atorvastatin calcium and pioglitazone hydrochloride in its multicomponent dosage forms by UV spectrophotometry. Int. J. Pharm. Sci. Res., 1, 75-79. 18. Kishore L., Kaur N. (2011). Estimation of pioglitazone and glimipride in its pharmaceutical dosage form by spectrophotometric methods. Der Pharm. Lett., 3, 276-284.
  10. 54   19. Pallavi P.M., Sonali R.D., Praveen C.D. (2012). Development and validation of UV derivative spectrophotometric methods for the determination of glimepiride, metformin HCl and pioglitazone HCl in bulk and marketed formulation. J. Pharm. Sci. Innov., 1, 58-62. 20. Rathod S.D., Patil P.M., Jadhav S.B., Chaudhary P.D. (2012). UV-spectrophotometric simultaneous determination of metformin HCl and pioglitazone HCl in combined dosage form. Asian J. Pharm. Anal., 2, 5-9. 21. Singhvi I., Mehta K., Kapadiya N. (2011). Analytical method development and validation for the simultaneous estimation of pioglitazone and glimepiride in tablet dosage form by multiwavelength spectroscopy. J. Appl. Pharm. Sci., 1, 159-161. 22. Sujana K., Abbulu K., Souri O.B., Archana B., Sindu M., Rani G.S. (2011). Difference spectrophotometric methods for pioglitazone HCl and metformin HCl. J. Pharm. Sci. Res., 3, 1122- 1126. 23. Sujana K., Rani G.S., Prasad M.B., Reddy M.S. (2010). Simultaneous estimation of pioglitazone HCl and metformin HCl using UV spectroscopic method. J. Biomed. Sci. Res., 2, 110-115. 24. Faridbod F., Ganjali M.R., Esfahani E.N., Larijani B., Riahi S., Norouzi P. (2010). Potentiometric sensor for quantitative analysis of pioglitazone hydrochloride in tablets based on theoretical studies. Int. J. Electrochem. Sci., 5, 880-894. 25. Mostafa G.A., Al-Majed A. (2008). Characteristics of new composite-and classical potentiometric sensors for the determination of pioglitazone in some pharmaceutical formulations. J. Pharm. Biomed. Anal., 48, 57-61. 26. El-Ghobashy M.R., Yehia A.M., Mostafa A.A. (2009). Application of membrane-selective electrodes for the determination of pioglitazone HCl in the presence of its acid degradant or metformin HCl in tablets and plasma. Anal. Lett., 42, 123-140. 27. Badawy W.A., El-Ries M.A., Mahdi I.M. (2009). Carbon paste-and PVC membrane electrodes as sensitive sensors for the determination of antidiabetic drugs for type 2 diabetic patients. Anal. Sci., 25, 1431-1436. 28. Al-Arfaj N.A., Al-Abdulkareem E.A., Aly F.A. (2009). Flow-injection chemiluminometric determination of pioglitazone HCl by its sensitizing effect on the cerium-sulfite reaction. Anal. Sci., 25, 401-406. 29. Jiladia M.A., Pandya S.S., Jiladia A.G. (2010). Estimation of pioglitazone in bulk and tablet dosage forms by HPLC method. Int. J. Pharm. Sci., 2, 386-389. 30. Srinivasulu D., Sastry B.S., Omprakash G. (2010). Development and validation of new RP-HPLC method for determination of pioglitazone HCl in pharmaceutical dosage forms. Int. J. Chem. Res., 1, 18-20. 31. Saber A.M.R.L. (2008). Determination of pioglitazone hydrochloride in tablets by high- performance liquid chromatography. Pak. J. Anal. Environ. Chem., 9, 118-121. 32. Radhakrishna T., Rao D.S., Reddy G.O. (2002). Determination of pioglitazone hydrochloride in bulk and pharmaceutical formulations by HPLC and MEKC methods. J. Pharm. Biomed. Anal., 29, 593-607. 33. Jedlicka A., Klimes J., Grafnetterova T. (2004). Reversed-phase HPLC methods for purity test and assay of pioglitazone hydrochloride in tablets. Pharmazie, 59, 178-182. 34. Madhukar A., Naresh K., Kumar C.N., Sandhya N., Prasanna P. (2011). Rapid and sensitive RP- HPLC analytical method development and validation of pioglitazone hydrochloride. Der. Pharm. Lett., 3, 128-132. 35. Sharma S., Sharma M.C., Chaturvedi S.C. (2010). Study of stressed degradation behavior of pioglitazone hydrochloride in bulk and pharmaceutical formulation by HPLC assay method. J. Optoelectronics and Biomed. Materials, 1, 17-24. 36. Rashmitha N., Hiriyanna S.G., Rao C.H.S., Reddy K.C.S., Kiran M.H., Sharma H.K., Mukkanti K. (2010). A validated stability indicating HPLC method for the determination of impurities in pioglitazone hydrochloride. Der. Pharm. Chem., 2, 426-432.
  11. K. Basavaiah and N. Rajendraprasad / Current Chemistry Letters 7 (2018) 55 37. Reddy G.R.K.,Rao V.S.N. (2012). Development and validation of stability indicating assay method for pioglitazone drug substance by reverse phase HPLC. J. Global Trends Pharm. Sci., 3, 584-596. 38. Wanjari D.B., Gaikwad N.J. (2005). Stability indicating RP-HPLC method for determination of pioglitazone from tablets. Indian J. Pharm. Sci., 67, 256-258. 39. Sriram V., Sriram K., Angirekula J. (2012). Development and validation of stability indicating reverse phase HPLC method for the determination of impurities in pioglitazone hydrochloride. Int. J. Pharm. Biomed. Sci., 3, 89-96. 40. Narasimham L.Y.S., Barhate V.D. (2010). Development and validation of stability indicating UPLC method for the simultaneous determination of anti-diabetic drugs in pharmaceutical dosage forms. J. Pharm. Res., 3, 3081-3087. 41. Jiladia M.A., Pandya S.S.,Vidyasagar G. (2009). A simple and sensitive HPTLC method for estimation of pioglitazone inbulk and tablet dosage forms. Asian J. Res. Chem., 2, 207-209. 42. Singh S.C.D.D., Kushnoor A. (2011). Development and validation of a HPTLC method for estimation of pioglitazone in bulk and tablet dosage form. J. Pharm. Res., 4, 3919-3921. 43. Gumieniczek A., Hopkała H., Berecka A. (2005). Reversed‐phase thin‐layer chromatography of three new oral antidiabetics and densitometric determination of pioglitazone. J. Liq. Chromatogr. Rel. Technol., 27, 2057-2070. 44. Sharma M., Sharma S., Kohli D. (2010). HPTLC method development and validation for the estimation of atorvastatin calcium and pioglitazone HCl in pharmaceutical combined tablet dosage form. Ann. Biol. Res., 1, 124-129. 45. Anand D.P. (2010). HPTLC method for determination of telmesarton HCl with pioglitazone HCl in pharmaceutical dosage form. Int. J. Pharm. Res., 2, 185-190. 46. Kale D., Kakde R. (2011). Simultaneous determination of pioglitazone, metformin, and glimepiride in pharmaceutical preparations using HPTLC method. J. Planar Chromatogr. Mod. TLC, 24, 331-336. 47. Calixto L.A., Bonato P.S. (2013). Combination of hollow-fiber liquid-phase microextraction and capillary electrophoresis for pioglitazone and its main metabolites determination in rat liver microsomal fraction. Electrophoresis, 34, 862-869. 48. 48. Geffery G.H., Basset J., Mendham J., Denney R.C. (1978 and 1979), Longman Group UK Ltd., Vogel’s Textbook of Quantitative Chemical Analysis, 5th Edition, p. 369. 49. Emara S. (2004). Determination of methotrexate in pharmaceutical formulations by flow injection analysis exploiting the reaction with potassium permanganate. IL Farmaco, 59, 827-833. 50. Rahman N., Ahmad Y., Azmi S.N.H. (2004). Kinetic spectrophotometric method for the determination of norfloxacin in pharmaceutical formulations. Eur. J. Pharm. Biopharm., 57, 359- 367. 51. Tammilehto S.A. (1980). Oxidation of chlorprothixene with potassium permanganate. J. Pharm. Pharmacol., 32, 524-524. 52. Murugesan A., Venkappayya D. (1983). New method for estimation of isoniazid. Curr. Sci., 52, 249-249. 53. Kucharski M., Sikorska-Tomicka H. (1982). Potentiometric and amperometric determination of methyl thiouracil with potassium permanganate. Chem. Anal. (Warsaw), 27, 491-496. 54. Stepnayuk S.N., Balagorazumnya N.V. (1989). Permanganometric determination of amidopyrine in dosage forms. Farmatsiya (Moscow), 38, 67-69. 55. Suganthi A., Shivakumar H.B., Vijaykumar S.C., Ravimathi P., Ravi T.K. (2006). Visible spectrophotometric determination of valdecoxib in tablet dosage forms. Indian J. Pharm. Sci., 68, 373-374. 56. Al-Tamrah S.A. (1999). Spectrophotometric determination of nicotine. Anal. Chim. Acta., 379, 75- 80. 57. Abdellatef H.E. (2002). Kinetic spectrophotometric determination of tramadol hydrochloride in pharmaceutical formulation. J. Pharm. Biomed. Anal., 29, 835-842.
  12. 56   58. Reddy M.N., Reddy V.P.N., Reddy P.J.C., Murthy T.K., Srinivasa Rao Y. (2002). Spectrophotometric determination of cefuroxime sodium in pharmaceutical dosage forms. Antiseptic., 99, 88-89. 59. Al-Ghanman S.M., Belal F. (2001). - Spectrophotometric determination of diloxanide furoate in its dosage forms. IL Farmaco, 56, 677-681. 60. Sastry C.S.P., Vijaya R.T., Satyanarayana A. (1998). Spectrophotometric determination of pentazocine in pharmaceutical formulations. Indian. J. Pharm. Sci., 60, 55-58. 61. Vogel, A.I. (1961). A Text-book of Quantitative Inorganic Analysis, 7th Ed., The English Language Book Edition Society, London, p.280. 62. Mann, F.G., Sounders, B.C. (1974). In; New Impression 1974, 4th Ed., Longman, Cambridge, p.85. 63. International Conference on Hormonisation of Technical Requirements for Registration of Pharmaceuticals for Human Use, ICH Harmonised Tripartite Guideline, Validation of Analytical Procedures: Text and Methodology Q2 (R1), Complementary Guideline on Methodology dated 06 November 1996, incorporated in November 2005, London. UK. http://www.ich.org/LOB/media/MEDIA417.pdf. 64. Vogel, A.I. (1961) A Text-book of Quantitative Inorganic Analysis. 3rd Ed., The English Language Book Edition Society, London, p.280. 65. Vogel (1961) Text Book of Quantitative Inorganic Analysis, Longmans, London, p. 243. © 2018 by the authors; licensee Growing Science, Canada. This is an open access article distributed under the terms and conditions of the Creative Commons Attribution (CC-BY) license (http://creativecommons.org/licenses/by/4.0/).
ADSENSE

CÓ THỂ BẠN MUỐN DOWNLOAD


Đồng bộ tài khoản
2=>2