* Corresponding author
E-mail address: monica.castro@ucp.edu.co (M. Y. Castro-Peña)
© 2019 by the authors; licensee Growing Science.
doi: 10.5267/j.uscm.2019.1.003
Uncertain Supply Chain Management 7 (2019) 767–782
Contents lists available at GrowingScience
Uncertain Supply Chain Management
homepage: www.GrowingScience.com/uscm
Design of a supply chain to produce ethanol from one residuum and two coffee by-products
Mónica Y. Castro-Peñaa*, César Augusto Peñuelab and Julián Gil Gonzálezc
aUniversidad Católica de Pereira, Pereira, Colombia
bUniversidad Libre, Pereira, Colombia
cUniversidad Tecnológica de Pereira, Pereira, Colombia
C H R O N I C L E A B S T R A C T
Article history:
Received November 4, 2018
Received in revised format
December 20, 2018
Accepted January 18 2019
Available online
January 18 2019
The present article exposes a model of Mixed Integer Linear Programming (MILP) as a support
for strategic decision making, guided to the location of facilities in ethanol supply chains under
a configuration of collection centers of raw material and production plants, directly impacting
costs related to logistics and operations. The model is applied to the supply chain for the
production of ethanol from two by-products and a coffee residue (pulp, mucilage, and stems,
respectively) in Colombia. The results obtained by the model allow identifying locations for
the corresponding links to the three types of biomass considered, and the flows of raw material
between coffee producing departments and collection centers, from the latter to production
plants, and from this, where the transformation of ethanol to mixing centers is generated.
., Canada
by
the authors; licensee Growin
g
Science2019 ©
Keywords:
Residues
By-products
Coffee
Location
Ethanol
Supply chain
1. Introduction
Recently, many studies have focused on the search for energetically efficient renewable energies to
minimize the negative impact on energy security generated by the use of fossil fuels and the reduction
of their reserves worldwide (Edenhofer et al., 2011). These sources of renewable energy must guarantee
industrial growth and the strengthening of the world economy (Zapiain, 1972); being biofuels one of
the most promising solutions.
Biofuels are classified into three categories according to the raw material used for their production. The
first generation comes from raw materials with a high content of starch, sugars, and oils (Alejos &
Calvo, 2015), which leads to an increased competition for land and water by using agricultural land for
the direct cultivation of biofuels, deforestation and the rise in the price of food (Hernández &
Hernández, 2008). The second generation makes use of lignocellulosic biomass from agricultural or
forestry residues (González Merino & Castañeda Zavala, 2008) listed as one of the best alternatives by
contributing to the reduction of land use due to its potential energy yield per hectare, not requiring
additional arable land to those that are used for human consumption (Loera-Quezada & Olguín, 2010).

768
Finally, micro and macro algae are raw materials for the production of third generation biofuels through
the process of transesterification of the oils present in them (Martínez Restrepo, 2014); however, the
high costs generated by having controlled environments, the genetic engineering, together with the
production costs, means that this type of biofuel is at an incipient stage for commercial scale production
(Ecopetrol, 2014).
The above presents second-generation biofuels as a good option. However, the characteristics of its
raw material (lignocellulose) disadvantage its elaboration because it presents important technical
difficulties, which increases the cost of production and commercialization (Serna et al., 2011), making
the economic factor a limitation for its large-scale development. In this sense, the design of its supply
chain is identified as a critical factor for the reduction of operating costs (No, P. T., 2002).
In the context of supply chain management, several works are identified, which are mainly focused on
economic optimization, based on indicators such as: costs (Yue & You, 2014; Xie et.al., 2014; Emara
et al., 2016; Osmani & Zhang, 2017; Parker et al., 2010), earnings (Osmani & Zhang, 2017; Bai et al.,
2012), net present value (Kelloway et al., 2013), expected net present value (ENPV) formulated by
Bagajewicz, conditional value at risk (CVaR), and financial risk (Dal-mas et al., 2011). The latter is
analyzed from the different aspects that make up the operation of a supply chain for the generation of
biofuels such as location, the capacity of facilities, and flows of raw material (López-Díaz et al., 2017;
Sharifzadeh et al., 2015), technology for conversion (Leão et al., 2011; Kim et al., 2011), and aspects
guided to transportation decisions (Mohseni et al., 2016; Marvin et al., 2012). The above does not
ignore that the problem has been addressed from studies that have complemented the economic
indicators, also consider environmental (Natarajan et al., 2014; Mirkouei et al., 2016), environmental
and energetic (Zhang et al., 2012), and environmental and social aspects (Cambero & Sowlati, 2016).
Regarding the type of biomass used, contributions to corresponding biofuels of the three generations
are identified, being the most recorded biomasses in the search carried out as a case study: corn stubble,
forest residues, and switchgrass; only the article exposed by (Duarte et al., 2014) is identified, which is
closely related from the coincidence in the raw material of cut stems of coffee, and the context of the
country, Colombia. On the other hand, coffee is one of the most important agricultural products in
Colombia. The coffee sector is an essential contributor to GDP and a generator of employment in the
agricultural industry in the country (26% of total agricultural employment). Therefore, it is considered
as a real engine for the development of the rural economy and a "transcendental factor for sustaining a
social fabric that contributes directly to peace and rural development, reducing poverty, and boosting
production ..." (Lozano & Yoshida, 2008) The country, as of September 2017, had a "coffee park that
exceeds 4,700 million trees distributed over more than 911,000 hectares in 600 municipalities"
(Federación Nacional de Cafeteros, 2017). Nonetheless, coffee plants generate large volumes of
organic residues. In fact, only 5% of the weight of the fresh fruit is used in the preparation of the coffee
drink (Serna-Jiménez et al., 2018). Usually, coffee residues are thrown into streams, a fact that causes
contamination of water sources, which leads to the death of aquatic species (Funes et al., 2011). The
residues and by-products of coffee can be used as fuel in different ways including: as a direct fuel,
biogas, biodiesel, and bioethanol (fuel alcohol); in the case of bioethanol, studies such as Triana et al.
(2011), Navarro et al. (2017), Muñoz & Daniel (2015), Navia et al. (2011) and Gurram et al. (2015)
have demonstrated and studied the process under which stems, mucilage, and fresh pulp can be raw
material for the production of fuel alcohol.
In this way, the present article exposes the development of a Mixed Integer Linear Programming model
(MILP) as a support for strategic decision making guided to the location of facilities in ethanol supply
chains, under a configuration of centers of raw materials and production plants. The present model
considers restrictions of availability of raw material, taking as a reference the model of
location/assignment, Location-Allocation Problem (LAP), which is a combinatorial problem that
consists of determining the position of k facilities on possible positions and assigning customers to the
nearest facility (Torrent-Fontbona et al., 2013). The LAP is considered in the literature as a NP-hard
problem (Zurita-Milla & Huisman, 2011), which requires a solution methodology that faces the
M. Y. Castro-Peña et al. /Uncertain Supply Chain Management
7 (2019)
769
computational complexity, and results can be obtained in reasonable execution times. As a case study,
the supply chain for the production of ethanol is taken from two by-products (pulp, mucilage), and a
coffee residue (stems) in Colombia. This country has 1,102 municipalities, of which 600 are coffee
producers (Federación Nacional de Cafeteros, 2017); being considered as the largest producer of soft
washed Arabica coffee in the world, and which production grew 83% in the last four years (Federación
Nacional de Cafeteros de Colombia, 2016).
2. Structure and development of the model
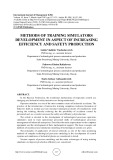
The development of the proposed model tends for a design of a supply chain for the production of
ethanol from three second-generation raw materials, being these by-products and residues of coffee;
the design is carried out according to the scheme shown in Fig. 1, in which the links that will make up
the chain belonging to the pulp biomass are shown, for the case of mucilage and stems it will be the
same, varying the subscripts used for each case (Table 1). The links considered for the supply chain are
four: coffee producing departments, raw material collection centers, production plants, and mixing
centers. Two (2) of these links already have a defined location, coffee-producing departments, and
mixing centers, being the object of study and purpose of the model to be proposed, establishing the
location of collection centers and production plants, as well as determining the flow between them once
their location is defined.
Fig. 1. Scheme of the proposed supply chain.
Table 1
Subscripts used in the model
Set Description
єJ Set of departments suppliers of pulp biomass
єD Set of departments suppliers of mucilage biomass
єF Set of departments suppliers of stems biomass
єU Set of location alternatives for mucilage collection centers
єL Set of location alternatives for pulp collection centers
єZ Set of alternatives for zoca collection centers
єG Set of mucilage collection centers
єE Set of zoca collection centers
єO Set of pulp collection centers
єP Set of location alternatives for pulp production plants
єN Set of location alternatives for mucilage production plants
єC Set of location alternatives for zoca production plants
єI Set of mucilage processing plants
єK Set of zoca processing plants
єA Set of pulp processing plants
єM Set of available mixing centers
єW Ethanol

770
The problem is formulated as a Mixed Integer Linear Programming model, taking as reference the
parameters shown in Table 2 for the establishment of the optimal values for the decision variables
indicated in Table 3.
Table 2
Parameters
Symbol Description Unit
CBDG Cost of mucilage transport from department to collection center located in
region $/ton
CBJO Cost of pulp transport from department
to collection center located in
region $/ton
CBFE Cost of zoca transport from department
to collection center located in region
$/ton
CBGI
Cost of mucilage transport from collection center located in region to the
production plant located in region $/ton
CBOA
Cost of pulp transport from collection center located in region to the
production plant located in region $/ton
CBEK Cost of zoca transport from the collection center located in region to the
production plant located in region $/ton
CEIM Cost of ethanol transport from the production plant located in region to the
mixing center $/Lt
CEAM Cost of ethanol transport from the production plant located in region to the
mixing center $/Lt
CEKM Cost of ethanol transport from the production plant located in region to the
mixing center $/Lt
TPP Ethanol production rate from pulp Lt/ton
TPM Ethanol production rate from mucilage Lt/ton
TPZ Ethanol production rate from stems Lt/ton
CBP Cost of pulp raw material in region
$/ton
CBM Cost of mucilage raw material in region $/ton
CBZ
Cost of stems raw material in region
$/ton
QP Amount of pulp available in department
Ton/mes
QM Amount of mucilage available in department Ton/mes
QZ
Amount of stems available in department
Ton/mes
CFVO Fixed and variable costs of opening of collection center located in region $
CFVE Fixed and variable costs of opening of collection center located in region $
CFVG Fixed and variable costs of opening of collection center located in region $
CFVA
Fixed and variable costs of opening of production plant located in region $
CFVK Fixed and variable costs of opening of production plant located in region $
CFVI Fixed and variable costs of opening of production plant located in region $
DM Ethanol demand by the mixing center Lt/mes
QCA
Conversion capacity of the production plant in the region Lt/mes
QCK Conversion capacity of the production plant Lt/mes
QCI Conversion capacity of the production plant Lt/mes
QAO Storage capacity of the collection center in the location Ton/mes
QAE Storage capacity of the collection center in the location Ton/mes
QAG Storage capacity of the collection center in the location Ton/mes
CDNS Unmet demand cost in the mixing center $/Lt

M. Y. Castro-Peña et al. /Uncertain Supply Chain Management 7 (2019)
771
Table 3
Decision variables
Symbol Description Unit
YI 1 if the production plant is established at location ; otherwise 0 [0,1]
YK 1 if the production plant is established at location ; otherwise 0 [0,1]
YA 1 if the production plant is established at location ; otherwise 0 [0,1]
YG 1 if the collection center is established at location ; otherwise 0 [0,1]
YE 1 if the collection center is established at location ; otherwise 0 [0,1]
YO 1 if the collection center is established at location ; otherwise 0 [0,1]
XJ Amount of pulp transported from department to the collection center located
in region Ton.
XF Amount of stems transported from department
to the collection center
located in region Ton.
XD Amount of mucilage transported from department to the collection center
located in region Ton.
XBO Amount of pulp sent from the collection center located in region to the
production plant located in region Ton.
XBG Amount of mucilage sent from the collection center located in region to the
production plant located in region Ton.
XBE Amount of stems sent from the collection center located in region to the
production plant located in region Ton.
XEA Amount of ethanol to be sent from the production plant located in region to
the mixing center Lt
XEI Amount of ethanol to be sent from the production plant located in region to
the mixing center Lt
XEK Amount of ethanol to be sent from the production plant located in region to
the mixing center Lt
XBM Total ethanol generated from mucilage by the plant located in region Lt
XBP Total ethanol generated from pulp by the plant located in region Lt
XBZ Total ethanol generated from stems by the plant located in region Lt
XVIRT Slack variable to satisfy the demand restriction of the mixing center Lt
According to the information presented as a basis for the formulation of the model, each of its
components is related in the following sections.
2.1 Objective function
This function is determined by the minimization of costs (eq. 1) by concept in the first measure of
transport between the different links, as well as from the first to the third component of multiplication
obey said cost between suppliers and collection centers, the following three to transport between
collection centers and production plants, and from the seventh to the ninth component to the transfer of
ethanol to the respective mixing centers. The other costs involved correspond to fixed and variable
costs due to the opening of both collection centers (component 10 to 12), and production plants
(component 13 to 15); finally, a penalty for unmet demand is considered.