
BioMed Central
Page 1 of 11
(page number not for citation purposes)
Journal of Immune Based Therapies
and Vaccines
Open Access
Original research
Mycobacterial immune reconstitution inflammatory syndrome in
HIV-1 infection after antiretroviral therapy is associated with
deregulated specific T-cell responses: Beneficial effect of IL-2 and
GM-CSF immunotherapy
A Pires1, M Nelson2, AL Pozniak2, M Fisher3, B Gazzard2, F Gotch1 and
N Imami*1
Address: 1Department of Immunology Imperial College London, Chelsea and Westminster Hospital, 369 Fulham Road, London. UK, 2Department
of HIV/GU Medicine, Chelsea and Westminster Hospital, 369 Fulham Road, London, UK and 3Department of HIV/GU Medicine, Royal Sussex
County Hospital, Brighton, UK
Email: A Pires - antonio.pires@meditechmedia.com; M Nelson - sandra.mead@chelwest.nhs.uk; AL Pozniak - anton.pozniak@chelwest.nhs.uk;
M Fisher - martin.fisher@bsuh.nhs.uk; B Gazzard - eileen.whitney@chelwest.nhs.uk; F Gotch - f.gotch@imperial.ac.uk;
N Imami* - n.imami@imperial.ac.uk
* Corresponding author
Immune reconstitutionT cellsHIV-1Mycobacterial infectionMAC
Abstract
Background: With the advent of antiretroviral therapy (ART) cases of immune reconstitution inflammatory syndrome
(IRIS) have increasingly been reported. IRIS usually occurs in individuals with a rapidly rising CD4 T-cell count or
percentage upon initiation of ART, who develop a deregulated immune response to infection with or without reactivation
of opportunistic organisms. Here, we evaluated rises in absolute CD4 T-cells, and specific CD4 T-cell responses in 4
HIV-1+ individuals presenting with mycobacterial associated IRIS who received in conjunction with ART, IL-2 plus GM-
CSF immunotherapy.
Methods: We assessed CD4 T-cell counts, HIV-1 RNA loads, phenotype for naïve and activation markers, and in vitro
proliferative responses. Results were compared with those observed in 11 matched, successfully treated asymptomatic
clinical progressors (CP) with no evidence of opportunistic infections, and uninfected controls.
Results: Median CD4 T-cell counts in IRIS patients rose from 22 cells/µl before initiation of ART, to 70 cells/µl after 8
months of therapy (median 6.5 fold increase). This coincided with IRIS diagnosis, lower levels of naïve CD4 T-cells,
increased expression of immune activation markers, and weak CD4 T-cell responses. In contrast, CP had a median CD4
T-cell counts of 76 cells/µl at baseline, which rose to 249 cells/µl 6 months post ART, when strong T-cell responses were
seen in > 80% of patients. Higher levels of expression of immune activation markers were seen in IRIS patients compared
to CP and UC (IRIS > CP > UC). Immunotherapy with IL-2 and GM-CSF paralleled clinical recovery.
Conclusion: These data suggest that mycobacterial IRIS is associated with inadequate immune reconstitution rather
than vigorous specific T-cell responses, and concomitant administration of IL-2 and GM-CSF immunotherapy with
effective ART may correct/augment T-cell immunity in such setting resulting in clinical benefit.
Published: 25 September 2005
Journal of Immune Based Therapies and Vaccines 2005, 3:7 doi:10.1186/1476-
8518-3-7
Received: 06 April 2004
Accepted: 25 September 2005
This article is available from: http://www.jibtherapies.com/content/3/1/7
© 2005 Pires et al; licensee BioMed Central Ltd.
This is an Open Access article distributed under the terms of the Creative Commons Attribution License (http://creativecommons.org/licenses/by/2.0),
which permits unrestricted use, distribution, and reproduction in any medium, provided the original work is properly cited.

Journal of Immune Based Therapies and Vaccines 2005, 3:7 http://www.jibtherapies.com/content/3/1/7
Page 2 of 11
(page number not for citation purposes)
Background
The degree of immune reconstitution observed in HIV-1+
individuals following initiation of antiretroviral therapy
(ART), is variable [1-4]. Although seen even in late-stage
disease, it is more prominent in patients who commence
treatment during early HIV-1 infection before substantial
damage to the immune system, where robust responses
are often seen after treatment [5-7]. Such responses likely
reflect effective immune surveillance, mimicking the ben-
eficial T-cell responses seen in untreated long-term non-
progressors, HIV-1 exposed but seronegative individuals,
and after therapeutic vaccination of asymptomatic
patients [8-10].
It has been postulated that after treatment of late-stage
HIV-1 infection, recovery and augmentation of immune
function, and responses to previous sub-clinical infec-
tions with existing pathogens such as Mycobacterium spp,
hepatitis B and hepatitis C viruses, or cytomegalovirus
(CMV) may result in exacerbated inflammatory diseases
[11-19]. This phenomenon, described by others as
immune reconstitution inflammatory syndrome (IRIS), is
mostly seen in profoundly immunosuppressed patients
with CD4 T-cell nadirs of less than 100 cells/µl, who upon
receiving ART rapidly achieve an undetectable plasma
viremia, and experience a very rapid increase in CD4 T
cells [12,14]. This complex syndrome presents with either
active opportunistic infections, or recurrence of previous
infections.
We investigated the quality and breadth of lymphoprolif-
erative responses in a group of HIV-1+ patients on stable
ART for > 6 months with suppressed viremia, diagnosed
with Mycobacterium avium complex (MAC) associated
IRIS, who were unresponsive to conventional anti-MAC
therapy. We showed that these patients lacked pathogen-
specific in vitro T-cell responses suggesting that the degree
and quality of immune reconstitution following ART is
inadequate to eliminate underlying opportunistic infec-
tions. Furthermore, immunotherapy with IL-2 and GM-
CSF in combination with effective ART appears to acceler-
ate augmentation of specific CD4 T-cell responses and
increase the rapidity of immune recovery allowing under-
lying opportunistic infections to be cleared and leading to
a better immediate outcome and resolution of IRIS.
Methods
Subjects studied
Fifteen HIV-1+ patients at the Chelsea and Westminster
Hospital, London, UK were studied. Four presented with
MAC-associated IRIS, and where acid-fast bacilli were
detected, patients were given anti-MAC therapy as soon as
diagnosed. These patients had a median CD4 T-cell count
of 22 cells/µl (interquartile range (IQR) 6.3–50.3) before
initiation of ART, rising to 70 cells/µl (IQR 63–123) after
8 months of therapy (Table 1). For clarity these subjects
will be referred to as IRIS patients. Previous reports define
IRIS as a syndrome occurring in individuals with a rising
CD4 T-cell count or percentage upon initiation of ART,
who develop new clinical pathologies with either a new
clinical presentation or reactivation of opportunistic
organisms [15,16]. Viral load was undetectable in all
patients at presentation of IRIS. IRIS patients (n = 4)
received immunotherapy as salvage therapy consisting of
IL-2 (Chiron Therapeutics, Uxbridge, UK) at 5 million
units twice daily subcutaneously for 5 days, in three cycles
4 weeks apart. During the third cycle of IL-2, concomitant
GM-CSF (Novartis, Schering-Plough, Camberley, UK) was
administered subcutaneously 150 µg daily for 5 days. The
remaining patients were asymptomatic clinical progres-
sors (n = 11) receiving ART for 6 months, with a median
CD4+ T-cell count of 76 cells/µl (IQR 22.5–90) at base-
line, rising to 249 cells/µl (IQR 187.5–303.5) 6 months
post ART, and with viral load levels from undetectable
(80% of patients) to 127 HIV-1 RNA copies/ml plasma.
These patients developed no secondary effects following
treatment, and had no evidence of opportunistic infec-
tions/exacerbated immune responses. Sixteen healthy
HIV uninfected donors were used as controls. Informed
consent was obtained from all patients for the administra-
tion of immunotherapy and investigations carried out,
and ethics committee approval was obtained for the stud-
ies described.
Plasma viral RNA assay
Viral load was measured at each time point of sample col-
lection using the Bayer HIV-1 RNA 3.0 assay (bDNA)
(Bayer Diagnostics, Newbury, UK) with lower detection
limit of 50 HIV-1 RNA copies/ml plasma.
Lymphocyte subset quantification
The Epics XL-MCL (Beckman Coulter, High Wycombe,
UK) was used for four-colour flow cytometric analysis.
Anti-human CD3, CD4, CD8, and CD45 were used to
analyze T cell subsets. Leukocytes were analysed on the
Epics XL-MCL flow cytometer using system II software in
conjunction with control reagents (Beckman Coulter)
which provide automated colour compensation, light
scatter and colour intensities.
T cell proliferation assay
Peripheral blood mononuclear cells (PBMC) were cul-
tured in triplicate with HIV-1 or other recall/viral antigen
in round-bottomed microtiter plates (Greiner, Gloucester,
UK) for 5 days as described previously [20-22]. The anti-
gens used were: Herpes simplex virus (HSV), purified
avian protein derivative of tuberculin (PPD), tetanus tox-
oid (TTox), Varicella-Zoster virus (VZV), Candida (CAN),
and Cytomegalovirus (CMV) as described in reference 21.
HIV-1 recombinant antigens were obtained from the

Journal of Immune Based Therapies and Vaccines 2005, 3:7 http://www.jibtherapies.com/content/3/1/7
Page 3 of 11
(page number not for citation purposes)
Medical Research Council Centralised Facility for AIDS
Reagents (National Institute for Biological Standards and
Controls, Potters Bar, UK) and comprised: recombinant
HIV-1-nef, recombinant HIV-1-gp120 and recombinant
HIV-1-p24 (all used at 10 µg/ml final concentration) [22].
Adjuvant-free Remune and its native-p24 antigens were a
generous gift from Dr Ronald Moss (Immune Response
Corporation, Carlsbad, USA) and were used at 3 µg/ml to
ensure that anti-HIV-1 responses were not overlooked due
to clade variability. On day 5, 100 µl of supernatant was
collected from each well and stored at -20°C for subse-
quent cytokine measurement, cells were pulsed with
[3H]thymidine (Amersham International, Amersham,
UK) and 16 h later cells were harvested onto glass fiber fil-
termats and counted (Wallac Oy, Turku, Finland). Results
are expressed as stimulation indices (SI) with a positive
response defined as an SI of 3 or more and ∆ counts per
minute (CPM) > 600 as described previously [21-23].
Control wells, for calculation of background activity, con-
tained PBMC only.
Measurement of IL-4 production
Fifty µl of supernatant from proliferative cultures was
transferred to 96-well round-bottomed plates in triplicate
for quantification of IL-4 on the indicator cell line CT.h4S
(a generous gift of W. Paul, Bethesda, MD) as previously
described [20-22]. Briefly, CT.h4S (5 × 10³ cells/well),
were added in 50 µl to 50 µl of supernatant to give a final
volume of 100 µl. After 24 h in culture, wells were pulsed
with [methyl-3H]thymidine, and cells were harvested as
described above. Results are expressed as the mean cpm
for triplicate cultures, with an error of the mean of ± 15%.
A positive result is defined as significant proliferation
above the background activity and detection threshold. In
all experiments, a standard titration of indicator cell pro-
liferation to a range of recombinant IL-4 from 0.01 to 100
U/ml was included. Control wells for calculation of back-
ground activity contained indicator cells only.
Phenotypic analysis of lymphocytes
PMBC were incubated with a panel of murine anti-human
mAbs (all Beckman Coulter), for 30 minutes at 4°C.
Directly conjugated antibodies used were: Fluorescein iso-
thiocyanate (FITC)-CD8, CD45RA; Phycoerytherin (PE)-
CD38, HLA-DR, CD27, and CD45RA; PE-cyanine (PC-5)-
CD4, all used according to the manufacturer's instruc-
tions. Cells were washed and fixed in PBS containing 2%
paraformaldehyde (Sigma). On acquisition, a gate was set
around the lymphocyte population on a forward scatter
versus side scatter dot plot, and 10,000 gated events col-
lected for each sample. Data analysis was performed using
CELLQuest™ Software (Becton Dickinson, Oxford, UK).
Appropriate isotype matched controls were run in parallel
for each sample.
Statistical analysis
Computer software (Statview 5.01; Abacus, Berkeley, CA)
was used for all statistical calculations. Data are presented
as median (inter-quartile range IQR). Analysis of data
between the different groups was performed using a Mann
Whitney-U-test and intra-group variations were compared
using the Wilcoxon signed rank test. P values below 0.05
were considered significant.
Results
Patients
We studied both IRIS and CP patients who had been
receiving effective ART for similar periods. IRIS was diag-
nosed at a median 10 months (IQR 8–13) after initiation
of ART (Table 1). This is in agreement with previous
Table 1: Clinical features of IRIS patients
Patient CD4 T cell
count before
ART cells/µl
CD4 T cell
count at
presentation
of IRIS cells/µl
Fold change in
CD4 T cell
counts from
baseline to
IRIS
presentation
CD4 T cell
count after
remission of
IRIS cells/µl
HIV-1 RNA at
presentation of
IRIS copies/ml
Reason for
admission
Time on
therapy*
Therapy
1 7 69 9.86 202 U/D MAC 8 d4T+ddI+NF
V+ImRx
2 37 70 1.89 140 U/D MAC 12 AZT+3TC+I
DV+ImRx
3 4 45 11.25 93 U/D MAC 18 d4T+ddI+NF
V+ImRx
4 90 280 3.11 601 U/D MAC 8 AZT+3TC+E
FV+ImRx
*Time in months from initiation of potent ART until diagnosis of IRIS. Drugs used in ART regime: Nucleoside analogues; Stavudine (d4T),
Didanosine (ddI), Lamivudine (3TC) and Zidovudine (AZT) Protease inhibitors; Nelfinavir (NFV), Indinavir (IDV), or Non-nucleoside reverse
transcriptase inhibitor; Efavirenz (EFV); ImRx = immunotherapy; MAC = Mycobacterium avium complex.

Journal of Immune Based Therapies and Vaccines 2005, 3:7 http://www.jibtherapies.com/content/3/1/7
Page 4 of 11
(page number not for citation purposes)
reports [24]. The patients did not recover from the under-
lying MAC infection despite receiving conventional anti-
MAC treatment, and were given IL-2 and GM-CSF in con-
junction with ART as salvage therapy as detailed in mate-
rials and methods and as previously described [9,21].
Increases in CD4 T-cell counts from baseline to IRIS diag-
nosis were observed in all patients. Viral load reached BDL
in all patients and remained undetectable throughout the
study.
IRIS patients receiving ART plus immunotherapy
Immunotherapy was initiated for severely immuno-com-
promised patients with exacerbated underlying MAC
infection (IRIS) who were unable to achieve remission
after receiving ART and anti-mycobacterial therapy. Four
patients with median CD4+ T-cell counts of 70 cells/µl
(IQR 63–123) after a median 10 months on ART, with
persistent MAC infection, received IL-2 and GM-CSF (see
Table 1 for drug regimen). PPD-specific T-cell responses
and responses to other recall/viral antigens were absent in
all patients before immunotherapy (Fig 1a). After admin-
istration of immunotherapy, we saw an increase in
median CD4+ T-cell counts to 171 cells/µl (IQR 128–302)
(Table 1). Moreover, we observed robust antigen-specific
T-cell responses to a panel of antigens including PPD.
Such responses were sometimes more vigorous than those
observed in patients on ART alone (Fig 1a), and were par-
alleled by remission from the underlying MAC infection.
Furthermore, immune reconstitution characterised by a
rise in CD4 T-cell counts and constant undetectable
plasma viremia was achieved. Patient 4 was admitted with
localised MAC associated lymphadenitis of the neck and
lacked in vitro proliferative responses to PPD and other
recall antigens despite a CD4 T-cell count of 280 cells/l
µblood. After administration of immunotherapy we
observed a rapid recovery in immune function (Fig 2a).
The parallel clinical manifestations depicted an improve-
ment in the neck lesion after IL-2 therapy and complete
remission post administration of IL-2 plus GM-CSF (Fig
2b–d). We also observed an increase in CD4 T-cell counts
from 280 to 601 cells/µl during this period (Table 1). No
significant changes were seen in HIV-1-specific T-cell
responses, which remained undetectable throughout the
study (Fig 1b).
In 3/4 IRIS patients we carried out IL-4 bioassays in cul-
ture supernatants, rather than ELISA, in order to assess the
levels of bioactive cytokine being produced. We were able
to detect production of IL-4 in cultures with antigens to
which the patients had been previously exposed including
anti-PPD responses in 2/3 patients (Fig 3). Upon initia-
tion of immunotherapy there was a decrease in IL-4 pro-
duction, which was paralleled by restoration of
proliferative specific-anti-PPD T-cell responses.
Lymphoproliferative T-cell responses to recall/viral
antigens in asymptomatic clinical progressors and
seronegative controls
We assessed T-cell proliferation in CP and uninfected con-
trols (UC) and compared these with the responses seen in
IRIS patients. CP presented a median 3.9 fold increase in
CD4 T-cell counts 6 months post initiation of ART from
76 cells/µl (IQR 22.5–90) to 249 cells/µl (IQR 187.5–
303.5) (p < 0.001) (Table 1). These patients remained
clinically asymptomatic and had detectable specific T-cell
responses to at least one recall antigen (Fig 4). All UC
showed vigorous responses to recall antigens (Fig 4).
Flow cytometry revealed higher levels of CD38 and HLA-
DR expression and lower levels of naïve CD4 T cells in IRIS
patients than in asymptomatic clinical progressors
Compared to CP, IRIS patients showed significantly
higher percentages of CD4+HLA-DR+ T lymphocytes (p <
0.005), and significantly higher percentages of
CD8+CD38+ T cells (p < 0.05) (Table 2). When activation
was quantified on a per cell basis, IRIS patients showed
higher levels of activation of both CD4 and CD8 T cells
compared to CP (p < 0.02 and p < 0.01, respectively), as
demonstrated by analysing the mean fluorescent intensity
levels of CD38 expression (Table 2). Furthermore, the
median percentage of naïve CD4+CD45RA+CD27+ T cells
in IRIS patients was significantly lower than in CP and UC
(p < 0.005). These observations are not surprising as IRIS
patients were more immuno-compromised when therapy
was initiated suggesting that IRIS may be associated with
persistent hyperactivation of both CD4 and CD8 T lym-
phocytes, and associated with a lack of naïve CD4 T cells
possibly due to absence of thymic function.
Discussion
Immune reconstitution after initiation of ART may be
concurrent with both an increase in immuno-pathologi-
cal responses against opportunistic pathogens and with
the induction of IRIS [11-19,24]. The IRIS phenomenon
has been ascribed to vigorous immune responses specific
to underlying pathogens, with clinical manifestations
related to the immune response elicited against such path-
ogens. Typically, IRIS patients have an undetectable viral
load, and CD4 T-cell counts that have rapidly increased,
by 3 or 4 fold, shortly after initiation of ART. Previous
studies have used delayed type hypersensitivity (DTH)
tests to assess the cell-mediated immunity of these
patients [12,14,15]. In contrast, we used the thymidine
incorporation assay to evaluate lymphocyte proliferation.
This allows visualisation of in vitro immune function of T
lymphocytes in peripheral blood and direct comparison
with asymptomatic HIV-1+ subjects as well as uninfected
controls. Some reports have shown the lack of correlation
between these two assays [25], as functionally T-cell
Journal of Immune Based Therapies and Vaccines 2005, 3:7 http://www.jibtherapies.com/content/3/1/7
Page 5 of 11
(page number not for citation purposes)
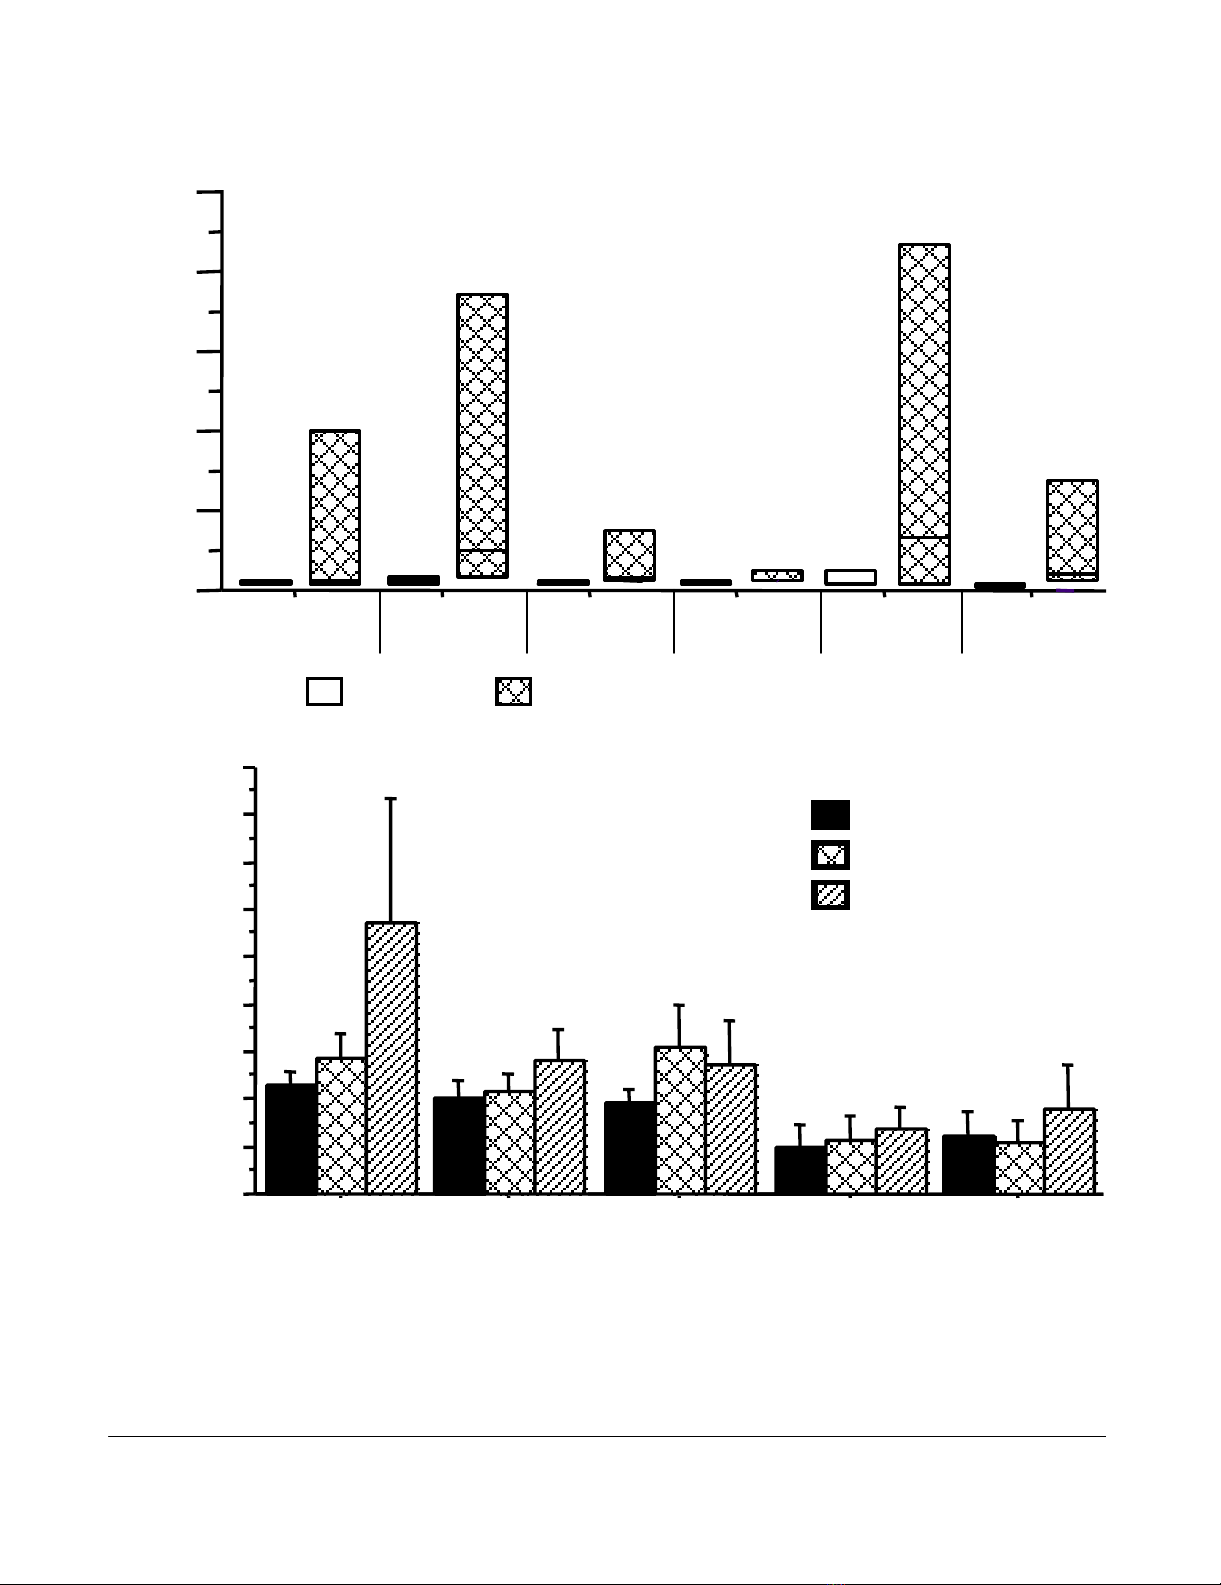
(a – top) Lymphoproliferative responses to a panel of recall antigens in IRIS patients during IRIS manifestation and post remissionFigure 1
(a – top) Lymphoproliferative responses to a panel of recall antigens in IRIS patients during IRIS manifestation
and post remission. Open bars denote T cell responses during IRIS manifestation and hatched bars represent T cell
responses after immunotherapy with IL-2 plus GM-CSF in conjunction with ART and resolution of IRIS. Data are shown as
median SI values with interquartile ranges. X-axis depicts the recall antigens tested. (b- bottom) HIV-1-specific lympho-
proliferative responses in IRIS patients. Data depicted are before immunotherapy (solid bars), 4 weeks after IL-2 admin-
istration (crossed bars) and 4 weeks after IL-2 plus GM-CSF (hatched bars). Data are shown as median values with interquartile
ranges.
0
0.5
1.0
1.5
2.0
2.5
3.0
3.5
4.0
4.5
nef gp120 p24 Native p24 Remune
IL2+ GMCSF
IL2
BL
Stimulation Index (SI) Stimulation Index (SI)
HSV PPD CAN
VZOS CMV
TTOX
0
10
20
30
40
50
Post Immunotherapy and IRD resolutionDuring IRD


![Vaccine và ứng dụng: Bài tiểu luận [chuẩn SEO]](https://cdn.tailieu.vn/images/document/thumbnail/2016/20160519/3008140018/135x160/652005293.jpg)


%20--%3e%3cdefs%3e%3cstyle%3e%20.st0%20{%20fill:%20%23fff;%20}%20.st1%20{%20fill:%20%237800fa;%20}%20%3c/style%3e%3c/defs%3e%3cpath%20class='st1'%20d='M117.78,12.18H43.11c2.9,3.47,4.65,7.94,4.65,12.82,0,5.6-2.3,10.66-6.01,14.29h76.02l7.22-13.56-7.22-13.56Z'/%3e%3cg%3e%3cpath%20class='st0'%20d='M53.58,26.17h-.59v-1.46h.59v-4.96h2.83c1.78,0,2.67.94,2.67,2.82v5.76c0,1.87-.89,2.81-2.67,2.81h-2.83v-4.96ZM55.36,21.37v3.34h1.1v1.46h-1.1v3.34h1.01c.61,0,.91-.37.91-1.1v-5.93c0-.74-.3-1.1-.91-1.1h-1.01Z'/%3e%3cpath%20class='st0'%20d='M65.99,31.14h-1.8l-.31-2.07h-2.19l-.31,2.07h-1.64l1.82-11.39h2.62l1.82,11.39ZM65.28,18.04c-.25.46-.51.77-.75.94-.21.15-.47.22-.79.22-.26,0-.57-.07-.92-.22l-.38-.15c-.14-.05-.26-.07-.37-.07-.3,0-.53.18-.71.54l-.91-.68c.25-.46.51-.77.75-.94.21-.14.48-.21.79-.21.26,0,.57.07.92.21l.38.15c.14.05.26.07.37.07.3,0,.53-.18.71-.54l.91.68ZM61.91,27.52h1.73l-.87-5.76-.87,5.76Z'/%3e%3cpath%20class='st0'%20d='M74.53,26.89v1.52c0,1.91-.89,2.86-2.67,2.86s-2.67-.95-2.67-2.86v-5.93c0-1.91.89-2.86,2.67-2.86s2.67.95,2.67,2.86v1.11h-1.69v-1.22c0-.75-.31-1.12-.93-1.12s-.93.37-.93,1.12v6.15c0,.74.31,1.11.93,1.11s.93-.37.93-1.11v-1.63h1.69Z'/%3e%3cpath%20class='st0'%20d='M81.4,31.14h-1.8l-.31-2.07h-2.19l-.31,2.07h-1.64l1.82-11.39h2.62l1.82,11.39ZM75.9,19.2l1.52-1.91h1.71l1.51,1.91h-1.61l-.76-.95-.75.95h-1.61ZM77.32,27.52h1.73l-.87-5.76-.87,5.76ZM83.1,15.99l-1.76,1.91h-1.26l1.17-1.91h1.86Z'/%3e%3cpath%20class='st0'%20d='M84.86,19.75c1.78,0,2.67.94,2.67,2.82v1.48c0,1.87-.89,2.81-2.67,2.81h-.85v4.28h-1.79v-11.39h2.64ZM84.01,21.37v3.86h.85c.58,0,.87-.36.87-1.08v-1.71c0-.71-.29-1.07-.87-1.07h-.85Z'/%3e%3cpath%20class='st0'%20d='M93.51,19.75c1.78,0,2.67.94,2.67,2.82v1.48c0,1.87-.89,2.81-2.67,2.81h-.85v4.28h-1.79v-11.39h2.64ZM92.66,21.37v3.86h.85c.58,0,.87-.36.87-1.08v-1.71c0-.71-.29-1.07-.87-1.07h-.85Z'/%3e%3cpath%20class='st0'%20d='M98.8,31.14h-1.79v-11.39h1.79v4.88h2.03v-4.88h1.83v11.39h-1.83v-4.88h-2.03v4.88Z'/%3e%3cpath%20class='st0'%20d='M105.36,24.55h2.46v1.62h-2.46v3.34h3.09v1.63h-4.88v-11.39h4.88v1.63h-3.09v3.18ZM108.17,17.29l-1.76,1.91h-1.26l1.17-1.91h1.86Z'/%3e%3cpath%20class='st0'%20d='M112.2,19.75c1.78,0,2.67.94,2.67,2.82v1.48c0,1.87-.89,2.81-2.67,2.81h-.85v4.28h-1.79v-11.39h2.64ZM111.35,21.37v3.86h.85c.58,0,.87-.36.87-1.08v-1.71c0-.71-.29-1.07-.87-1.07h-.85Z'/%3e%3c/g%3e%3ccircle%20class='st1'%20cx='25'%20cy='25'%20r='20'/%3e%3cpath%20class='st0'%20d='M32.78,19.27c2.92,0,4.43,2.55,5.28,5.33l.71,2.17c.14.38-.33.75-.71.75h-5.61c.19-.33.24-.71.09-1.08l-.75-2.45c-.43-1.32-.99-2.64-1.79-3.77.75-.57,1.65-.94,2.78-.94h0ZM25,18.38c3.25,0,4.9,2.78,5.89,5.89l.76,2.45c.14.42-.33.8-.8.8h-11.69c-.42,0-.94-.38-.8-.8l.75-2.45c.99-3.11,2.64-5.89,5.89-5.89h0ZM25,11.35c1.74,0,3.11,1.37,3.11,3.11s-1.37,3.11-3.11,3.11-3.11-1.41-3.11-3.11,1.41-3.11,3.11-3.11h0ZM17.27,19.27c1.08,0,1.98.38,2.73.94-.8,1.13-1.37,2.45-1.74,3.77l-.8,2.45c-.14.38-.05.75.09,1.08h-5.56c-.42,0-.9-.38-.75-.75l.71-2.17c.9-2.78,2.41-5.33,5.33-5.33h0ZM17.27,12.91c1.51,0,2.78,1.27,2.78,2.83s-1.27,2.83-2.78,2.83-2.83-1.27-2.83-2.83,1.27-2.83,2.83-2.83h0ZM32.78,12.91c1.56,0,2.78,1.27,2.78,2.83s-1.23,2.83-2.78,2.83-2.83-1.27-2.83-2.83,1.27-2.83,2.83-2.83h0ZM27.07,28.56v.09c0,.57-.24,1.08-.61,1.46h0v.05c-.38.33-.9.57-1.46.57s-1.08-.24-1.46-.61h0c-.38-.38-.61-.9-.61-1.46v-.09h1.41v.09c0,.19.05.38.19.47v.05c.09.09.28.19.47.19s.38-.09.47-.19v-.05c.14-.09.24-.28.24-.47t-.05-.09h1.41ZM30.99,28.56v.09c0,1.65-.66,3.16-1.74,4.24-1.08,1.08-2.59,1.79-4.24,1.79s-3.16-.71-4.24-1.79l-.05-.05c-1.04-1.08-1.7-2.55-1.7-4.2v-.09h1.41v.09c0,1.27.47,2.4,1.27,3.25h.05c.85.85,1.98,1.37,3.25,1.37s2.4-.52,3.25-1.37c.85-.8,1.37-1.98,1.37-3.25v-.09h1.37ZM34.99,28.56v.09c0,2.78-1.13,5.28-2.92,7.07-1.79,1.79-4.29,2.92-7.07,2.92s-5.23-1.13-7.07-2.92c-1.79-1.79-2.92-4.29-2.92-7.07v-.09h1.41v.09c0,2.4.94,4.53,2.5,6.08,1.56,1.56,3.72,2.5,6.08,2.5s4.52-.94,6.08-2.5c1.56-1.56,2.5-3.68,2.5-6.08v-.09h1.41Z'/%3e%3c/svg%3e)