
RESEARC H Open Access
The head-regeneration transcriptome of the
planarian Schmidtea mediterranea
Thomas Sandmann
1,2*
, Matthias C Vogg
3
, Suthira Owlarn
3
, Michael Boutros
1,4
and Kerstin Bartscherer
3*
Abstract
Background: Planarian flatworms can regenerate their head, including a functional brain, within less than a week.
Despite the enormous potential of these animals for medical research and regenerative medicine, the mechanisms
of regeneration and the molecules involved remain largely unknown.
Results: To identify genes that are differentially expressed during early stages of planarian head regeneration, we
generated a de novo transcriptome assembly from more than 300 million paired-end reads from planarian
fragments regenerating the head at 16 different time points. The assembly yielded 26,018 putative transcripts,
including very long transcripts spanning multiple genomic supercontigs, and thousands of isoforms. Using short-
read data from two platforms, we analyzed dynamic gene regulation during the first three days of head
regeneration. We identified at least five different temporal synexpression classes, including genes specifically
induced within a few hours after injury. Furthermore, we characterized the role of a conserved Runx transcription
factor, smed-runt-like1. RNA interference (RNAi) knockdown and immunofluorescence analysis of the regenerating
visual system indicated that smed-runt-like1 encodes a transcriptional regulator of eye morphology and
photoreceptor patterning.
Conclusions: Transcriptome sequencing of short reads allowed for the simultaneous de novo assembly and
differential expression analysis of transcripts, demonstrating highly dynamic regulation during head regeneration in
planarians.
Background
The limited regenerative capabilities of humans call for
therapies that can replace or heal wounded tissues. The
treatment of neurodegenerative diseases has been a
major focus of regenerative medicine, as these diseases
can cause irreversible damage to the central nervous
system (CNS). It is crucial, therefore, to understand the
molecular mechanisms of regeneration and the intrinsic
and extrinsic signals that induce and promote this
process.
Planarian flatworms are one of the few animals that
can regenerate their CNS. Planarians are free-living Pla-
tyhelminthes with a relatively simple CNS consisting of
a bilaterally symmetrical brain made from two cephalic
ganglia, and two longitudinal ventral nerve cords, which
extend along the body axis and send out axonal projec-
tions into nearly any micrometer of the body (reviewed
in [1]). Despite its relatively simple morphology, the pla-
narian brain is highly complex at the cellular level, and
consists of a large number of different neuronal cell
types [2-4]. Many genes expressed in the planarian CNS
are highly conserved in humans [5].
Planarians are characterized by their large pool of
pluripotent adult stem cells that facilitate the regenera-
tion of whole animals from only small pieces of their
body (reviewed in [6]). Strikingly, planarians can develop
a new head within a week. This process can be classified
into several distinct events. First, wounding induces a
generic, body-wide proliferation response of stem cells
within the first 6 hours. Attracted by as yet unidentified
guidance signals possibly released from cells at the site
of tissue loss, stem cells accumulate at the wound within
18 hours. This response is regeneration-specific and is
* Correspondence: t.sandmann@dkfz.de; kerstin.bartscherer@mpi-muenster.
mpg.de
1
Division Signaling and Functional Genomics, German Cancer Research
Center (DKFZ), Im Neuenheimer Feld 580, D-69120 Heidelberg, Germany
3
Max Planck Research Group Stem Cells and Regeneration, Max Planck
Institute for Molecular Biomedicine, Von-Esmarch-Str. 54, 48149 Münster,
Germany
Full list of author information is available at the end of the article
Sandmann et al.Genome Biology 2011, 12:R76
http://genomebiology.com/2011/12/8/R76
© 2011 Sandmann et al.; licensee BioMed Central Ltd. This is an open access article distributed under the terms of the Creative
Commons Attribution License (http://creativecommons.org/licenses/by/2.0), which permits unrestricted use, distribution, and
reproduction in any medium, provided the original work is properly cited.

not detected in wounded animals that have not experi-
enced any tissue loss [7]. A second, regeneration-speci-
fic, localized proliferation response that reaches its peak
after 2 days of regeneration generates stem cell progeny
that contribute to the growth of the blastema. This pro-
geny starts to differentiate into different cell types
between 1 and 2 days after the cut [7]. In decapitated
animals, brain rudiment is detected within 24 hours,
which continuously grows and develops into a properly
patterned bi-lobed brain. The first clusters of photore-
ceptor neurons appear between 2 and 3 days, dorsally to
the brain. With photoreceptors-to-brain, and brain-to-
ventral nerve cord connections, structural and functional
recovery is completed between 4 to 7 days of regenera-
tion [8,9].
Their unique regenerative properties in combination
with the efficiency of gene knockdown by RNA interfer-
ence (RNAi) have made planarians an attractive model
organism for investigating the molecular processes that
underlie regeneration and stem cell biology in vivo
(reviewed in [10,11]). One of the most frequently used
species in planarian research is Schmidtea mediterranea.
These planarians were collected in the Mediterranean
area and have been maintained in laboratories world-
wide for many years, often as clonal lines originating
from a single wild animal. They reproduce sexually or
asexually by fission, are 0.1 to 2 cm in size, and have a
diploid genome of approximately 850 Mb, arranged into
four chromosomes [12].
Based on the S. mediterranea genome sequencing pro-
ject [13], approximately 30,000 genes have been pre-
dicted using the MAKER genome annotation pipeline
[12]. However, the repetitiveness and A/T richness of
the genome, and the fragmentation of its assembly into
approximately 43,000 supercontigs, make genome anno-
tations difficult, resulting in many incomplete, redun-
dant and error-laden predictions.
To overcome these limitations and to discover poten-
tial regulators of planarian head regeneration, we con-
structed an annotated head regeneration transcriptome
library by de novo assembly of hundreds of millions of
short raw reads generated by next generation sequen-
cing without genomic sequence information. We used
this library to map and count expressed sequence reads
from different stages of regeneration and identified hun-
dreds of genes showing differential expression at differ-
ent time points during the first 3 days following
decapitation. We show that an early growth response
(EGR)-like gene is transcriptionally induced as an early
response to injury. In addition, we further characterized
the biological function of a putative Runx transcription
factor, smed-runt-like1, which controls photoreceptor
patterning during the regeneration of the visual system.
Our study demonstrates that next generation sequencing
is a powerful tool for gene function discovery even in
organisms with no or only poorly annotated genomes.
Results
A time course of planarian head regeneration
To study the dynamic changes in gene expression dur-
ing head regeneration, we collected samples at 16 differ-
ent time points between 30 minutes and 3 days after
head amputation, as well as two control samples frozen
immediately after decapitation. To facilitate the detec-
tion of genes expressed in or proximal to the blastema,
we extracted mRNA specifically from anterior pre-phar-
yngeal tissue rather than from whole animals (Figure
1a). We prepared seven fragmented cDNA libraries for
2 × 36-bp paired-end sequencing, each including mate-
rial from two to four pooled samples (Figure 1b).
Sequencing on an Illumina Genome Analyzer II yielded
more than 336 million raw reads (168 million read
pairs), of which 274 million (81.5%) could be mapped to
supercontigs of the preliminary S. mediterranea genome
assembly using Tophat [14]. While good correspondence
between MAKER gene predictions and Illumina read
coverage was observed in some cases (Figure 1c), we fre-
quently detected transcription from genomic regions
lacking annotation (Figure 1d). To identify differentially
expressed loci independent of prior gene annotation, we
therefore used our short-read transcriptome sequencing
(RNAseq) data to assemble the expressed transcriptome
de novo.
De novo assembly with Velvet and Oases
The assembly of transcripts needs to account for alter-
native splicing events as well as post-transcriptional
sequence modifications, for example, poly-adenylation of
RNAs. After filtering the dataset for low base-calling
quality, we employed a two-step strategy to assemble
the remaining 318 million (94.6%) high quality reads: we
first generated a preliminary assembly using Velvet [15],
incorporating 187 million reads (58.8%), followed by the
construction of transcripts by Oases [16]. We obtained
26,018 transcripts, corresponding to 18,780 non-overlap-
ping sequences (Figure 2a; Illumina) with a minimum
length of 200 bp.
To assess the quality of this assembly, we first com-
pared it to results obtained with a complementary
sequencing technique, Roche 454 sequencing. Recently,
two independent studies generated 454 sequence data-
sets from different stages and tissues of S. mediterranea
[17,18]. To generate reference sequences for comparison
with the Illumina assembly, we assembled these datasets,
separately or combined into a single set of 454 reads,
using the isoform-aware assembler Newbler 2.5. As
expected, combining reads from both 454 datasets sig-
nificantly improved both individual assemblies, as
Sandmann et al.Genome Biology 2011, 12:R76
http://genomebiology.com/2011/12/8/R76
Page 2 of 19
judged, for example, by the improved average and maxi-
mum lengths of the assembled transcripts (N50 = 1.1
kb, longest sequences = 12.2 kb) (Figure S1a-c in Addi-
tional file 1) and an improved orthology hit ratio (Figure
S1d in Additional file 1). To evaluate assembly quality,
we compared our short-read de novo assembly with the
assembly obtained with the combined 454 datasets
(’454’).
Transcriptome assemblies based on Illumina or 454
data yielded similar numbers of isogroups (non-overlap-
ping sequences, from hereon referred to as genes) and
isotigs (isogroups and their putative splice isoforms,
from hereon referred to as transcripts) (Figure 2a), as
well as comparable mean sequence lengths (454, 946 bp;
Illumina, 1,005 bp). Yet, their length distributions dif-
fered, with the Illumina assembly being strongly skewed
towards longer sequences, reflected in a high weighted
median statistic (N50 = 1.5 kb) and greater maximum
transcript length (16.7 kb), and the 454 assembly pre-
senting a more symmetrical distribution with a median
of 839 bp (Figure 2b), approximately twice the length of
the reported raw reads (Figure S1e in Additional file 1).
60k 70k 80k 90k 100k 110k 120k 130k
v31.000002:54000..133999
MAKER prediction
mk4.000002.04.01
500
0
Illumina+ Gene_818Gene_4797
440k 450k
4
60k 470k
v31.000002:438400..475899
I
llumina+
Gene
_
14234 Gene
_
10726
Gene_9154
MAKER prediction
mk4.000002.19.01
mk4.000002.45.01mk4.000002.43.01 mk4.000002.18.01
mk4.000002.44.01
mk4.000002.17.01
600
300
0
Illumina coverage
I
llumina coverage
(
b
)
(a)
**
1st amputation 2nd amputation
regeneration
for 0h - 3d
RNA
extraction
Illumina
paired-end
sequencing
(d)
AB
Time after amputation (hours)
072246 1224 810 141618
CD E
ctrl
(c)
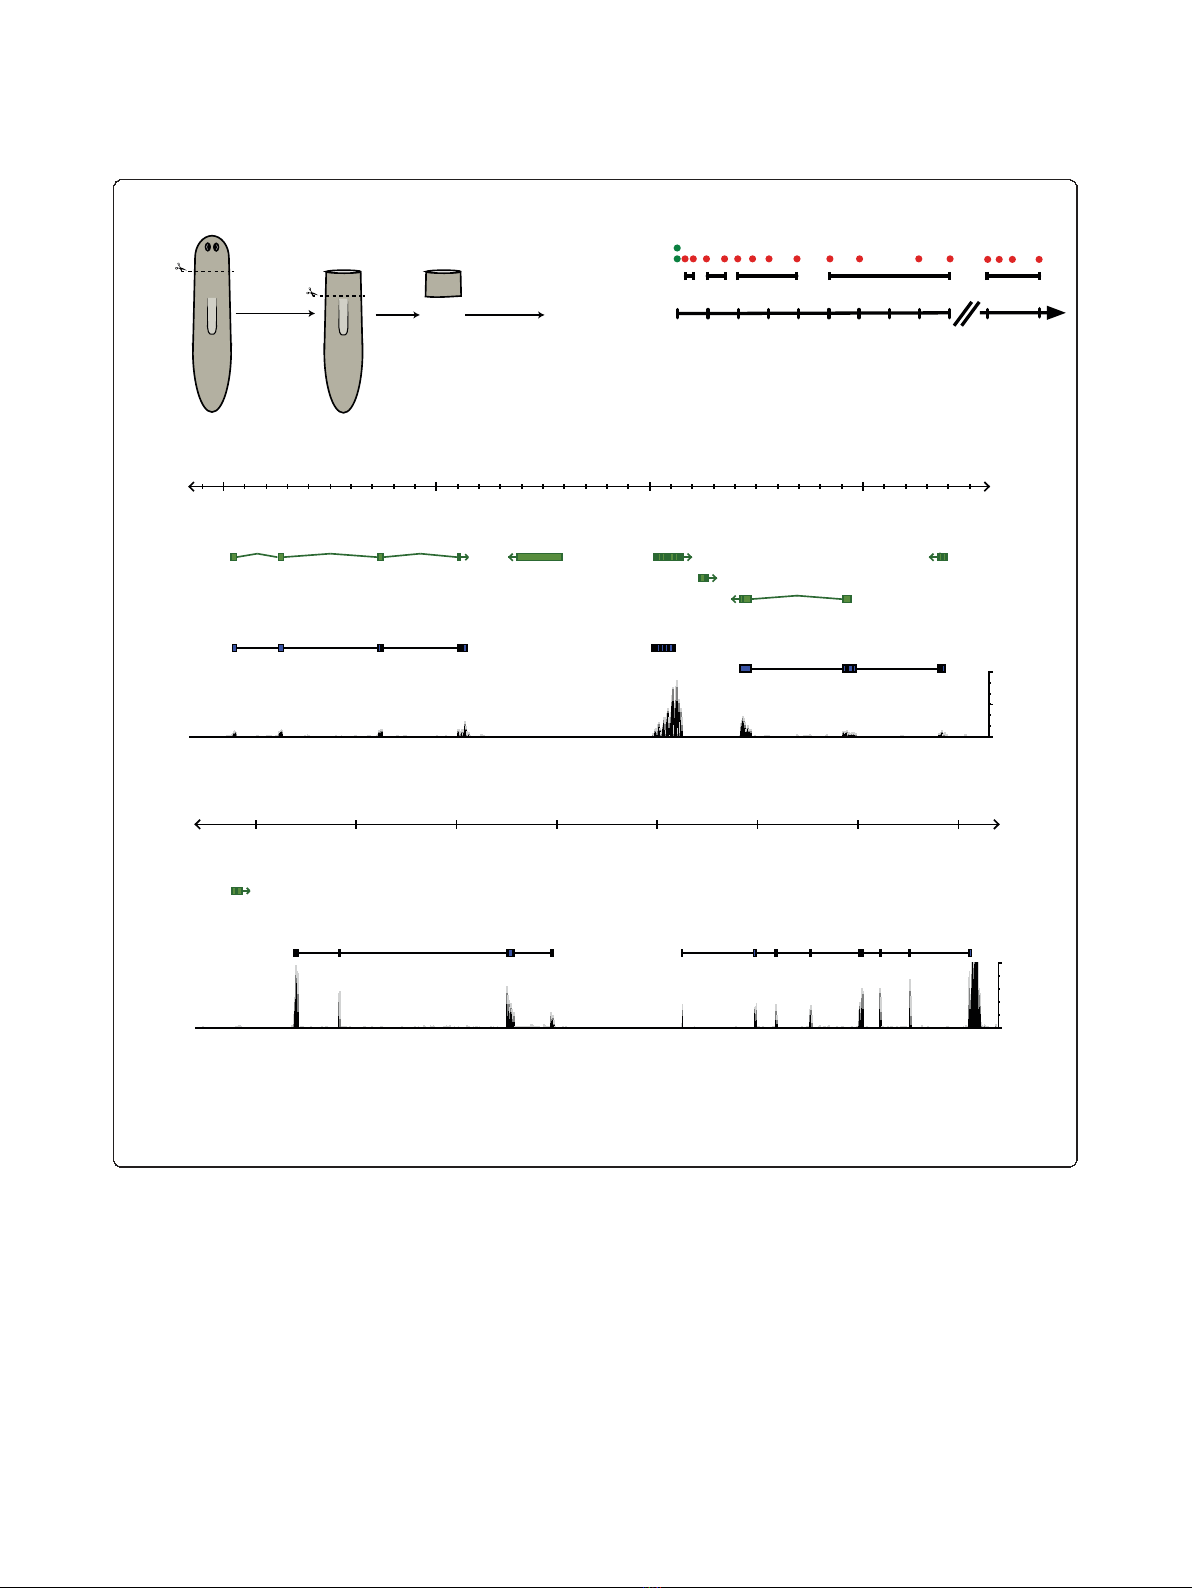
Figure 1 Next generation sequencing reveals the planarian head regeneration transcriptome.(a) Schematic overview of the two-step
amputation and sample collection approach. (b) Schematic overview of the regeneration time course. Individual samples are indicated as red
dots, which were analyzed in five pooled sequencing libraries (black lines, A to E). Two independent control samples were taken immediately
after amputation (green dots). (c, d) Examples of Illumina transcriptome sequencing (RNAseq) reads mapped with Tophat to regions on
genomic supercontig v31.000002. The short read coverage, calculated from reads from all sequenced samples, is shown in black. Green gene
models represent MAKER predictions; blue models exemplify the results of the de novo assembly (Illumina+).
Sandmann et al.Genome Biology 2011, 12:R76
http://genomebiology.com/2011/12/8/R76
Page 3 of 19
(
a
)
(b)
Illumina
454
Illumina+
Maker
(c)
(d) (e)
1.3 Mio
1.2 Mio reads
18380 Genes
24962 Transcripts
Max: 12.2 kb
N50: 1.1 kb
2 x 168 Mio
36 bp
318 Mio reads
18780 Genes
26018 Transcripts
Max: 16.7 kb
N50: 1.5 kb
454
Trimming & Filtering Trimming & Filtering
Velvet & Oases Newbler 2.5
Illumina
2 x 170 Mio
36 bp
318 Mio reads
17465 Genes
24669 Transcripts
Max: 17.6 kb
N50: 1.6 kb
Illumina+
Velvet & Oases
Trimming & Filtering
Gene length
(longest t ransc ript, bp)
Density
0.0000
0.0002
0.0004
0.0006
0.0008
0.0010
0.0012
0 1000 2000 3000 4000 5000
Ortholog hit ratio
Density
0.0
0.5
1.0
1.5
0 0.2 0.4 0.6 0.8 1.0 1.2 1.4
F raction of t ransc ript
aligned (%)
F raction of sequences mapped (%)
0
20
40
60
80
90 60
C overage (%)
20
40
60
80
100
454
Illumina
Illumina+
Maker
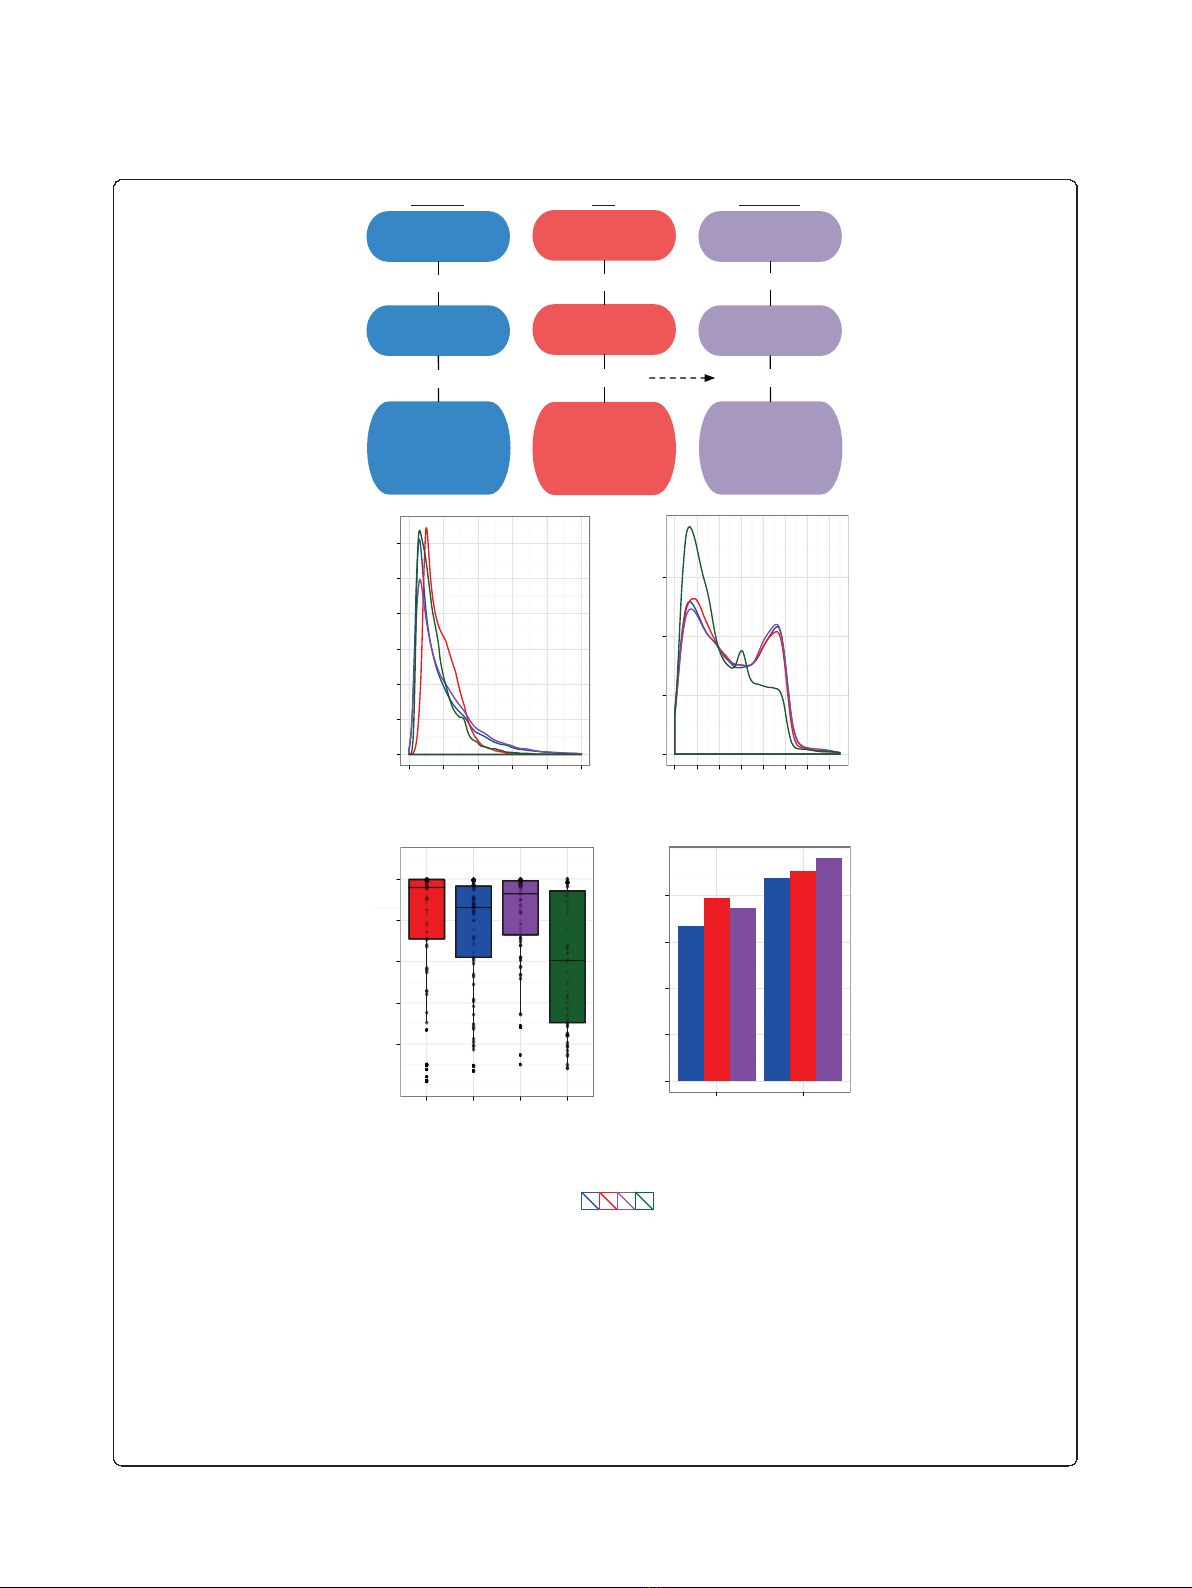
Figure 2 De novo assembly of the planarian head regeneration transcriptome.(a) Schematic overview of the assembly strategies, using
only 2 × 36-bp paired-end Illumina reads (blue), only 454 reads (red), or an assisted assembly of Illumina reads using transcripts previously
assembled from 454 data as scaffolds (purple). Quality metrics shown include longest sequences in each assembly and the length N50, for which
50% of all bases are contained in transcripts at least as long as N50. (b) Kernel densities of the length distributions for sequences assembled
only from Illumina data (blue), 454 data (red), Illumina data and 454 isotig scaffolds (purple), or for computationally predicted transcripts by
MAKER (green). For multi-isoform loci, only the longest isoform was considered. (c) Kernel densities of ortholog hit ratios obtained by comparing
sequences from the different assemblies or computational prediction to the Schistosoma mansoni proteome using blastx. For multi-isoform loci,
only the longest isoform was considered. Colors as in (b). (d) Coverage of the 125 complete cDNA sequences from S. mediterranea available
from GenBank by the best reciprocal blat hit from each dataset. For multi-isoform loci, only the longest isoform was considered. The boxplot
indicates the 75th, 50th (median) and 25th percentile of cDNA coverage. In addition, individual points show the full coverage distribution for all
reciprocal best hits (454, n= 77; Illumina, n= 86; Illumina+, n= 75; MAKER, n= 60). (e) Fraction of sequences from the different assemblies that
could be aligned over 90% or 60% of their total length to a single genomic supercontig using blat. Colors as in (b).
Sandmann et al.Genome Biology 2011, 12:R76
http://genomebiology.com/2011/12/8/R76
Page 4 of 19

Both assemblies reached an average length greater than
the computational set of predictions made by MAKER
(mean, 796 bp; median, 624 bp).
To investigate whether the increase in average
sequence length observed in our de novo assemblies was
likely to reflect improved gene models rather than arti-
facts due to greedy assembly algorithms, we identified
the closest homologs for all genes in the genome of
Schistosoma mansoni, the evolutionarily closest species
with a high-quality gene annotation, and determined the
ortholog hit ratios for assembled or predicted sequences
(Figure 2c) [19]. Both 454- and Illumina-based assem-
blies display similar bimodal ratio distributions: one
group of genes achieved an ortholog hit ratio close to
1.0 and was therefore likely to contain near full-length
sequences. A second peak, at a ratio of approximately
0.15, indicated that a roughly similarly sized group con-
tained genes considerably shorter than their best blast
homolog in S. mansoni. Most of the computational
MAKER predictions fell into the latter group, highlight-
ing the validity of the additional information available
through transcriptome sequencing.
As an alternative way of assessing the quality of our
assemblies, we compared the 125 full length S. mediter-
ranea cDNA sequences available from NCBI’s GenBank
with their best reciprocal blat hits from each assembly.
Most known genes were well represented in each assem-
bly (Figure 2d). For example, the Illumina+ assembly
contained near full-length sequences (median of 92.9%
cDNA sequence recovered) for 75 (60%) of the 125
known genes.
Next, we mapped the assembled genes onto the
approximately 43,000 genomic supercontigs using blat
[20]. As no genomic information had been used to con-
struct the transcriptome, an independent convergence of
de novo assembled and genomic sequences would indi-
cate a high quality of the assembly process. More than
two thirds (67%) of all genes assembled from Illumina
data could be matched to the genome with alignments
including more than 90% of each transcript length.
Withthesamesettings,aconsiderably larger fraction,
79%, of the sequences assembled from 454 data could
be matched (Figure 2e). By allowing alignments includ-
ing only 60% of the gene length, nearly all of the
sequences from the 454 assembly (96.1%) and a very
large fraction of the Illumina dataset (87%) could be
located on a single genomic supercontig.
The draft genome assembly is highly fragmented and
44% of all supercontigs are shorter than 10 kb (median
length of 11.3 kb), putting them into the same size
range as the longest sequences in our de novo assem-
blies (Additional file 2). We therefore inspected the par-
tial alignments of long gene loci that could not be
aligned to any single supercontig. We identified 1,449
sequences (length > 1,000 bp) with non-overlapping,
high-scoring alignments to different supercontigs. Of
these, 413 displayed significant homology to proteins in
the NCBI non-redundant protein database overlapping
with the putative supercontig junctions, lending inde-
pendent support to the validity of our de novo assem-
blies (Additional file 3; see Materials and methods for
details). For example, four transcripts from Gene_1033
up to 13.4 kb long were assembled from Illumina short-
read data, while only short fragments of these tran-
scripts could be assembled using the 454 datasets. The
transcripts could be aligned to supercontig v31.000152
at their 5’ends (6.2 kb, 47% of the longest transcript),
but matched supercontig v31.005068 at their 3’ends
(6.1 kb, 45.5% of the longest transcript) with more than
99% identity between cDNA and genome sequence (Fig-
ure 3).
The closest mouse ortholog, the Hy-3 gene, is homolo-
gous to both the 5’and 3’end of the transcripts’
sequences and aligns to the same genomic regions,
pointing towards the physical continuity of these two
supercontigs. We tested this hypothesis experimentally
and confirmed it by PCR amplification and Sanger
sequencing of a supercontig-spanning sequence (Figure
3; Additional file 4). This exemplifies the potential for
de novo transcriptome assemblies to aid in refining the
S. mediterranea genome, similar to a recent case study
performed on the Caenorhabditis elegans genome [21].
Closer inspection of the alignment of mouse Hy-3 also
revealed overlap with the adjacent, separate gene identi-
fied in our assembly (Figure 3, Gene_8274), which is
likely continuous with Gene_1033.
To independently verify the expression of individual
genes assembled from Illumina short-read data, we
picked 14 sequences for experimental validation of
expression and amplicon size by RT-PCR, all of which
could be detected at the expected sequence lengths,
further demonstrating the accuracy of our de novo
assembly (Additional file 5).
Based on these combined results, we conclude that
our paired-end Illumina transcriptome assembly con-
tained high quality, often near full-length sequences. To
improve the assembly further, while maintaining the
ability to assemble multiple isoforms for each gene, we
repeated the Velvet/Oases assembly of the Illumina
reads, this time providing the result of the 454 assembly
and EST sequences obtained from GenBank as scaffolds
to the algorithms. This allowed us to connect isolated
clusters of assembled Illumina reads via bridging with
longer sequences, while still requiring a minimum short
read coverage of the final sequence. This ‘assisted
assembly’yielded 24,669 isotigs/transcripts, grouped into
17,465 isogroups/genes and achieved a further increase
in average and maximum transcript lengths (maximum
Sandmann et al.Genome Biology 2011, 12:R76
http://genomebiology.com/2011/12/8/R76
Page 5 of 19


![PET/CT trong ung thư phổi: Báo cáo [Năm]](https://cdn.tailieu.vn/images/document/thumbnail/2024/20240705/sanhobien01/135x160/8121720150427.jpg)


%20--%3e%3cdefs%3e%3cstyle%3e%20.st0%20{%20fill:%20%23fff;%20}%20.st1%20{%20fill:%20%237800fa;%20}%20%3c/style%3e%3c/defs%3e%3cpath%20class='st1'%20d='M117.78,12.18H43.11c2.9,3.47,4.65,7.94,4.65,12.82,0,5.6-2.3,10.66-6.01,14.29h76.02l7.22-13.56-7.22-13.56Z'/%3e%3cg%3e%3cpath%20class='st0'%20d='M53.58,26.17h-.59v-1.46h.59v-4.96h2.83c1.78,0,2.67.94,2.67,2.82v5.76c0,1.87-.89,2.81-2.67,2.81h-2.83v-4.96ZM55.36,21.37v3.34h1.1v1.46h-1.1v3.34h1.01c.61,0,.91-.37.91-1.1v-5.93c0-.74-.3-1.1-.91-1.1h-1.01Z'/%3e%3cpath%20class='st0'%20d='M65.99,31.14h-1.8l-.31-2.07h-2.19l-.31,2.07h-1.64l1.82-11.39h2.62l1.82,11.39ZM65.28,18.04c-.25.46-.51.77-.75.94-.21.15-.47.22-.79.22-.26,0-.57-.07-.92-.22l-.38-.15c-.14-.05-.26-.07-.37-.07-.3,0-.53.18-.71.54l-.91-.68c.25-.46.51-.77.75-.94.21-.14.48-.21.79-.21.26,0,.57.07.92.21l.38.15c.14.05.26.07.37.07.3,0,.53-.18.71-.54l.91.68ZM61.91,27.52h1.73l-.87-5.76-.87,5.76Z'/%3e%3cpath%20class='st0'%20d='M74.53,26.89v1.52c0,1.91-.89,2.86-2.67,2.86s-2.67-.95-2.67-2.86v-5.93c0-1.91.89-2.86,2.67-2.86s2.67.95,2.67,2.86v1.11h-1.69v-1.22c0-.75-.31-1.12-.93-1.12s-.93.37-.93,1.12v6.15c0,.74.31,1.11.93,1.11s.93-.37.93-1.11v-1.63h1.69Z'/%3e%3cpath%20class='st0'%20d='M81.4,31.14h-1.8l-.31-2.07h-2.19l-.31,2.07h-1.64l1.82-11.39h2.62l1.82,11.39ZM75.9,19.2l1.52-1.91h1.71l1.51,1.91h-1.61l-.76-.95-.75.95h-1.61ZM77.32,27.52h1.73l-.87-5.76-.87,5.76ZM83.1,15.99l-1.76,1.91h-1.26l1.17-1.91h1.86Z'/%3e%3cpath%20class='st0'%20d='M84.86,19.75c1.78,0,2.67.94,2.67,2.82v1.48c0,1.87-.89,2.81-2.67,2.81h-.85v4.28h-1.79v-11.39h2.64ZM84.01,21.37v3.86h.85c.58,0,.87-.36.87-1.08v-1.71c0-.71-.29-1.07-.87-1.07h-.85Z'/%3e%3cpath%20class='st0'%20d='M93.51,19.75c1.78,0,2.67.94,2.67,2.82v1.48c0,1.87-.89,2.81-2.67,2.81h-.85v4.28h-1.79v-11.39h2.64ZM92.66,21.37v3.86h.85c.58,0,.87-.36.87-1.08v-1.71c0-.71-.29-1.07-.87-1.07h-.85Z'/%3e%3cpath%20class='st0'%20d='M98.8,31.14h-1.79v-11.39h1.79v4.88h2.03v-4.88h1.83v11.39h-1.83v-4.88h-2.03v4.88Z'/%3e%3cpath%20class='st0'%20d='M105.36,24.55h2.46v1.62h-2.46v3.34h3.09v1.63h-4.88v-11.39h4.88v1.63h-3.09v3.18ZM108.17,17.29l-1.76,1.91h-1.26l1.17-1.91h1.86Z'/%3e%3cpath%20class='st0'%20d='M112.2,19.75c1.78,0,2.67.94,2.67,2.82v1.48c0,1.87-.89,2.81-2.67,2.81h-.85v4.28h-1.79v-11.39h2.64ZM111.35,21.37v3.86h.85c.58,0,.87-.36.87-1.08v-1.71c0-.71-.29-1.07-.87-1.07h-.85Z'/%3e%3c/g%3e%3ccircle%20class='st1'%20cx='25'%20cy='25'%20r='20'/%3e%3cpath%20class='st0'%20d='M32.78,19.27c2.92,0,4.43,2.55,5.28,5.33l.71,2.17c.14.38-.33.75-.71.75h-5.61c.19-.33.24-.71.09-1.08l-.75-2.45c-.43-1.32-.99-2.64-1.79-3.77.75-.57,1.65-.94,2.78-.94h0ZM25,18.38c3.25,0,4.9,2.78,5.89,5.89l.76,2.45c.14.42-.33.8-.8.8h-11.69c-.42,0-.94-.38-.8-.8l.75-2.45c.99-3.11,2.64-5.89,5.89-5.89h0ZM25,11.35c1.74,0,3.11,1.37,3.11,3.11s-1.37,3.11-3.11,3.11-3.11-1.41-3.11-3.11,1.41-3.11,3.11-3.11h0ZM17.27,19.27c1.08,0,1.98.38,2.73.94-.8,1.13-1.37,2.45-1.74,3.77l-.8,2.45c-.14.38-.05.75.09,1.08h-5.56c-.42,0-.9-.38-.75-.75l.71-2.17c.9-2.78,2.41-5.33,5.33-5.33h0ZM17.27,12.91c1.51,0,2.78,1.27,2.78,2.83s-1.27,2.83-2.78,2.83-2.83-1.27-2.83-2.83,1.27-2.83,2.83-2.83h0ZM32.78,12.91c1.56,0,2.78,1.27,2.78,2.83s-1.23,2.83-2.78,2.83-2.83-1.27-2.83-2.83,1.27-2.83,2.83-2.83h0ZM27.07,28.56v.09c0,.57-.24,1.08-.61,1.46h0v.05c-.38.33-.9.57-1.46.57s-1.08-.24-1.46-.61h0c-.38-.38-.61-.9-.61-1.46v-.09h1.41v.09c0,.19.05.38.19.47v.05c.09.09.28.19.47.19s.38-.09.47-.19v-.05c.14-.09.24-.28.24-.47t-.05-.09h1.41ZM30.99,28.56v.09c0,1.65-.66,3.16-1.74,4.24-1.08,1.08-2.59,1.79-4.24,1.79s-3.16-.71-4.24-1.79l-.05-.05c-1.04-1.08-1.7-2.55-1.7-4.2v-.09h1.41v.09c0,1.27.47,2.4,1.27,3.25h.05c.85.85,1.98,1.37,3.25,1.37s2.4-.52,3.25-1.37c.85-.8,1.37-1.98,1.37-3.25v-.09h1.37ZM34.99,28.56v.09c0,2.78-1.13,5.28-2.92,7.07-1.79,1.79-4.29,2.92-7.07,2.92s-5.23-1.13-7.07-2.92c-1.79-1.79-2.92-4.29-2.92-7.07v-.09h1.41v.09c0,2.4.94,4.53,2.5,6.08,1.56,1.56,3.72,2.5,6.08,2.5s4.52-.94,6.08-2.5c1.56-1.56,2.5-3.68,2.5-6.08v-.09h1.41Z'/%3e%3c/svg%3e)