
* Corresponding author.
E-mail addresses: masitfj@unisa.ac.za (F. Nemavhola)
© 2017 Growing Science Ltd. All rights reserved.
doi: 10.5267/j.esm.2017.6.003
Engineering Solid Mechanics (2017) 155-166
Contents lists available at GrowingScience
Engineering Solid Mechanics
homepage: www.GrowingScience.com/esm
Biaxial quantification of passive porcine myocardium elastic properties by region
Fulufhelo Nemavholaa*
aDepartment of Mechanical and Industrial Engineering, School of Engineering, College of Science, Engineering and Technology, University of South
Africa, Florida, 1710, South Africa
A R T I C L EI N F O A B S T R A C T
Article history:
Received 6 March, 2017
Accepted 12 June 2017
Available online
21 June 2017
Considering accurate constitutive models is of the utmost importance when capturing the
mechanical response of soft tissue and biomedical materials under physiological loading
conditions. This paper investigated the behaviour of porcine myocardium in passive rested
hearts. This was done by applying biaxial loads on the myocardium. The main objective of this
research was to investigate the cardiac mechanics of various regions of a healthy passive rested
porcine heart. The biaxial mechanical properties of myocardial tissue samples were captured
using a biaxial testing system. The porcine heart was divided into three regions, namely, left
ventricle (LV), septum and right ventricle (RV). In these regions, 18 × 18 mm2 equal samples
were cut from six porcine passive hearts. For the LV sample, the biaxial elastic modulus in the
fibre direction was 33.3% larger than in the cross fibre direction, for the mid-wall sample it
was 18.8% larger, and for the RV sample it was 33.3% larger. It was concluded that the cardiac
mechanics of LV, septum and RV exhibit mechanical behaviour that differs considerably. In
developing adequate computational models, these data could be applied to estimate the material
parameters of the myocardium.
© 2017 Growin
g
Science Ltd. All ri
g
hts reserved.
Keywords:
Biaxial testing
Elastic modulus
Cardiac mechanics
Porcine heart
Soft tissue mechanics
1. Introduction
The relationship between the biomechanical behaviour of different regions of passive porcine hearts
is still not fully understood. In order to develop clinically acceptable computational models, there is a
need to understand fully the mechanical behaviour of passive myocardium in various regions of the
heart. As the mechanical properties of passive myocardium are largely assumed to be constant
throughout the regions, the study of cardiac mechanics in these regions remains valid and relevant for
ensuring that accurate computational models are generated. Accurate computational models with full
understanding of mechanical properties may assist in the prediction of tissue replacement suitability. It
may sometimes be vital to study the mechanics of the right ventricle (RV) to understand the underlying
mechanisms of heart disease (Buckberg and Nanda, 2015).

156
The majority of research devoted to simulating the behaviour of the heart has preferred to
concentrate on the left ventricle (LV) (Wise et al., 2016, Sirry et al., 2016). In some cases, RV
mechanics have been simulated using the LV material properties (Masithulela, 2016a, Masithulela,
2015). In reality, however, LV material properties may differ significantly from those of the RV. The
LV is divided into two main regions, namely, the free wall and the septal wall. It is argued that even
though these regions are situated in the same LV, they could exhibit different mechanical properties.
This is evident because most computational studies have assumed the same material parameters (free
wall and septum – those of the LV) to study the mechanics of the whole heart. Although this approach
has provided some acceptable computational results, there is a need to consider the mechanical
behaviour of each region in order to improve the accuracy of computational models of the heart. The
experimental mechanics of various regions of the heart, such as the septum and the RV, have clearly
not been adequately studied and remain poorly understood. Generally, materials constants obtained
from biaxial testing of the LV are applied through heart models. This is done with the assumption that,
passively, the materials constants of the other regions including the RV and the septum are similar to
those of the LV. Therefore, this study aimed to develop and generate experimental results for the LV,
septum and RV in the passive porcine heart. This was done by conducting biaxial testing of porcine
hearts in a controlled environment. The cardiac mechanics of the LV, septum and RV were then
compared to each other in order to have a full understanding of the porcine heart. These data could also
be used in generating material parameters that can be applied in various computational heart models in
the future. The finite element method is a powerful tool for modelling cardiac function (Masithulela,
2016a, Masithulela, 2015). In this study, this was done in order to increase and determine the
physiological response of the heart by understanding how the structural components of the heart may
influence its behaviour. The formulation of accurate and appropriate constitutive laws is vital in
identifying the material parameters.
The function of the heart is similar to that of a pump where pathological conditions are analogous
to mechanical issues that alter its efficiency. Myocardium exhibits large deformations under
comparatively small forces and then undergoes proportionally smaller deformations under larger
forces. This mechanical response to loading, typical of soft biological tissue in general, is dependent
on the direction of the load. Planar biaxial testing has been used for decades, resulting from the
understanding, grounded in continuum mechanics, that uniaxial testing is insufficient when one’s goal
is to characterise anisotropic materials. Planar biaxial testing makes it possible to explore a wide range
of loads, understood here as forces or displacements, applied at once in two orthogonal directions. The
loads applied in both directions may the same (equibiaxial loading), may be kept in constant proportion
between both directions (proportional loading), or may be independent from each other (general biaxial
loading). With the advent of commercially available, integrated biaxial testing equipment specially
designed for biological soft tissues, such as the Biotester (CellScale, Waterloo, Canada) used in this
study, it is timely to revisit the practice of planar biaxial testing. First, we will go over the details of the
materials experimental behaviour of different regions in the heathy porcine heart and then will describe
and discuss our findings in the contexts of the different mechanics of the LV, septum and RV. Heart
research is highly multidisciplinary in its approach. It is thus vital to identify precisely the material
properties of the myocardium of resting hearts. To fully understand the extremely nonlinear mechanics
of complex structures such as the passive myocardium under different loading conditions, a rationally
based material model must be developed. Thus, utilising new cutting-edge equipment, planar biaxial
tension tests were performed to determine the biaxial expansion properties of the inactive porcine
myocardium.
Heart-related infections are the main source of mortality across the globe, and it is estimated that
Europe alone spends about €196 billion every year on heart-related medicinal treatments (Løgstrup and
O’Kelly, 2012). To better comprehend heart-related diseases, for example ventricular fibrillation, there
is an intense requirement for more basic research to be completed on cardiovascular electrophysiology
as well as on cardiac mechanics. The mechanics of the passive myocardium are important for accurately
capturing the mechanical behaviour of the heart and for better understanding the mechanisms of the
heart and heart diseases, as well as the development and improvement of medical health care. The
F. Nemavhola / Engineering Solid Mechanics 5 (2017)
157
diastolic mechanical properties of cardiac muscles are important determinants of cardiac function with
distinct passive myocardial stiffness contributing to diastolic heart failure. Such ventricular diastolic
dysfunction in patients with heart failure is associated with significant morbidity and mortality. Hence,
the passive stiffness of the myocardium is a major determinant of the overall cardiac function. The
point of the present paper is to describe the mechanical properties of the inactive porcine myocardium
in various areas including the LV, septum and RV through biaxial testing. It is planned that the
information provided by this study will be used to determine new constitutive descriptors and their
related parameters for more precise computational modelling research of the major mechanisms of
heart mechanics. Moreover, the data presented in this study may be used as a first standard mechanical
data collection of the porcine ventricular myocardium, which could possibly be extrapolated for use in
the development and construction of cardiac tissue.
Material and methods
2.1 Tissue preparations
Eight fresh porcine hearts were obtained from the local abattoir within a few hours of slaughter and
stored in saline solution at 4 °C. The porcine tissues were harvested from adult pigs weighing about
104 kg. All the samples were dipped into 0.6% glutaradehyde for 20 minutes before testing. Initially,
the heart was divided into LV, septum and RV. The ventricles were then cut into 18 × 18 mm2 squares
in order to be tested in the biaxial tester.
2.2 Equipment and experiment protocol
The thickness of each sample was evaluated by taking three measurements at different locations
using an electronic thickness gauge. The samples were mounted on the 23N capacity biaxial testing
equipment and then immersed in a saline solution in a bath with a temperature control. The temperature
of the saline solution was set at 37 °C for 15 minutes before testing. During testing, the samples were
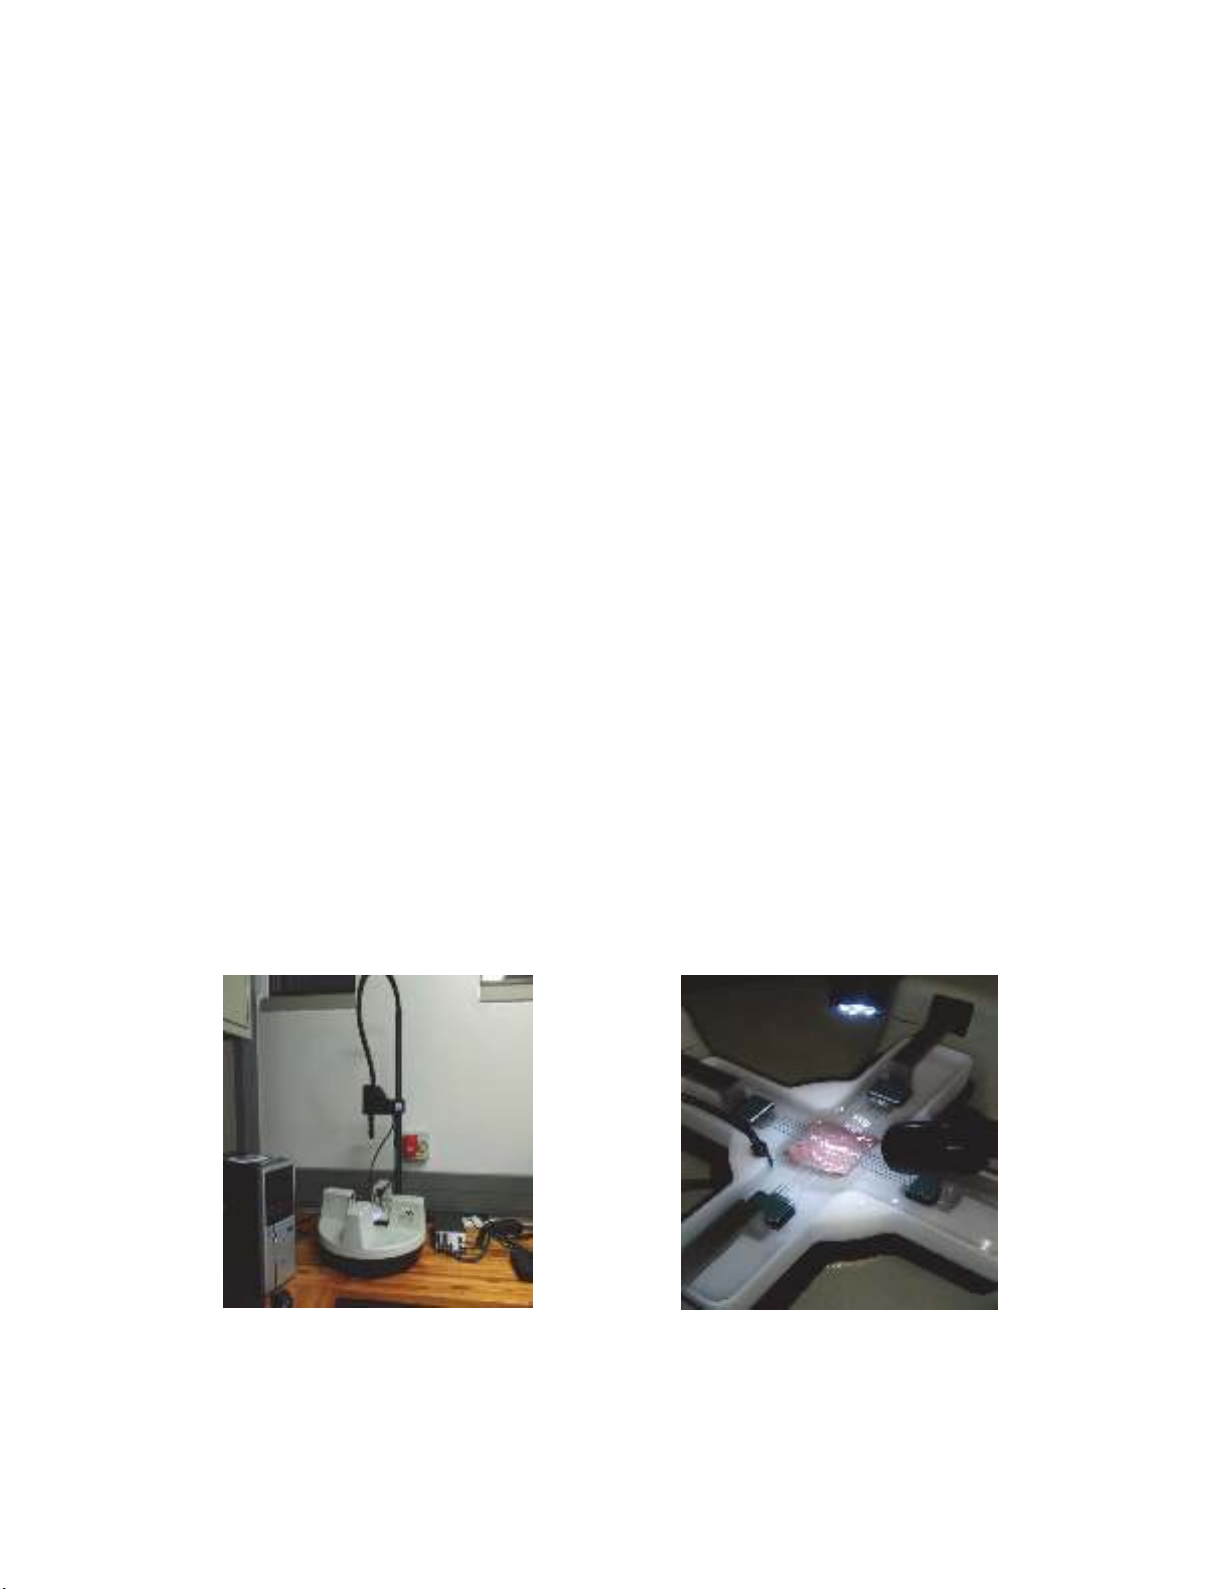
taken out of the solution to avoid reflections impairing the image tracking. The Biotester comes with
an integrated software interface, LabJoy, whose data collection module allows the user to set the
parameters for the test phases (preloading, stretching, holding, recovering and resting) of load cycles
gathered into a test sequence, as well as the saline bath temperature and image acquisition frequency
(here, 5 Hz) (see Figure 1). Biaxial testing procedures have previously been described in detail (Abbasi
& Azadani, 2015).
(a) (b)
Fig. 1. Biaxial testing equipment used for testing resting porcine myocardium
158
2.3 Biaxial tensile testing
The biaxial mechanical properties of myocardial tissue samples were captured using a biaxial
testing system (Grashow et al., 2006). The length, width and thickness of samples were measured using
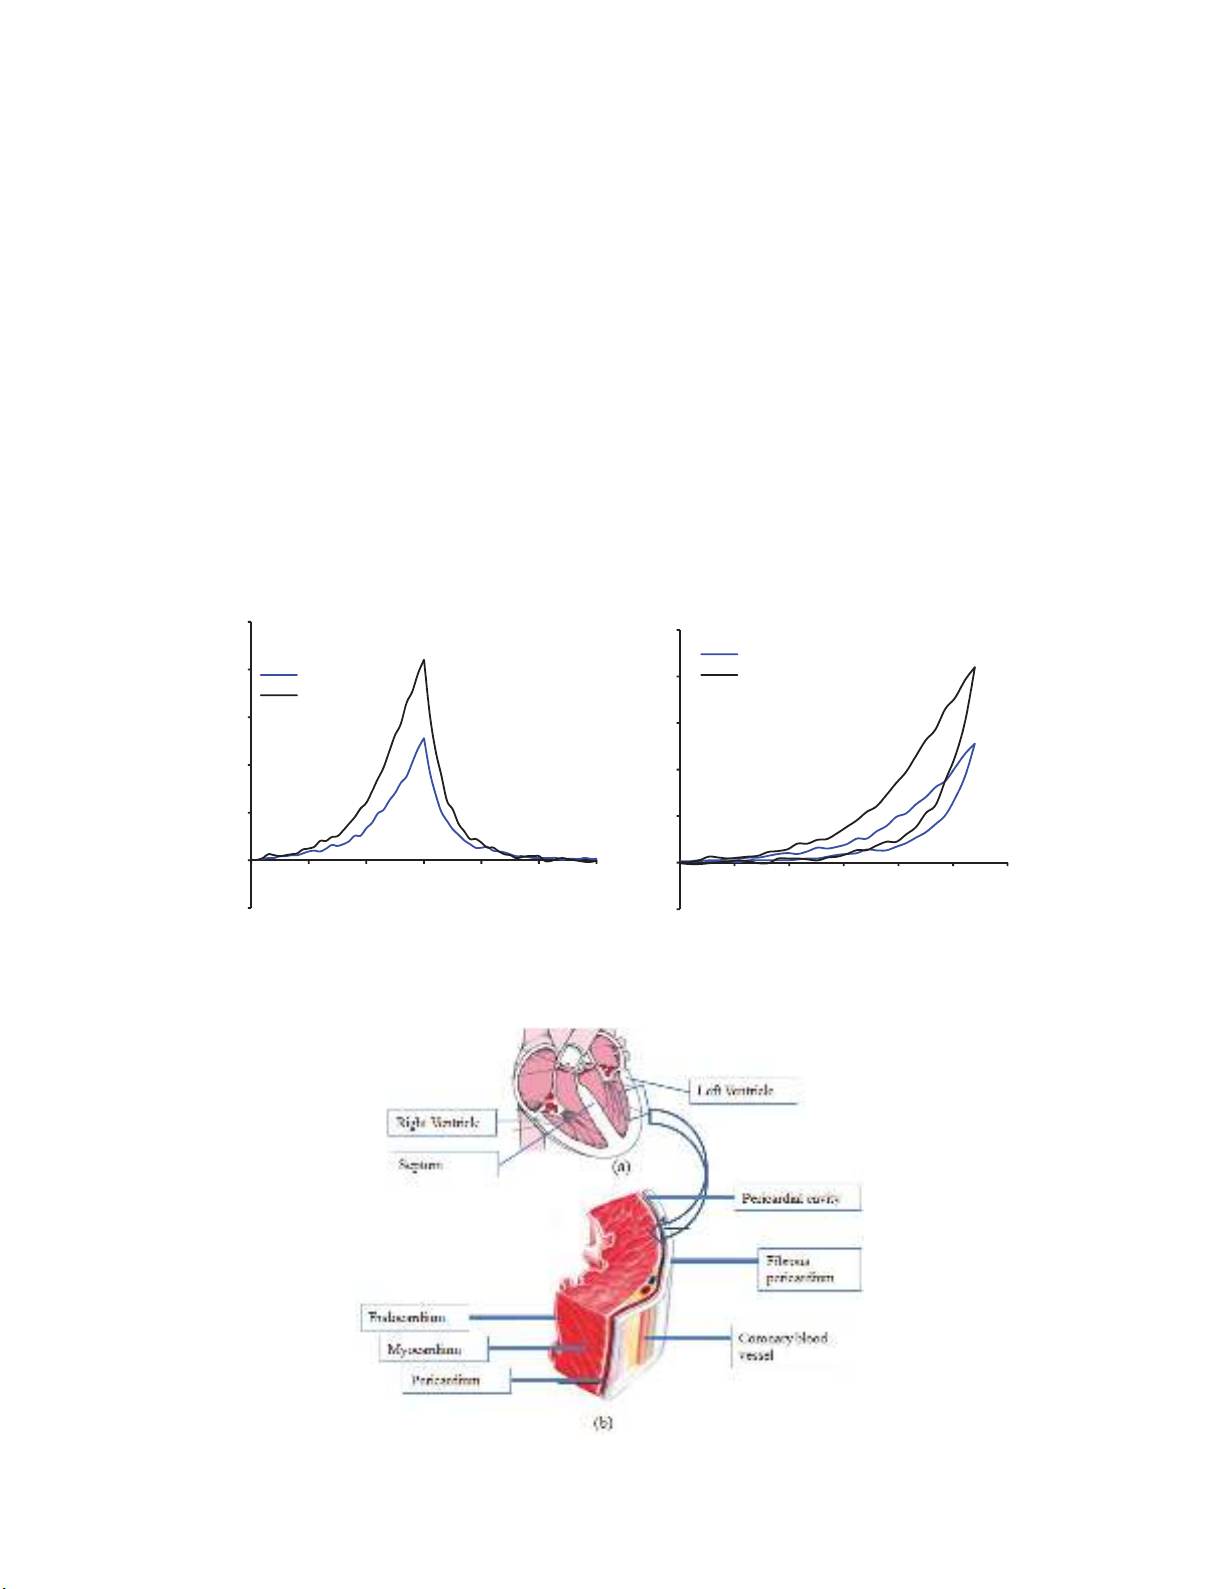
a Vernier calliper and recorded prior to testing. Force and displacement data were collected at a rate of
10 Hz in both fibre and cross-fibre directions. The force–time relationship curve was plotted to
demonstrate their relationship (see Fig. 2 (a)). The thickness of the tissue and the original length of the
sample were used to calculate the cross-sectional area. For a single sample, three thickness
measurements were made and the average was taken. All biaxial tests were performed with tissue
samples completely submerged in 37 1C PBS. Biaxial tensile load was applied along the cardiac
circumferential and longitudinal directions of the sample at 0.5 mm/s. To quantify the elastic modulus
and stiffness in the two material axes, fibre and cross-fibre were calculated from the steep region of the
equibiaxial stress–strain curve of each sample. Force displacement relationships were also plotted for
each direction (fibre and cross-fibre) (see Fig. 2 (b)). The sample was prepared by carefully cutting the
LV, RV and septal wall from the heart into 20 × 20 mm2 pieces. The fibre orientations of the
myocardium were carefully inspected to ensure that the fibre direction was properly aligned to the axis
of the equipment (see Fig. 3).
(a) (b)
Fig. 2. (a) Force-time curve of the sample LV; (b) Typical sample LV force-displacement curve and
direction of loading
Fig. 3. (a) Cross-sectional porcine heart, (b) Isolated heart LV myocardium to be tested. The same
dimension of the RV and septum have been cut and tested by biaxial Biotester machine
-500
0
500
1000
1500
2000
2500
0 102030405060
Force (mN)
Time (Seconds)
Fiber direction
Cross-fiber direction
-500
0
500
1000
1500
2000
2500
0 1000 2000 3000 4000 5000 6000
Force (mN)
Displacement (Micrometer)
Fiber direction
Cross-fiber direction
F. Nemavhola / Engineering Solid Mechanics 5 (2017)
159
2.4 Image and data processing for stress-strain plots
No significant change was observed in the pre/post measurements of specimen cross-sectional
thickness. It is well known that soft tissue or biomaterial samples may be subjected to less strain than
calculated from the grip displacements due to attachment site effects and potential tissue tearing. This
motivated the use of the image-tracking module in LabJoy to determine the actual strain distribution
within the sample. Given the large number of protocols (hence, images) to be processed, only the
loading portion of the cycles was of interest (because the loading and unloading paths were relatively
close to each other, as can be appreciated in Fig. 2)
3. Results
The mean thickness of the LV, mid-wall and RV samples was 10.4 mm, 4.2 mm and 2.2 mm,
respectively (see Table 2). After taking measurements of all the samples, it was observed that all regions
had similar thickness and were measurable. Therefore, the method used in this experiment can be
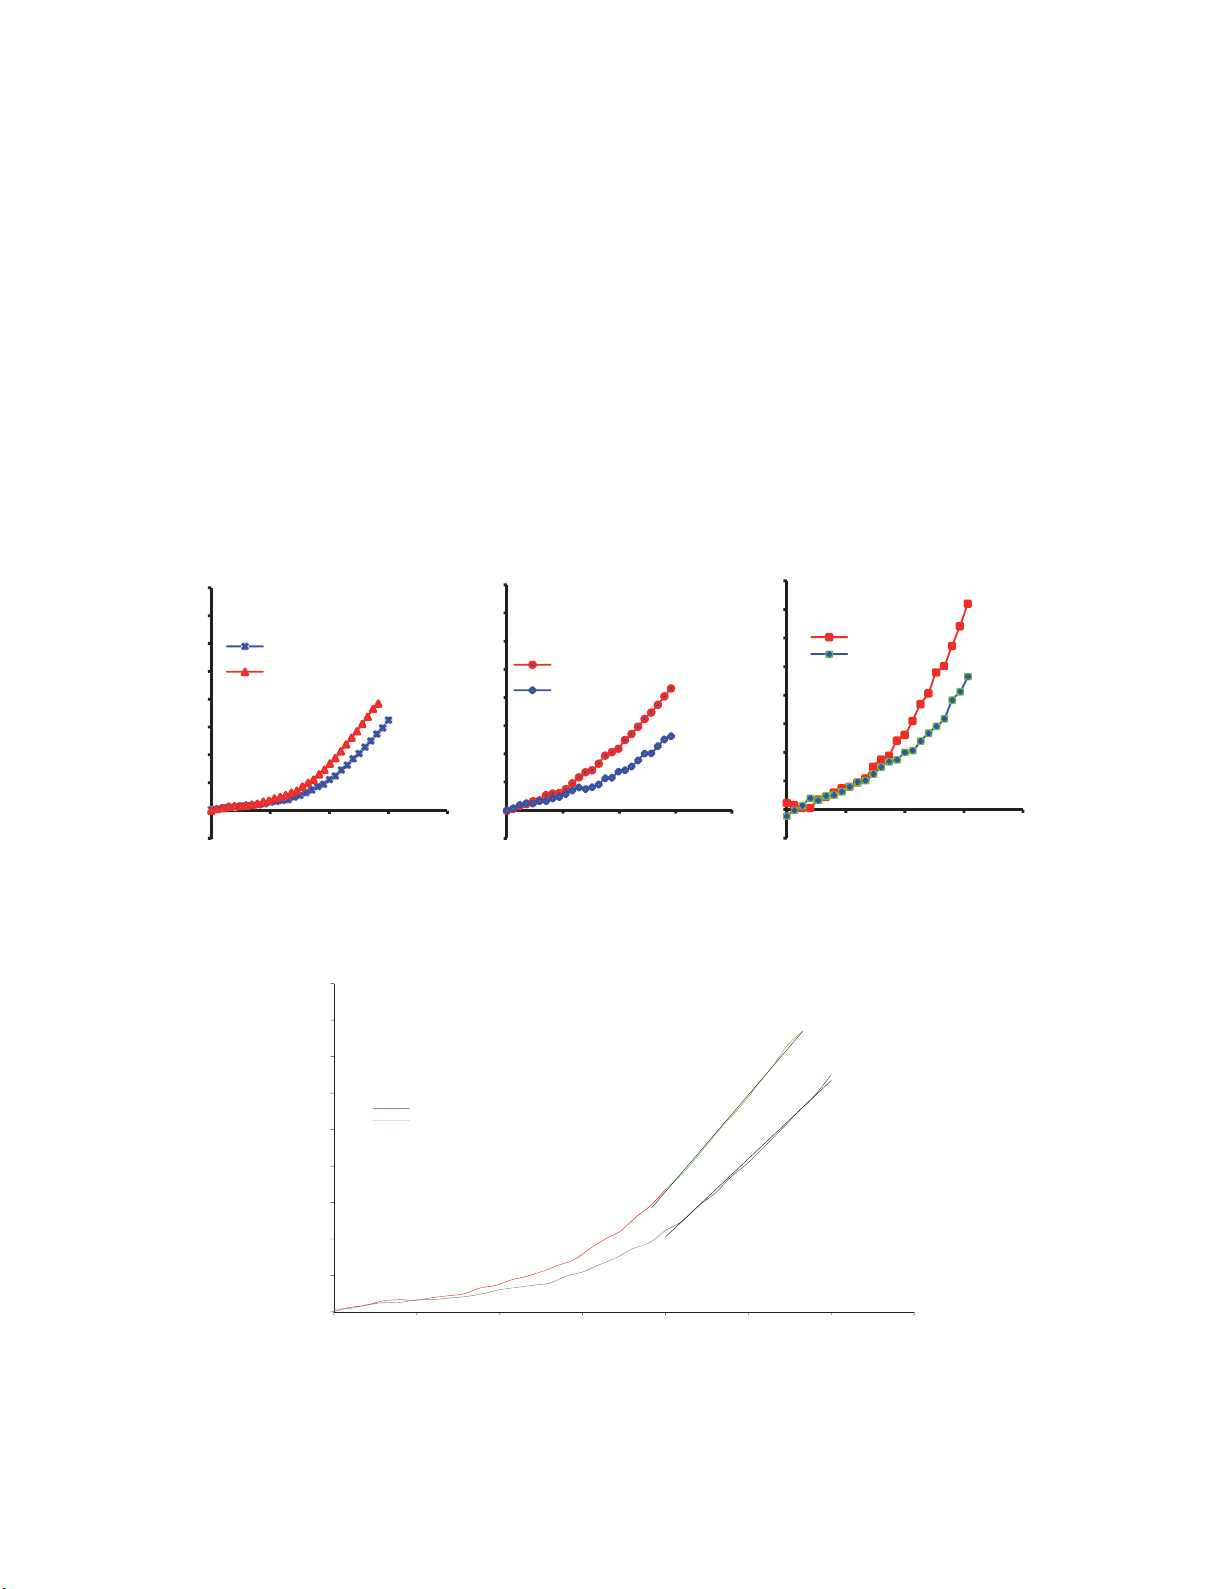
repeated elsewhere. The average stress–strain curve of the LV, mi-wall and RV in both the fibre and
cross-fibre direction is shown in Figure 4. Figure 5 shows the average stress–strain curve with selected
regions where moduli were determined.
(a) (b) (c)
Fig. 4. An average experimental stress-strain curves in (a) LV, (b) Septum and (c) RV walls in the fibre
and cross-fibre directions.
Fig. 5. Representative average stress-strain plot for the left ventricle (LV) detailing linear region with
applied linear regression, from 0.24 to 0.3 strain
-2
0
2
4
6
8
10
12
14
16
0.00 0.10 0.20 0.30 0.40
Stress (kPa)
Strain
LV Cross-
Fiber
LV Fiber
-2
0
2
4
6
8
10
12
14
16
0.00 0.10 0.20 0.30 0.40
Stress (kPa)
Strain
Mid-Wall Fiber
Mid-Wall Cross Fiber
-2
0
2
4
6
8
10
12
14
16
0.00 0.10 0.20 0.30 0.40
Stress (kPa)
Strain
RV Fiber
RV Cross-Fiber
y = 42.874x - 6.5164
R² = 0.9957
y = 53.109x - 7.3238
R² = 0.9986
0
1
2
3
4
5
6
7
8
9
0.00 0.05 0.10 0.15 0.20 0.25 0.30 0.35
Stress (kPa)
Strain
LV Cross-Fiber
LV Fiber


![Giáo trình Vật liệu cơ khí [mới nhất]](https://cdn.tailieu.vn/images/document/thumbnail/2025/20250909/oursky06/135x160/39741768921429.jpg)


