ISSN 1859-1531 - THE UNIVERSITY OF DANANG - JOURNAL OF SCIENCE AND TECHNOLOGY, VOL. 22, NO. 11B, 2024 39
DATABASE ASSESSMENT OF LATERAL STRENGTH OF UNREINFORCED
MASONRY WALLS ACCORDING TO EXISTING DESIGN PROVISIONS
Dinh Ngoc Hieu1,2*, Le Khanh Toan1, Pham My1, Dang Cong Thuat1
1The University of Danang - University of Science and Technology, Vietnam
2School of Architecture, Soongsil University, South Korea
*Corresponding author: dnhieu@dut.udn.vn
(Received: September 11, 2024; Revised: October 08, 2024; Accepted: October 15, 2024)
DOI: 10.31130/ud-jst.2024.518E
Abstract - Unreinforced masonry (URM) walls, widely used in
low-rise and heritage buildings, are highly vulnerable to seismic
events. Current evaluation guidelines for assessing the lateral
strength of URM walls predominantly rely on empirical or semi-
empirical methods derived from calibrated datasets.
Consequently, a comparative analysis of the reliability of these
existing provisions is essential. In this study, a comprehensive
database of 146 URM walls was compiled from 26 research
groups and employed to evaluate the accuracy of established
guidelines, including ASCE 41-17, NZSEE, Eurocode 6, and
GB50003. The comparative analysis showed that ASCE 41-17
provided the most accurate predictions with acceptable safety
levels, while NZSEE produced more conservative estimates and
excelled in predicting diagonal shear failure modes. Eurocode 6
showed less conservative results under high compressive stress,
compared to ASCE 41-17 and NZSEE. The GB50003 model
based on Mohr-Coulomb theory showed the lowest accuracy and
highest variability in shear strength predictions.
Key words - Unreinforced masonry wall; In-plane lateral load-
carrying capacity; Analytical model; Diagonal shear; Earthquake
1. Introduction
Unreinforced masonry (URM) walls have found
widespread use globally, both in low-rise modern
constructions and historical heritage buildings, owing to
their cost-effectiveness, ease of assembly, and architectural
aesthetics. Masonry, as a typical composite construction
material, is primarily engineered to carry compression
loads. However, its performance in resisting tensile and
shear forces is notably deficient. Consequently, numerous
studies and seismic events have exposed the inherent
vulnerability of such structures to earthquakes.
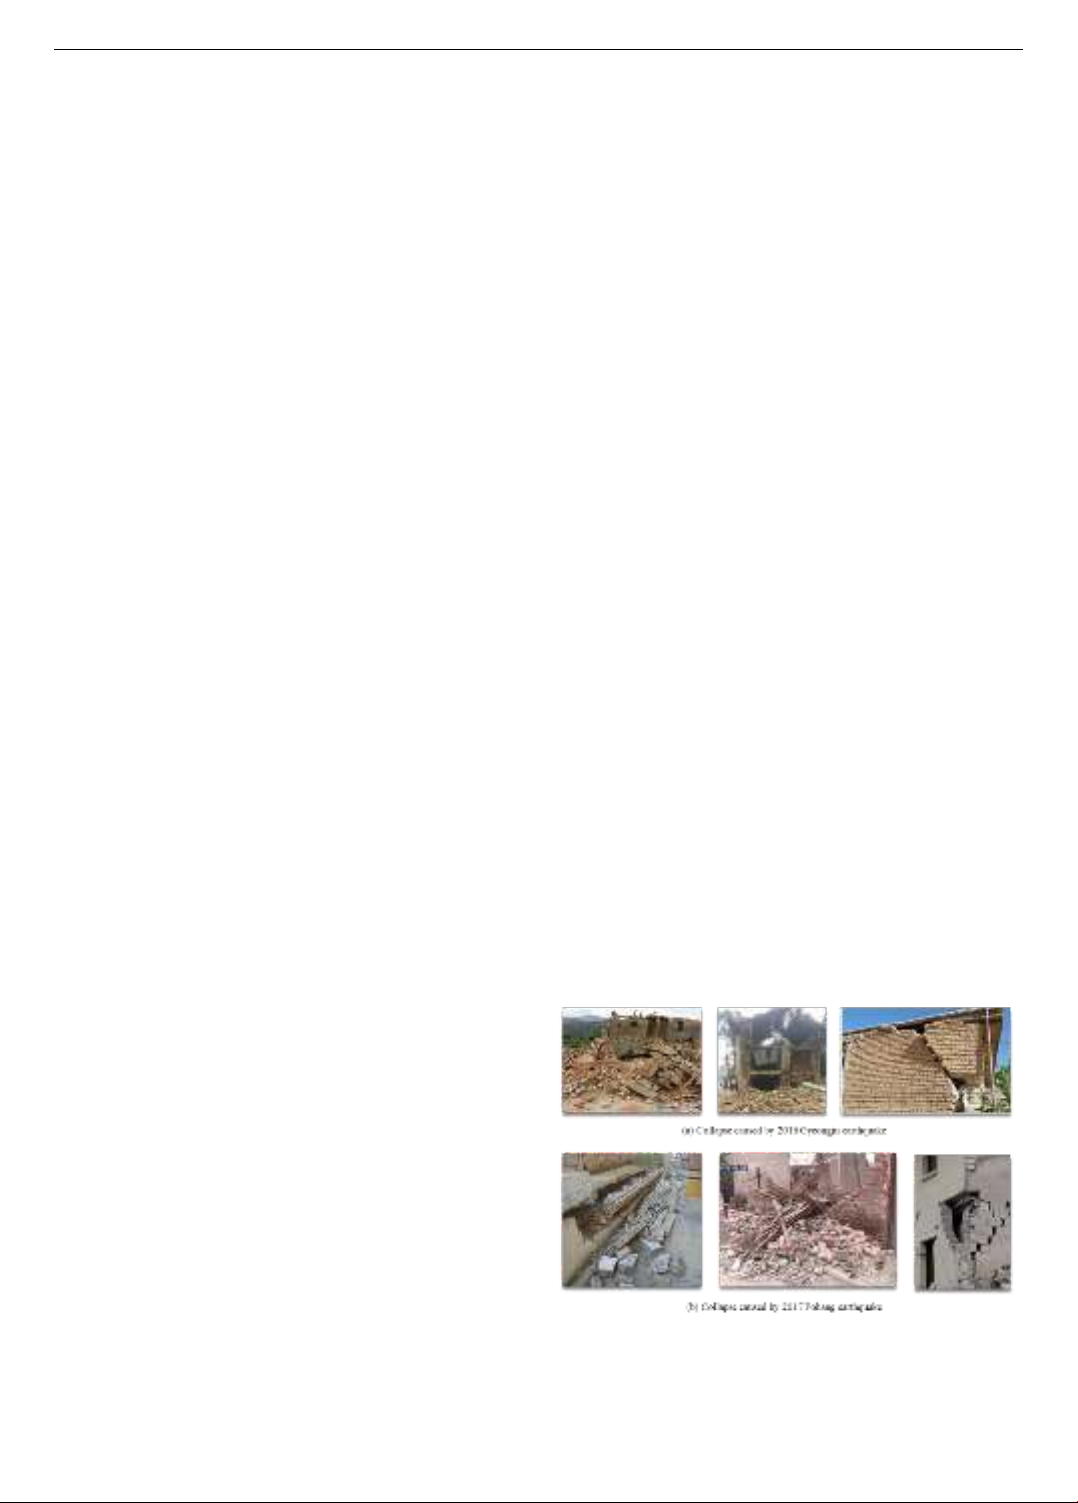
For instance, during the 1994 Northridge earthquake in
California, a considerable number of low-rise buildings
featuring unreinforced masonry walls suffered extensive
damage, including instances of collapse [1,2]. Similar
observations were recorded in the aftermath of devastating
earthquakes in L'Aquila, Italy, in 2009 [3], as well as in
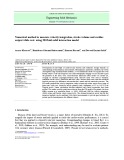
Christchurch, New Zealand, in 2010 and 2011 [4]. More
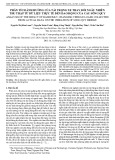
recently, earthquakes with a magnitude of 5.4 Richter
occurred in Gyeongju on September 12, 2016, and in Pohang
on November 15, 2017, South Korea, resulting in severe
damage to many low-rise residential buildings characterized
by URM walls constructed before the 1980s, as depicted in
Figure 1. These seismic events highlighted the susceptibility
of masonry walls to shear failure, leading to significant
structural damage and posing a threat to life safety.
From a structural perspective, masonry represents a
non-homogeneous and orthotropic composite material,
posing significant challenges in accurately predicting the
mechanical properties of specific masonry units. This
complexity arises due to variations in the characteristics of
its constituent elements, such as the type of bricks used, the
strength of mortar joints, and the quality of construction.
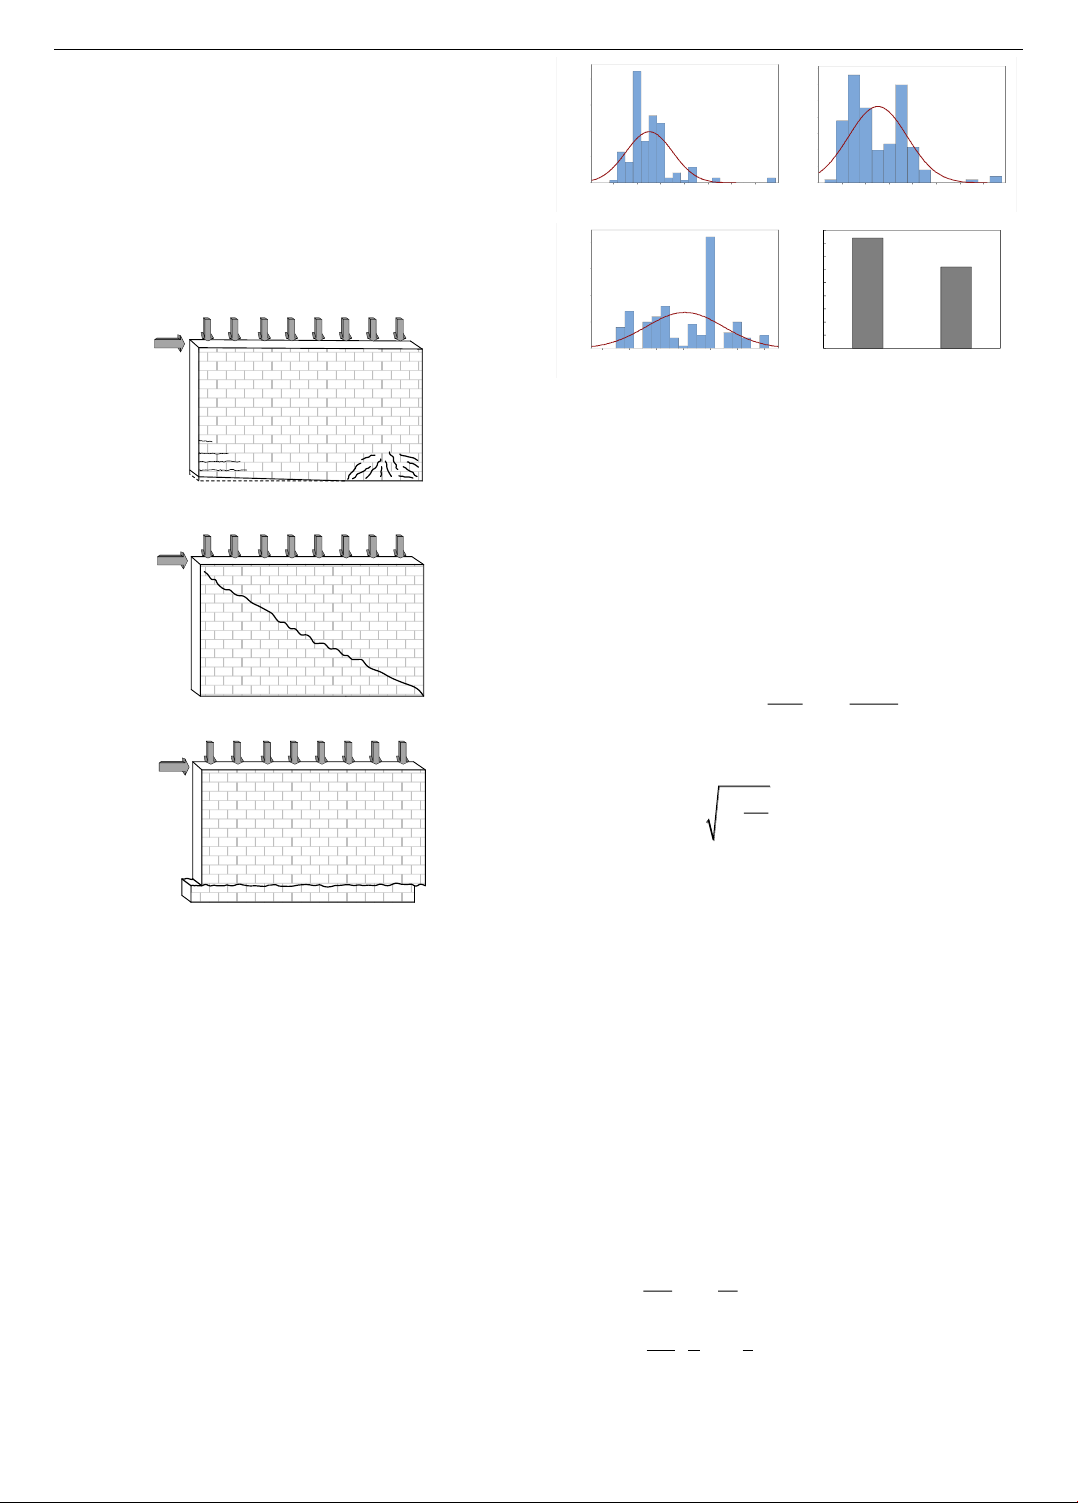
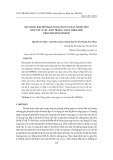
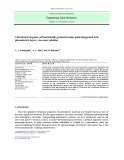
Consequently, the behavior of masonry walls under
different loading conditions is quite complicated. Figure 2
categorizes three typical in-plane failure modes of URM
walls subjected to a combined action of vertical and
horizontal loads: (a) rocking or toe crushing failure; (b)
diagonal shear failure; and (c) sliding shear failure.
Rocking or toe crushing failure (Figure 2a) is characterized
by the formation of flexural cracks at the base corners
along the bed joints, leading to the initial rotational
movement of the masonry piers around the compressed toe.
Toe crushing failure can be considered the upper limit of
the rocking mode, occurring when the compressive stress
in the compressed toe exceeds the masonry compressive
strength. Diagonal shear failure (Figure 2b) is governed by
the development of diagonal cracks that either follow the
bed- and head-joints or traverse through the brick units.
Finally, sliding shear failure (Figure 2c) occurs when the
vertical stress is relatively low, and the quality of the
mortar joints is poor, posing the sliding of a portion of the
wall along the bed-joints under the action of lateral force.
Usually, sliding failure of URM walls is rarely observed in
the URM buildings [5].
Figure 1. URM walls collapsed during earthquakes occurred in
South Korea
In the assessment of seismic performance of masonry
structures, it is crucial to evaluate the in-plane lateral load-
carrying capacity of URM walls. In current international
40 Dinh Ngoc Hieu, Le Khanh Toan, Pham My, Dang Cong Thuat
seismic evaluation guidelines such as ASCE 41-17 [6],
NZSEE [7], Eurocode 6 [8], and GB50003 [9], different
empirical formulations are specified for predicting the
lateral load-carrying capacity of URM walls. ASCE 41-17
and NZSEE adopted the same approach by considering
different possible failure mechanisms of URM walls
subjected to in-plane lateral load, while the GB5003
prediction model is based on the Mohr-Coulomb theory.
Such simplified prediction equations have primarily been
established through the calibration of existing test data and
simplified analytical investigations.
Figure 2. Typical failure modes of URM walls
Consequently, a comparative analysis of the reliability
of these existing provisions is essential. In the present
study, an evaluation of existing design codes and
guidelines was conducted based on a large dataset from
prior tests conducted on URM walls. In addition, the
effects of the main influencing parameters were analyzed
and discussed in detail.
2. Database evaluation and design models
2.1. Database of URM walls
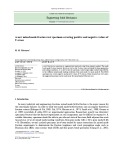
The database of URM walls encompasses 146 wall
specimens [10, 11]. Figure 3 presents the distribution of the
specimen number according to different test parameters.
The data covers a wide range of URM wall characteristics,
encompassing applied compressive stress (σ0) ranging
from 0.086 to 4.0 (MPa), aspect ratios ranging from 0.21
to 2.9, wall thickness (tw) varying from 102 to 410 (mm),
and different test boundary conditions including cantilever
and double fixed-end configurations.
Figure 3. Distribution of the URM walls according to test
parameters in the database
2.2. Existing design and evaluation guidelines
A comparative analysis was conducted using existing
evaluation guidelines, including ASCE 41-17 [6],
GB50003 [9], NZSEE [7], and Eurocode 6 [8]. The details
of design equations are summarized hereafter.
▪ ASCE 41-17 [6]:
Vm = min (Ver, Vtc, Vsl, Vdt) (1)
0.9( 0.5 ) /
r d w w eff
V P P L H
=+
(2)
0
'
( 0.5 ) 1 0.7
w
tc d w
eff m
L
V P P Hf
= + −
(3)
sl me g
VA
=
(4)
'0
'
1
dt dt g
dt
V f A f
=+
(5)
where, Pd and Pw are the dead load and self-weight of the
wall, respectively; α is the boundary condition factor
(α = 0.5 for cantilever walls and α = 1.0 for both-end fixed
walls); and β is a factor accounting for the non-uniform
distribution of shear stress along the wall height:
0.67
=
for
/ 0.67
w eff
LH
,
/
w eff
LH
=
for
0.67 / 1.0
w eff
LH
,and β=1.0 for
/ 1.0
w eff
LH
▪ GB50003-2011 [9]:
( )
00m n v g
V f A
=+
(6)
where, αn represents the coefficient considering the non-
uniform distribution of shear stress across the cross-
section; fv0 is the shear strength under zero compression
stress; and μ is the friction coefficient.
▪ NZSEE [7]:
Vm = min (Vr, Vtc, Vs, Vdt) (7)
3
b er
ri
w
Nl
Va
H
=−
(8)
11
23
b
tc w etc
w
N
V L l
H
=−
(9)
0.8
s w w f t
V L t c N
=+
(10)
(a) Rocking / Toe crushing
(b) Diagonal shear
(c) Shear sliding
0
10
20
30
40
50
60
70
80
90
Cantilever Fixed-end
Frequency
Boundary condition
(d) According to test boundary condition
3.63.02.41.81.20.60.0
40
30
20
10
0
σ0
Frequency
2.82.42.01.61.20.80.4
35
30
25
20
15
10
5
0
σ0
Frequency
42036030024018012060
40
30
20
10
0
σ0
Frequency
σ0 (MPa) Aspect ratio (Heff/L)
Wall thickness (mm)
(a) According to compressive stress (b) According to aspect ratio
(c) According to wall thickness
ISSN 1859-1531 - THE UNIVERSITY OF DANANG - JOURNAL OF SCIENCE AND TECHNOLOGY, VOL. 22, NO. 11B, 2024 41
0
0.54 1
dt w w dt
dt
V L t f f
=+
(11)
where, Nb is the normal force acting on the cross-section of
the wall base; ai [=0.5Lw] is the distance from the
compression edge of the wall to the center of gravity; ler
and letc are the effective lengths of the wall in rocking and
toe crushing failure modes, respectively; c is the bed joint
cohesion; μf is the coefficient of friction of the bed joint;
and fdt is the diagonal tension strength of the masonry unit.
▪ Eurocode 6 [8]:
vk
m w c
m
f
V t l
=
(12)
32
w
c
L
le
=−
(13)
eff
d
V
eH
P
=
(14)
where fvk is the characteristics shear strength at a specified
compression level σ0; γm is the partial safety factor, lc is the
length of the effective uncracked section; e is the eccentricity
of the vertical load (Pd) corresponding to horizontal load (V);
and Heff [=αHw] is the effective height of the wall,
determined by the boundary conditions of the wall (α=1.0
for cantilever walls and 0.5 for both-end fixed walls).
3. Results of comparative analysis and discussion
In the evaluation process, the input parameters required
for evaluation equations in section 2.2 such as geometry
properties and material properties of URM walls were
directly derived from the previous publications in the
database. The completed details can be found in a study by
Dinh et al. [11].
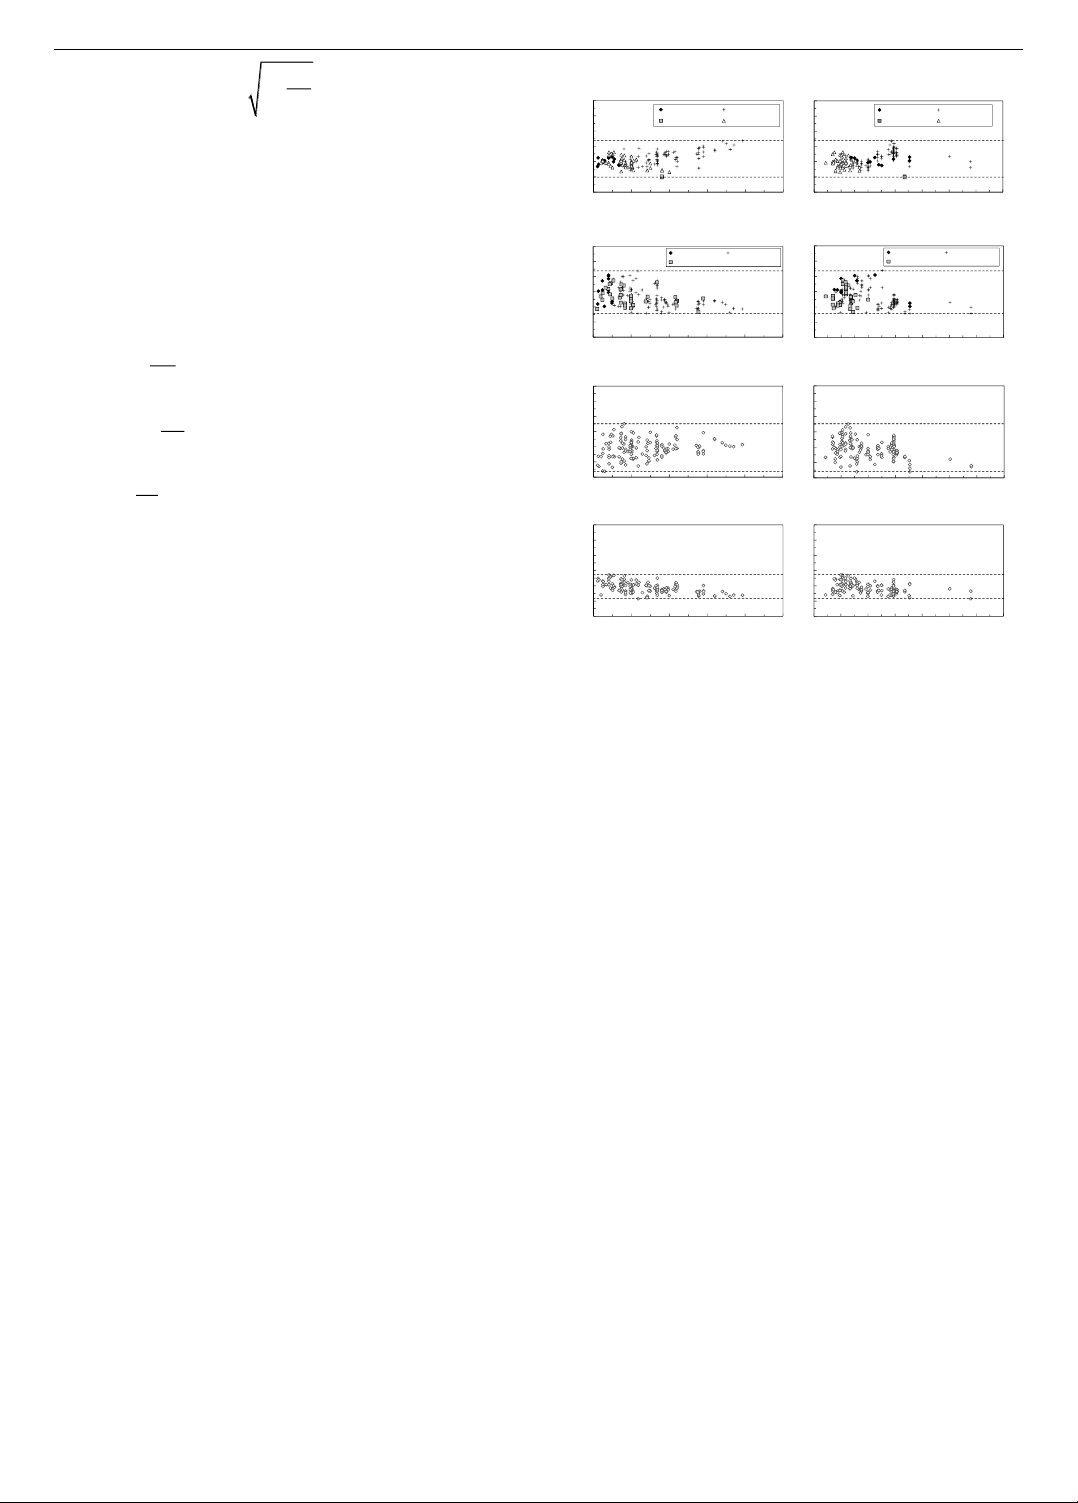
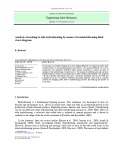
Figure 4 illustrates the lateral strength ratio
(Vtest/Vpredict) between the experimental results and
predicted values, according to the variation of applied
compressive stress acting on unreinforced masonry (URM)
walls normalized by the wall compressive strength (σ0/f’m),
and the wall aspect ratio (Heff/L). The figure provides the
minimum, maximum, and average values, as well as the
coefficient of variation (COV) of the shear strength ratio.
Additionally, the 5% fractile (P0.05), commonly accepted as
a nominal resistance value in the theory of limit states [12],
was calculated to assess the safety of the design, assuming
a normal distribution of the shear strength ratio. A 5%
fractile value lower than 1.0 indicates an unsafe design.
Figure 4(a) shows that the ASCE 41-17 model achieves
an average Vtest/Vpredict ratio of 1.16, which closely aligns
with the test results. The shear strength ratios exhibit a
coefficient of variation (COV) of 0.21, and the 5% fractile
value is 0.69. For cases where σ0/f’m > 0.15, the model's
prediction of toe-crushing failure aligns with the
compression failure mode of the test results. However, for
σ0/f’m < 0.15, the ASCE model predominantly predicts
shear sliding failure, which deviates from the test results.
When the aspect ratio exceeds 1.0, the ASCE model
predictions align well with the test results, with rocking and
toe crushing as dominant failure modes.
Figure 4. Results of comparative analysis using existing design
guidelines
In Figure 4b, the NZSEE model is shown to be more
conservative than the other models, with a mean strength
ratio of 1.30, a COV of 0.25, and a 5% fractile value of
0.77. For walls with aspect ratios greater than 1.0, the
NZSEE model predicts failure modes dominated by
rocking and toe crushing, while diagonal shear failure
dominates for aspect ratios below 1.0.
As depicted in Figure 4c, the GB50003-2011 model
shows lower prediction accuracy compared to the previous
models. Its shear strength ratio ranges from 0.19 to 1.76,
with a COV of 0.32 and a notably low 5% fractile value of
0.49. The GB50003-2011 model tends to overestimate the
lateral capacity of the walls when the compressive stress
ratio is less than 0.5 and the aspect ratio is greater than 1.5.
These discrepancies are attributed to the model's reliance on
the friction failure theory, without differentiating between
failure modes for unreinforced masonry (URM) walls.
In Figure 4d, the Eurocode 6 predictions show less
scatter, with a COV of 0.18, but they are less conservative
compared to the ASCE 41-17 and NZSEE models,
particularly under high compressive stress ratios, with a
5% fractile value of 0.65 and a mean strength ratio of 0.93.
4. Parametric analysis and discussion
Figure 5 presents the results of a parametric analysis
using existing design guidelines to assess the influence of
key parameters on the lateral strength of unreinforced
masonry (URM) walls. In Figure 5a, the effect of
geometric properties is examined by varying the aspect
ratio (Hw/Lw) of URM walls from 0.5 to 3.0, while keeping
other parameters constant, similar to the specimens tested
0.0
0.5
1.0
1.5
2.0
2.5
3.0
0.0 0.1 0.2 0.3 0.4 0.5
Vtest/Vpredict
σ0/ f'm
0.0
0.5
1.0
1.5
2.0
2.5
3.0
0.0 0.1 0.2 0.3 0.4 0.5
Vtest/Vpredict
σ0/ f'm
Rocking Toe crushing
Diagonal shear
0.0
0.5
1.0
1.5
2.0
2.5
3.0
0.0 0.1 0.2 0.3 0.4 0.5
σ f
Rocking Toe crushing
Diagonal shear Shear sliding
(a) ASCE 41-17
(c) GB50003-2011
Mean: 1.07
COV: 0.21
P0.05: 0.69
Mean: 0.95
COV: 0.32
P0.05: 0.45
Max: 1.68
Min: 0.48
0.0
0.5
1.0
1.5
2.0
2.5
3.0
0.0 0.5 1.0 1.5 2.0 2.5 3.0 3.5
Heff/L
Rocking Toe crushing
Diagonal shear Shear sliding
0.0
0.5
1.0
1.5
2.0
2.5
3.0
0.0 0.5 1.0 1.5 2.0 2.5 3.0 3.5
Heff/L
0.0
0.5
1.0
1.5
2.0
2.5
3.0
0.0 0.5 1.0 1.5 2.0 2.5 3.0 3.5
Heff/L
Rocking Toe crushing
Diagonal shear
(b) NZSEE
Max: 2.19
Min: 0.78
0.0
0.5
1.0
1.5
2.0
2.5
3.0
0.0 0.1 0.2 0.3 0.4 0.5
Vtest/Vpredict
σ0/ f'm
0.0
0.5
1.0
1.5
2.0
2.5
3.0
0.0 0.5 1.0 1.5 2.0 2.5 3.0 3.5
Heff/L
Max: 1.35
Min: 0.57
Mean: 0.93
COV: 0.18
P0.05: 0.65
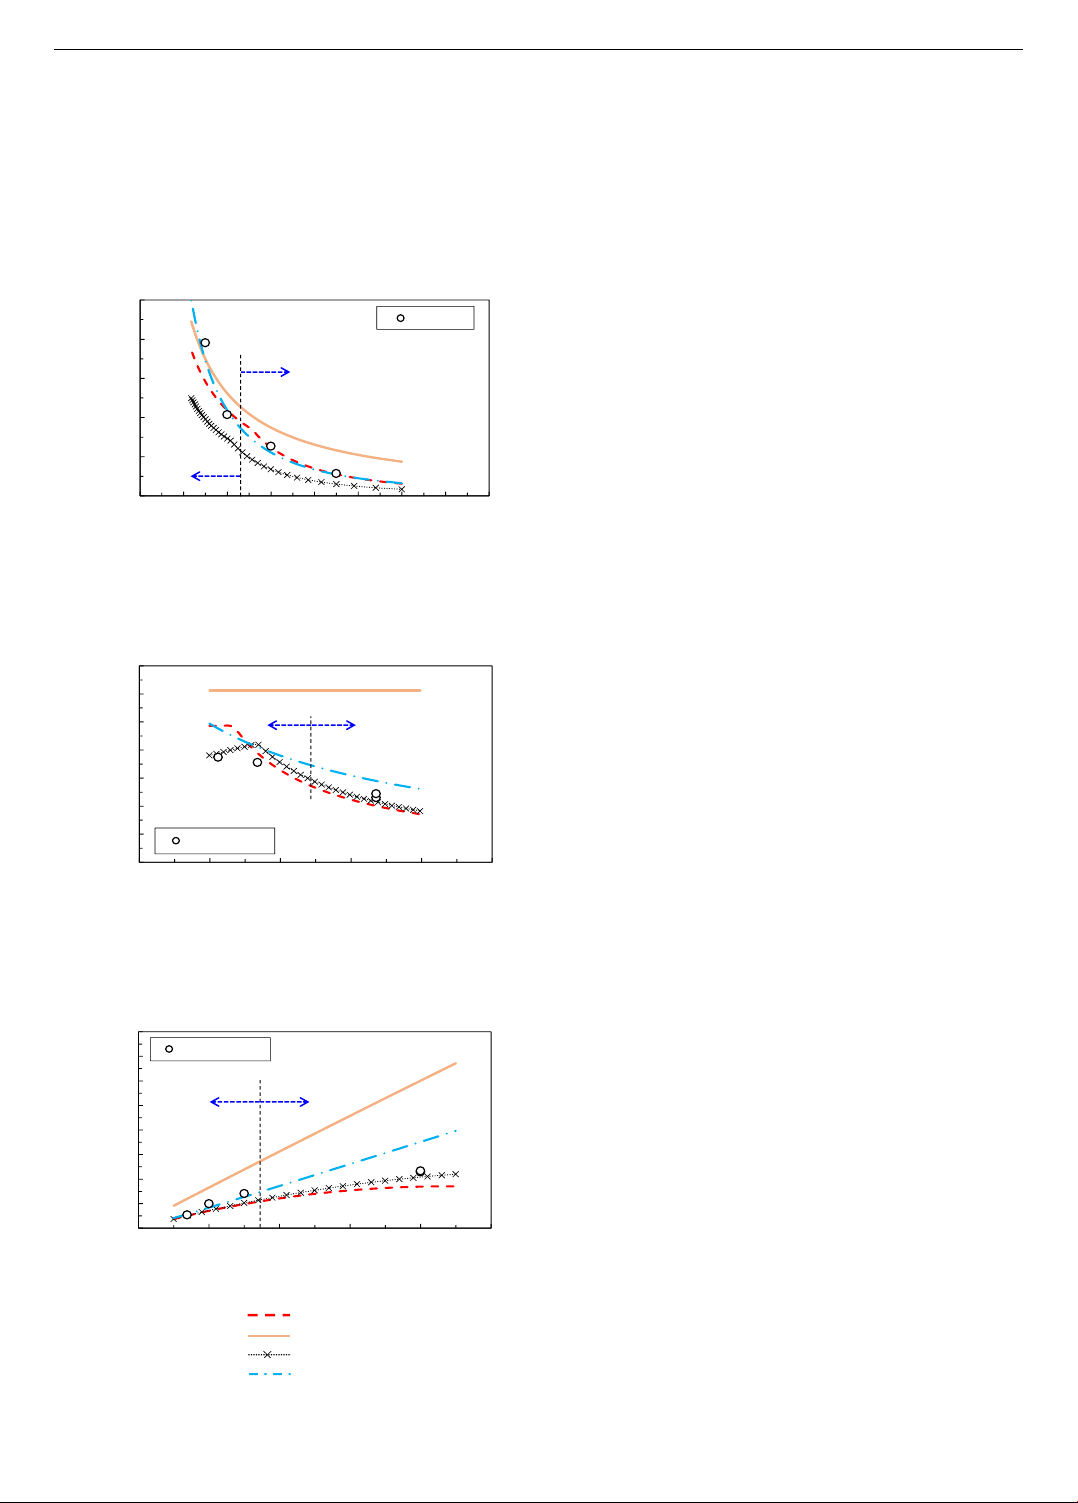
42 Dinh Ngoc Hieu, Le Khanh Toan, Pham My, Dang Cong Thuat
by Lee et al. [13]. Figure 5b investigates the influence of
the shear ratio, also varying from 0.5 to 2.0, with other
parameters held constant as in the tests conducted by Petry
and Beyer [14]. In Figure 5c, the primary variable is the
compressive stress acting on the URM walls, ranging from
0.5 to 4.5 MPa, while other factors remain constant,
following the parameters studied by Bosiljkov et al. [15].
Figure 5. Parametric analysis
Figure 5(c) illustrates that as the compressive stress
acting on URM walls increases, the predicted lateral
strength also rises, aligning with the experimental findings
by Bosiljkov et al. [15]. The GB50003 model tends to
overestimate the lateral strength of URM walls, displaying
a linear increase in strength as the applied compressive
stress rises. This overestimation is attributed to the model's
reliance on the Mohr-Coulomb theory, which primarily
addresses friction failure and overlooks the complex failure
mechanisms specific to URM walls. In contrast, the
predictions made by the ASCE and NZSEE models are
generally consistent and conservative when compared to
the experimental results. However, the Eurocode tends to
overestimate the lateral strength of URM walls,
particularly under high compressive stress conditions,
suggesting a limitation in accurately capturing the
performance of URM walls under such loading scenarios.
5. Conclusion
In this study, a comparative analysis was conducted to
assess the reliability of current design provisions for
predicting the in-plane lateral load-carrying capacity of
unreinforced masonry (URM) walls. The main findings
from this analysis are as follows:
1. The ASCE 41-17 model provided an average
Vtest/Vpredict ratio of 1.16, which closely aligns with the test
results. For low compressive stress ratio σ0/f’m < 0.15, the
ASCE model predominantly predicts shear sliding failure,
which deviates from the test results. When the aspect ratio
exceeds 1.0, the ASCE model predictions align well with
the test results, with rocking and toe crushing as dominant
failure modes.
2. The NZSEE model provided more conservative
results than the other models, with a mean strength ratio of
1.30, a COV of 0.25, and a 5% fractile value of 0.77. For
walls with aspect ratios greater than 1.0, the NZSEE model
predicts failure modes dominated by rocking and toe
crushing, while diagonal shear failure dominates for aspect
ratios below 1.0.
3. The GB50003-2011 model shows lower prediction
accuracy compared to the previous models. Its shear
strength ratio ranges from 0.19 to 1.76, with a COV of 0.32
and a notably low 5% fractile value of 0.49. This model
tends to overestimate the lateral capacity of the walls when
the compressive stress ratio is less than 0.5 and the aspect
ratio is greater than 1.5.
4. Predictions from Eurocode 6 showed less scatter,
with a COV of 0.18, but were less conservative than the
ASCE 41-17 and NZSEE models, particularly under high
compressive stress ratios. The 5% fractile value was 0.65,
and the mean strength ratio was 0.93.
5. The parametric analysis showed that the ASCE 41-
17 and NZSEE models consistently provided conservative
predictions compared to the test results in most cases. In
contrast, the Eurocode model tended to overestimate the
strength of URM walls under high compressive stress. The
GB50003-2011 model consistently overestimated the
lateral capacity of URM walls in most scenarios.
0
50
100
150
200
250
300
350
400
0 1 2 3 4 5
σ
Bosiljkov et al.
0
50
100
150
200
250
300
350
0 0.5 1 1.5 2 2.5
H ff
Petry & Beyer
0
50
100
150
200
250
0 0.5 1 1.5 2 2.5 3 3.5 4
H
Lee et al.
H
f’
σ
H
f’
σ
H ff
f’
σ

ISSN 1859-1531 - THE UNIVERSITY OF DANANG - JOURNAL OF SCIENCE AND TECHNOLOGY, VOL. 22, NO. 11B, 2024 43
REFERENCES
[1] J. B. Mander, M. J. Priestley, and R. Park, "Theoretical stress-strain
model for confined concrete", Journal of structural engineering, vol.
114, no. 8, pp. 1804-1826, 1988.
[2] G. Magenes and G. M. Calvi, "I ‐
masonry walls", Earthquake engineering & structural dynamics,
vol. 26, no. 11, pp. 1091-1112, 1997.
[3] A. Bosi, F. Marazzi, A. Pinto, and G. Tsionis, ’ q I y
earthquake of 6 April 2009: report and analysis from a field mission.
EUR—Scientific and Technical Research Reports, 2011.
[4] L. M. Moon, M. C. Griffith, D. Dizhur, J. M. Ingham, "Performance
of unreinforced masonry structures in the 2010/2011 Canterbury
earthquake sequence", in Proceedings of the 15th World Conference
on Earthquake Engineering (15WCEE), Lisbon, Portugal, 2012, pp.
24-28.
[5] M. ž č "Shear resistance of masonry walls and Eurocode 6:
shear versus tensile strength of masonry", Materials and structures,
no. 42, pp. 889-907, 2009.
[6] Seismic Evaluation and Retrofit of Existing Buildings, ASCE 41-17,
American Society of Civil Engineers, 2017.
[7] Assessment and improvement of unreinforced masonry buildings for
earthquake resistance, NZSEE 2011, New Zealand Society for
Earthquake Engineering, Wellington, New Zealand, 2011.
[8] Design of masonry structures - Part 1-1: General rules for
reinforced and unreinforced masonry structures, Eurocode 6 (EC 6),
2005.
[9] Code for design of masonry structures, GB50003-2011, 2011 (in
Chinese)
[10] P. Morandi, L. Albanesi, F. Graziotti, T. L. Piani, A. Penna, G.
Magenes, "Development of a dataset on the in-plane experimental
response of URM piers with bricks and blocks", Construction and
Building Materials, vol. 190, pp. 593-611, 2018.
[11] N. H. Dinh, S. H. Park, S. H. Kim, K. K. Choi, and Y. J. Kim,
"Analytical Model for the In-Plane Lateral Capacity of Unreinforced
Masonry Walls Based on Effective Compression Zone Failure
Mechanism", Journal of Earthquake Engineering, vol. 28, no. 16,
pp. 4721–4748, 2024.
[12] Basis of Structural Design, EN 1990: Eurocode, European
Commission, Brussels, Belgium, 2012.
[13] J. H. Lee, C. Li, S. H. Oh, W. J. Yang, and W. H. Yi, "Evaluation of
rocking and toe crushing failure of unreinforced masonry walls",
Advances in Structural Engineering, vol. 11, no. 5, pp. 475-489,
2008.
[14] S. Petry and K. Beyer, "Cyclic test data of six unreinforced masonry
walls with different boundary conditions", Earthquake Spectra, no.
31, vol. 4, pp. 2459-2484, 2015.
[15] V. Bosiljkov, A. Page, V. Bokan-Bosiljkov, and R. Zarnic,
"Performance based studies of in-plane loaded unreinforced
masonry walls", Masonry Int., no. 16, vol. 2, pp. 39-50, 2003.


![Giáo trình Cấu trúc dữ liệu và giải thuật - Trường CĐ Cơ điện Hà Nội [Mới nhất]](https://cdn.tailieu.vn/images/document/thumbnail/2026/20260323/lionelmessi01/135x160/58171774381670.jpg)


![Giáo trình Tiện nâng cao (Nghề Cắt gọt kim loại, Trình độ Cao đẳng) - Trường Cao đẳng Cơ điện Hà Nội [Mới nhất]](https://cdn.tailieu.vn/images/document/thumbnail/2026/20260323/lionelmessi01/135x160/48101774403543.jpg)


