Open Access
Available online http://ccforum.com/content/10/3/R88
Page 1 of 13
(page number not for citation purposes)
Vol 10 No 3
Research
Influence of fluid resuscitation on renal microvascular PO2 in a
normotensive rat model of endotoxemia
Tanja Johannes1,2, Egbert G Mik1, Boris Nohé2, Nicolaas JH Raat1, Klaus E Unertl2 and Can Ince1
1Department of Physiology, Academic Medical Center, University of Amsterdam, The Netherlands
2Department of Anesthesiology and Critical Care, University Hospital Tuebingen, Germany
Corresponding author: Tanja Johannes, t.johannes@amc.uva.nl
Received: 28 Feb 2006 Revisions requested: 18 Apr 2006 Revisions received: 23 Apr 2006 Accepted: 12 May 2006 Published: 19 Jun 2006
Critical Care 2006, 10:R88 (doi:10.1186/cc4948)
This article is online at: http://ccforum.com/content/10/3/R88
© 2006 Johannes et al.; licensee BioMed Central Ltd.
This is an open access article distributed under the terms of the Creative Commons Attribution License (http://creativecommons.org/licenses/by/2.0),
which permits unrestricted use, distribution, and reproduction in any medium, provided the original work is properly cited.
Abstract
Introduction Septic renal failure is often seen in the intensive
care unit but its pathogenesis is only partly understood. This
study, performed in a normotensive rat model of endotoxemia,
tests the hypotheses that endotoxemia impairs renal
microvascular PO2 (µPO2) and oxygen consumption (VO2,ren),
that endotoxemia is associated with a diminished kidney
function, that fluid resuscitation can restore µPO2, VO2,ren and
kidney function, and that colloids are more effective than
crystalloids.
Methods Male Wistar rats received a one-hour intravenous
infusion of lipopolysaccharide, followed by resuscitation with
HES130/0.4 (Voluven®), HES200/0.5 (HES-STERIL® ® 6%) or
Ringer's lactate. The renal µPO2 in the cortex and medulla and
the renal venous PO2 were measured by a recently published
phosphorescence lifetime technique.
Results Endotoxemia induced a reduction in renal blood flow
and anuria, while the renal µPO2 and VO2,ren remained relatively
unchanged. Resuscitation restored renal blood flow, renal
oxygen delivery and kidney function to baseline values, and was
associated with oxygen redistribution showing different patterns
for the different compounds used. HES200/0.5 and Ringer's
lactate increased the VO2,ren, in contrast to HES130/0.4.
Conclusion The loss of kidney function during endotoxemia
could not be explained by an oxygen deficiency. Renal oxygen
redistribution could for the first time be demonstrated during
fluid resuscitation. HES130/0.4 had no influence on the VO2,ren
and restored renal function with the least increase in the amount
of renal work.
Introduction
The kidney is one of the most commonly injured organs in crit-
ically ill patients. Acute renal failure is a complication in sepsis,
with a prevalence ranging from 25% in severe sepsis to 50%
in septic shock [1]. Sepsis seems to have an additional impact
on outcome, as mortality can be up to 75% among patients
with acute septic renal failure [2,3]. The pathogenesis of sep-
sis-induced renal failure is multifactorial and is characterized
by a reduction in the glomerular filtration rate that may occur
despite a maintained renal blood flow (RBF) and normal sys-
temic hemodynamics [4].
The morphology of the kidney can range from normal appear-
ing tissue to endothelial damage, medullary blockade with
tubular necrosis and disseminated fibrin thrombi [5]. Theories
on the pathogenesis suggest an uncontrolled and inappropri-
ate release of various inflammatory mediators leading to direct
cytotoxic effects or an impairment of the microvascular
autoregulation [6]. The latter might cause a maldistribution of
renal microcirculatory blood flow and oxygen supply. Regard-
ing renal tissue oxygenation, there is a high heterogeneity of
oxygen tensions within the organ due to the anatomy of the
renal microvasculature [7,8]. The fact that not all regions within
the kidney are equally well provided with oxygen makes the
organ rather sensitive to hypoxic injury [9]. The few studies
that have investigated changes in renal tissue oxygenation dur-
ing endotoxemia present contrasting results [10-12]. The rela-
tionship between renal oxygen delivery, consumption and
Clearcrea = creatinine clearance; cµPO2 = cortical microvascular PO2; DO2,ren = renal oxygen delivery; LPS = lipopolysaccharide; MAP = mean arterial
pressure; mµPO2 = medullary microvascular PO2; µPO2 = microvascular PO2; O2ERren = renal oxygen extraction; PO2 = partial pressure of oxygen;
PrvO2 = renal venous PO2; RBF = renal blood flow; TNa+ = tubular sodium reabsorption;VO2,ren = renal oxygen consumption;

Critical Care Vol 10 No 3 Johannes et al.
Page 2 of 13
(page number not for citation purposes)
tissue oxygenation, especially with regard to biological
response and functional consequences, is still poorly under-
stood and the role of oxygen in septic renal failure remains
controversial [10,13,14].
Fluid resuscitation is an early therapeutic strategy in the treat-
ment of septic shock, with the aim of restoring blood flow and
oxygen delivery to vital organs [15]. The decision of which
solution should be used during resuscitation remains contro-
versial, especially with regard to the kidney. There is an ongo-
ing discussion about the potential of hydroxyethyl starches to
impair renal function [16-18]. In well-hydrated patients without
preexisting renal dysfunction, however, application of starches
seems to be safe [19,20]. Fluid resuscitation not only has an
influence on systemic hemodynamics but also dilutes the
blood, resulting in beneficial effects on the microvasculature
[21,22].
A recently published study from our group demonstrates that
resuscitation with HES200/0.5 (HES-STERIL® 6%) could
successfully restore a decreased mucosal microvascular PO2
(µPO2) of the pig's intestine after lipopolysaccharide (LPS)
infusion [23]. In contrast to the mucosal µPO2, the serosal
µPO2 remained decreased. The gut mucosa and serosa can
be regarded as two differently behaving anatomical compart-
ments, and the same accounts for the kidney cortex and the
kidney medulla. The renal tissue PO2 is regionally different,
with values around 50 Torr (6.7 kPa) in the cortex and 20 Torr
(2.7 kPa) in the medulla [9]. As the tissue PO2 reflects the bal-
ance between oxygen delivery and consumption of oxygen in
viable cells and tissues [24], its observation in a model of sep-
tic renal failure can give important information, particularly
because renal hypoxia seems to play an important role in the
pathogenesis of the disease [9,25].
The primary objective of the present study is to test the hypoth-
esis that treatment of endotoxemia by fluid resuscitation with
either colloids or crystalloids improves an impaired µPO2,
resulting in restoration of oxygen consumption and kidney
function. Secondary to the primary objective our study involves
a detailed description of changes in oxygenation during endo-
toxemia and a comparison of different resuscitation fluids. Four
distinct hypotheses can be identified: that renal µPO2 and oxy-
gen consumption are impaired during endotoxemia; that this
effect is associated with a diminished renal function; that fluid
resuscitation with either colloids or crystalloids improves an
impaired µPO2 and oxygen consumption and restores kidney
function; and that colloids are better at resuscitating than crys-
talloids in this context.
In the present study we applied a new technique recently
developed and validated by our group [26] to a normotensive
rat model of endotoxemia. This phosphorescence quenching
technique allows the noninvasive quantitative measurement of
cortical microvascular PO2 (cµPO2) and medullary microvas-
cular PO2 (mµPO2) and the detection of the renal venous PO2
(PrvO2). A continuous noninvasive measurement of renal oxy-
gen consumption has been made possible with this unique
possibility. Furthermore, we determined the glomerular filtra-
tion rate and tubular sodium reabsorption, the major energy-
consuming and therefore oxygen-consuming process in the
kidney.
Materials and methods
Animals
All experiments in this study were approved and reviewed by
the Animal Research Committee of the Academic Medical
Center at the University of Amsterdam. Care and handling of
the animals were in accordance with the guidelines for Institu-
tional and Animal Care and Use Committees. Experiments
were performed on 37 Wistar male rats (Charles River, Maas-
tricht, The Netherlands) with a mean ± standard deviation
body weight of 282 ± 16 g.
Surgical preparation
Rats were anesthetized with an intraperitoneal injection of a
mixture of 90 mg/kg ketamine (Nimatek®; Eurovet, Bladel, The
Netherlands), 0.5 mg/kg medetomidine (Domitor®; Pfizer,
New York, NY, USA) and 0.05 mg/kg atropine-sulfate (Centra-
farm, Etten-Leur, The Netherlands). After tracheotomy the ani-
mals were mechanically ventilated with a FiO2 of 0.4. For drug
and fluid administration, four vessels were cannulated with pol-
yethylene catheters (outer diameter, 0.9 mm; Braun, Melsun-
gen, Germany).
A catheter in the right carotid artery was connected to a pres-
sure transducer to monitor the arterial blood pressure and the
heart rate. The right jugular vein was cannulated and the cath-
eter tip inserted to a depth close to the right atrium, allowing
continuous central venous pressure measurement. Catheters
of the same size were placed in the right femoral artery and
vein and were used for withdrawal of blood and continuous
infusion of Ringer's lactate at a rate of 15 ml/kg/hour (Baxter,
Utrecht, The Netherlands). The body temperature of the rat
was maintained at 37 ± 0.5°C during the entire experiment.
The ventilator settings were adjusted to maintain an arterial
PCO2 between 35 and 40 Torr (4.7–5.3 kPa). All preceding
steps were described in detail in a previous study [27].
The kidney was exposed, decapsulated and immobilized in a
Lucite kidney cup (K. Effenberger, Pfaffingen, Germany) via a
4 cm incision of the left flank. The renal vessels were carefully
separated from each other under preservation of the nerves. A
0.5 × 1.0 cm2 piece of aluminum foil was placed on the dorsal
site of the renal vein to prevent contribution of underlying tis-
sue to the phosphorescence signal in the venous PO2 meas-
urement. A perivascular ultrasonic transient time flow probe
(type 0.7 RB; Transonic Systems Inc., Ithaca, NY, USA) was
placed around the left renal artery and connected to a flow
meter (T206; Transonic Systems Inc.) to allow continuous

Available online http://ccforum.com/content/10/3/R88
Page 3 of 13
(page number not for citation purposes)
measurement of RBF [28]. The left ureter was isolated, ligated
and cannulated with a polyethylene catheter for urine collec-
tion. The operation field was covered with plastic foil through-
out the entire experiment, to prevent evaporation of body
fluids. The experiment was ended by infusion of 1 ml of 3 M
potassium chloride inducing a sudden cardiac arrest. Finally,
the kidney was removed and weighed, and correct placement
of the catheters was checked post mortem.
Hemodynamic and blood gas measurements
The mean arterial pressure (MAP) was continuously measured
in the carotid artery, calculated as: MAP (mmHg) = diastolic
pressure + (systolic pressure – diastolic pressure)/3. Further-
more the blood flow of the renal artery (ml/minute) was meas-
ured and recorded continuously.
An arterial blood sample (0.2 ml) was taken from the femoral
artery at three different time points: first time point, 0 minutes
Table 1
Systemic hemodynamics
Baseline (t0) Endotoxemia (t1) Resuscitation (t2)
Mean arterial blood pressure (mmHg)
Nonresuscitation group 117 ± 6 105 ± 13†96 ± 19*†
HES130/0.4 (Voluven®) group 118 ± 6 102 ± 21†96 ± 26*†
HES200/0.5 (HES-STERIL® 6%) group 119 ± 9 105 ± 11†114 ± 14
Ringer's lactate group 113 ± 10 102 ± 18†123 ± 26
Control group 113 ± 4 127 ± 3* 129 ± 6*‡
Heart rate (beats/minute)
Nonresuscitation group 263 ± 21 278 ± 27†294 ± 30*†
HES130/0.4 (Voluven®) group 268 ± 25 277 ± 22†299 ± 24*†
HES200/0.5 (HES-STERIL® 6%) group 252 ± 16 269 ± 27* 295 ± 16*†
Ringer's lactate group 247 ± 14 264 ± 26* 280 ± 19*†
Control group 261 ± 9 248 ± 9* 256 ± 7‡
Central venous pressure (mmHg)
Nonresuscitation group 3.8 ± 1.3 3.9 ± 0.6 3.7 ± 0.8
HES130/0.4 (Voluven®) group 4.0 ± 0.9 4.0 ± 0.9 6.3 ± 1.2*†‡
HES200/0.5 (HES-STERIL® 6%) group 4.2 ± 0.6 3.9 ± 0.6 6.0 ± 1.5*‡
Ringer's lactate group 3.8 ± 0.9 4.0 ± 1.4 6.7 ± 1.7*†‡
Control group 4.2 ± 0.9 4.5 ± 1.8 4.6 ± 1.1
Renal blood flow (ml/minute)
Nonresuscitation group 4.9 ± 0.9 2.5 ± 1.1*† 2.1 ± 1.3*†
HES130/0.4 (Voluven®) group 4.8 ± 1.0 2.1 ± 0.9*† 4.9 ± 1.5‡
HES200/0.5 (HES-STERIL® 6%) group 5.4 ± 1.0 2.0 ± 0.7*† 6.7 ± 1.1*†‡
Ringer's lactate group 4.9 ± 0.9 3.0 ± 1.2*† 5.7 ± 1.3*‡
Control group 5.6 ± 0.9 5.1 ± 1.0 5.1 ± 1.0‡
Renal vascular resistance (dyne/s/cm5)
Nonresuscitation group 26 ± 6 50 ± 22*† 51 ± 22*†
HES130/0.4 (Voluven®) group 25 ± 6 58 ± 32* 21 ± 8‡
HES200/0.5 (HES-STERIL® 6%) group 23 ± 5 57 ± 22*† 17 ± 1†‡
Ringer's lactate group 24 ± 7 38 ± 9*† 21 ± 2†‡
Control group 21 ± 3 26 ± 5* 26 ± 5*‡
Values presented as the mean ± standard deviation. *P < 0.05 versus baseline, †P < 0.05 versus control group, ‡P < 0.05 versus nonresuscitation
group.

Critical Care Vol 10 No 3 Johannes et al.
Page 4 of 13
(page number not for citation purposes)
= baseline (t0); second time point, 50 minutes = endotoxemia
(t1); and third time point, ~70 minutes = resuscitation (t2). The
blood samples were replaced by the same volume of
HES130/0.4 (Voluven®, 6% HES 130/0.4; Fresenius Kabi
Nederland B.V., Schelle, Belgium). The samples were used for
determination of blood gas values (ABL505 blood gas ana-
lyzer; Radiometer, Copenhagen, Denmark), as well as for
determination of the hematocrit concentration, hemoglobin
concentration, hemoglobin oxygen saturation, and sodium and
potassium concentrations (OSM 3; Radiometer).
Measurement of renal microvascular oxygenation and
renal venous PO2
Oxygen-dependent quenching of phosphorescence was used
to detect changes in µPO2 and to measure the PO2 in the renal
vein (PrvO2). In brief, after infusion a water-soluble phospho-
rescent dye (Oxyphor G2; Oxygen Enterprises, Ltd. Philadel-
phia, PA, USA) binds to albumin. This phosphor-albumin
complex is confined to the circulation and emits phosphores-
cence with a wavelength around 800 nm, if excited by a flash
of light [29]. The phosphorescence intensity decreases at a
rate dependent on the surrounding oxygen concentration. The
relationship between the measured decay time and the PO2 is
given by the Stern-Volmer relation: 1/τ = (1/τ0) + kq [O2],
where τ is the measured decay time, τ0 is the decay time at an
oxygen concentration of zero and kq is the quenching constant.
For oxygenation measurements within the rat renal cortex and
the outer medulla, a dual-wavelength phosphorimeter was
used. This new method was recently described and validated
elsewhere [26]. Oxyphor G2 (a two-layer glutamate dendrimer
of tetra-(4-carboxy-phenyl) benzoporphyrin) gets excited with
light of 440 nm and 632 nm, respectively, which allows a con-
tinuous and simultaneous measurement in two different
depths, the kidney cortex and the outer medulla. On the basis
of a high tissue penetration and the fact of the low light
absorbance of blood within the near-infrared spectrum, Oxy-
phor G2 is also well suited for oxygen measurements in full
blood. Using a frequency-domain phosphorimeter and a very
thin reflection probe, the technique of oxygen-dependent
quenching of phosphorescence was applied for noninvasive
detection of the PrvO2.
Calculation of renal oxygen delivery, renal oxygen
consumption, renal oxygen extraction and vascular
resistance
Renal oxygen delivery was calculated as DO2ren (ml/minute) =
RBF × arterial oxygen content (1.31 × hemoglobin × SaO2) +
(0.003 × PaO2), where SaO2 is arterial oxygen saturation and
PaO2 is arterial partial pressure of oxygen.
Renal oxygen consumption was calculated as VO2ren (ml/
minute/g) = RBF × (arterial – renal venous oxygen content
difference).
Renal venous oxygen content was calculated as (1.31 ×
hemoglobin × SrvO2) + (0.003 × PrvO2). The SrvO2 was calcu-
lated using Hill's equation with p50 = 37 Torr (4.9 kPa) and
Hill coefficient = 2.7 [30].
The renal oxygen extraction ratio was calculated as O2ERren
(%) = VO2ren/DO2ren.
Since values of renal venous pressure were not available, an
estimation of the vascular resistance of the renal artery flow
region was made: MAP – RBF ratio (U) = (MAP/RBF) × 100
[31].
Assessment of kidney function
Creatinine clearance (Clearcrea) was assessed as an index of
the glomerular filtration rate according to the standard proce-
dure to measure the function of the investigated kidney
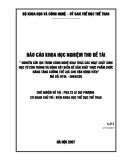
Figure 1
Example experimentExample experiment. Lipopolysaccharide (LPS) infusion resulted in a slight initial decline in the mean arterial pressure (MAP) and a marked
decrease in renal blood flow (RBF). Whereas the MAP recovered after 20 minutes, the RBF remained unchanged. Fluid resuscitation with 6 ml
HES130/0.4 restored RBF to 20% above baseline values. Cortical (cµPO2) and medullary (mµPO2) microvascular PO2 did not change during LPS
infusion. Upon fluid resuscitation cµPO2 markedly decreased.

Available online http://ccforum.com/content/10/3/R88
Page 5 of 13
(page number not for citation purposes)
[13,32]. Calculations of the clearance were made with the
standard formula: clearance (ml/minute) = (U × V)/P, where U
is the urine concentration of creatinine, V is the urine volume
per unit time and P is the plasma concentration of creatinine.
The specific elimination capacity for creatinine of the left kid-
ney was normalized to the organ weight. Urine samples from
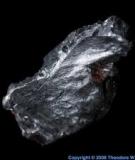
Figure 2
Measured renal oxygenation parametersMeasured renal oxygenation parameters. (a) Cortical microvascular PO2 (µPO2), (b) medullary µPO2 and (c) renal venous PO2 at baseline (t0),
endotoxemia (t1) and resuscitation (t2) in the control (C) group (n = 5), nonresuscitation (NR) group (n = 8), HES130/0.4 resuscitation group (n =
8), HES200/0.5 resuscitation group (n = 8) and Ringer's lactate (RL) resuscitation group (n = 8). *P < 0.05 versus baseline, #P < 0.05 versus con-
trol group, •P < 0.05 versus NR group. Rats are individually presented and connected by lines.