
Citation: Qian, R.; Wang, G.; Jiang, M.;
Zhang, Y.; Zhai, R.; Wang, W.
Frequency-Dependent Bouc–Wen
Modeling of Magnetorheological
Damper Using Harmonic Balance
Approach. Actuators 2024,13, 297.
https://doi.org/10.3390/act13080297
Academic Editors: Michal Kubík and
Janusz Gołdasz
Received: 27 June 2024
Revised: 1 August 2024
Accepted: 1 August 2024
Published: 6 August 2024
Copyright: © 2024 by the authors.
Licensee MDPI, Basel, Switzerland.
This article is an open access article
distributed under the terms and
conditions of the Creative Commons
Attribution (CC BY) license (https://
creativecommons.org/licenses/by/
4.0/).
actuators
Article
Frequency-Dependent Bouc–Wen Modeling of Magnetorheological
Damper Using Harmonic Balance Approach
Ruijing Qian 1, Guoping Wang 1,*, Min Jiang 1,* , Yanni Zhang 1, Rongjie Zhai 1and Wenjie Wang 2
1National Key Laboratory of Complex Multibody System Dynamics, Institute of Launch Dynamics,
Nanjing University of Science and Technology, Nanjing 210094, China
2Jianglu Machinery & Electronics Group Co., Ltd., Xiangtan 411100, China
*Correspondence: wgp1976@163.com (G.W.); jm_anhui@163.com (M.J.);
Tel.: +86-13912991321 (G.W.); +86-18355336128 (M.J.)
Abstract: Magnetorheological dampers (MRDs) are of great interest in engineering due to their
continuously adjustable damping characteristics. Accurate models are essential for optimizing MRDs
and analyzing system dynamics. However, conventional methods widely overlook the impact of
excitation frequency and amplitude. To address this issue, this work proposes a modified Bouc–Wen
model that can be adapted to various excitation conditions. The model’s parameters depend on
the current, excitation frequency, and amplitude. The mechanical characteristics of the MRD were
analyzed by the tests. The parameters in the Bouc–Wen model were identified by combining the
harmonic balance method and the genetic algorithm. The modified Bouc–Wen model was established
by analyzing the variation of each parameter with current, excitation frequency, and amplitude.
Finally, the agreement between the modified prediction model and the test results was verified under
sinusoidal excitation of 80 mm and 1 Hz. The average relative errors were 3.87%, 2.82%, 2.45%, 2.19%,
and 3.27% for current excitations of 0 A, 0.5 A, 1 A, 1.5 A, and 2.0 A, respectively. Since the MRD
in this paper operates from 0.5 Hz to 2 Hz, the modified model was validated in the same range.
Experiments demonstrate that the modified Bouc–Wen model efficiently and accurately describes the
mechanical properties of the MRD under various excitation conditions.
Keywords: magnetorheological damper (MRD); frequency-dependent model; harmonic balance
method; parameter identification
1. Introduction
Magnetorheological (MR) fluids are a new type of smart material that exhibits control-
lable rheological properties when subjected to an applied magnetic field [
1
]. These fluids
have attracted considerable attention in various fields, including vehicle suspension, con-
struction, and bridges [
2
] due to their continuously adjustable damping characteristics [
3
],
fast response time, and low energy consumption [
4
]. However, accurately and reliably
modeling the dynamics of MRDs is challenging due to their hysteresis and nonlinear char-
acteristics [
5
]. Several models, such as the Bingham model [
6
], the Bouc–Wen model [
7
],
and the hyperbolic tangent model [
8
], have been proposed to describe the mechanical
properties of MRDs. The Bouc–Wen model effectively captures the nonlinear characteristics
of the dynamic properties of MRDs at low speeds [
9
]. It is widely used in the nonlinear
modeling of MRDs due to its ability to describe hysteresis curves of various shapes by
adjusting the parameters [
10
]. However, the main challenge is to identify the characteristic
parameters reasonably and effectively. Traditional methods often base their results on a
particular excitation condition. When external excitation is altered, the model error can
often be significant, requiring re-identification of parameter values.
Previous model analyses have typically treated model parameters as a function of the
applied current. However, in reality, the damping output of a magnetorheological damper
Actuators 2024,13, 297. https://doi.org/10.3390/act13080297 https://www.mdpi.com/journal/actuators

Actuators 2024,13, 297 2 of 24
grows with increasing excitation frequency [
11
]. Therefore, it is necessary to propose a
frequency-dependent dynamic model for MRDs, where the model parameters are functions
of current, excitation frequency, and amplitude. The dynamics of the magnetorheological
damper under different excitations can be predicted by considering the effects of the
excitation frequency, amplitude, and current. Recently, numerous theoretical models have
been proposed to predict the damping characteristics of MRDs. Dominguez [
12
] proposed
a new Bouc–Wen model with current, amplitude, and frequency as variables. The new
model can better represent hysteresis behavior under different working conditions. The
new model adds to the original model a mathematical expression with excitation frequency
and amplitude as independent variables. However, there are 16 parameters to be identified,
which may decrease the efficiency. Ali [
13
] proposed a frequency-dependent MRD model
based on the Spencer model. However, the model requires the identification of a total
of 10 parameters, making the calculation less efficient. Boada [
14
] proposed a frequency-
dependent MRD model based on trigonometric functions. The model utilizes a neural
network (NN) to model the relationship between the parameters and frequency, which has
fewer parameters and highly accurate model results. Nevertheless, this method may require
large quantities of test samples and long-term training. Lei [
15
] established a predictive
model by piecewise describing the damping characteristics of the MRD. The predictive
model shows great agreement with experiments under different currents. However, there
are some limitations when it comes to different amplitudes and frequencies. Lv [
16
]
proposed a predictive MRD dynamics model based on the analysis of the rheological
behavior of MR fluids at high shear rates. The predictive model performs well in describing
the characteristics of MRDs, except for hysteresis.
Numerous strategies related to neural networks and machine learning have been
used for modeling the dynamics of magnetorheological dampers. These methods require
a large amount of data to be analyzed, and the computational cycle time is too long to
obtain an accurate model in a short period of time. To describe the mechanical properties
of MRDs under different excitation conditions efficiently, a modified model is necessary,
as the traditional model requires re-identification when the excitation conditions change.
The Bouc–Wen model explains the stiffness, kinematic viscosity, and other properties of
the damper through various parameters that are related to the current, frequency, and
amplitude of the excitation. This paper presents a dynamic model for MRDs using cur-
rent, frequency, and amplitude as variables. The modified model accurately predicts the
mechanical properties of MRDs under different external excitations.
This paper proposes a model based on the Bouc–Wen model that depends on current,
frequency, and amplitude. The model predicts the output damping force of the MRD based
on the excitation amplitude, frequency, and current. The model has fewer parameters to
identify, ensuring high calculation efficiency. The MRD discussed in this paper is applied
to vehicle suspension damping, with an operating frequency range of 0.5 Hz to 2 Hz.
Since the main objective of the MRD in this paper is to improve the driving comfort of
the vehicle by attenuating vibrations, the prediction model developed in this paper only
applies frequencies up to 2 Hz, matching the natural frequencies of the body model. To
achieve these objectives, the paper first conducted experiments to obtain the mechanical
characteristic curve of the MRD. The analysis shows that the hysteresis force of the damper
is influenced by the current, excitation frequency, and amplitude. Afterward, the MRD
was modeled using the Bouc–Wen model. The harmonic balance method was used in
combination with the genetic algorithm to determine specific parameter values under
different excitation conditions. Then, the functions were established by analyzing the
variation of each parameter with current, excitation frequency, and amplitude. A modified
Bouc–Wen model is proposed to describe the mechanical properties of MRDs under various
excitation conditions. The model includes current, excitation frequency, and amplitude as
variables. Finally, the model was used to predict the mechanical properties of this damper
under 80 mm and 1 Hz sinusoidal excitation. The simulations obtained by this method,
as well as the other two methods, are compared with the experimental data. The findings
Actuators 2024,13, 297 3 of 24
suggest that the modified model can accurately predict the hysteresis force of the damper
under different excitation conditions with an acceptable level of error.
2. MRD Mechanical Property Tests
To create a nonlinear model of the MRD, it is essential to analyze its dynamic properties.
The MRD used in the test was developed by the group. Fatigue testing machine input
displacement excitation to the damper, and the transducer was used to obtain the output
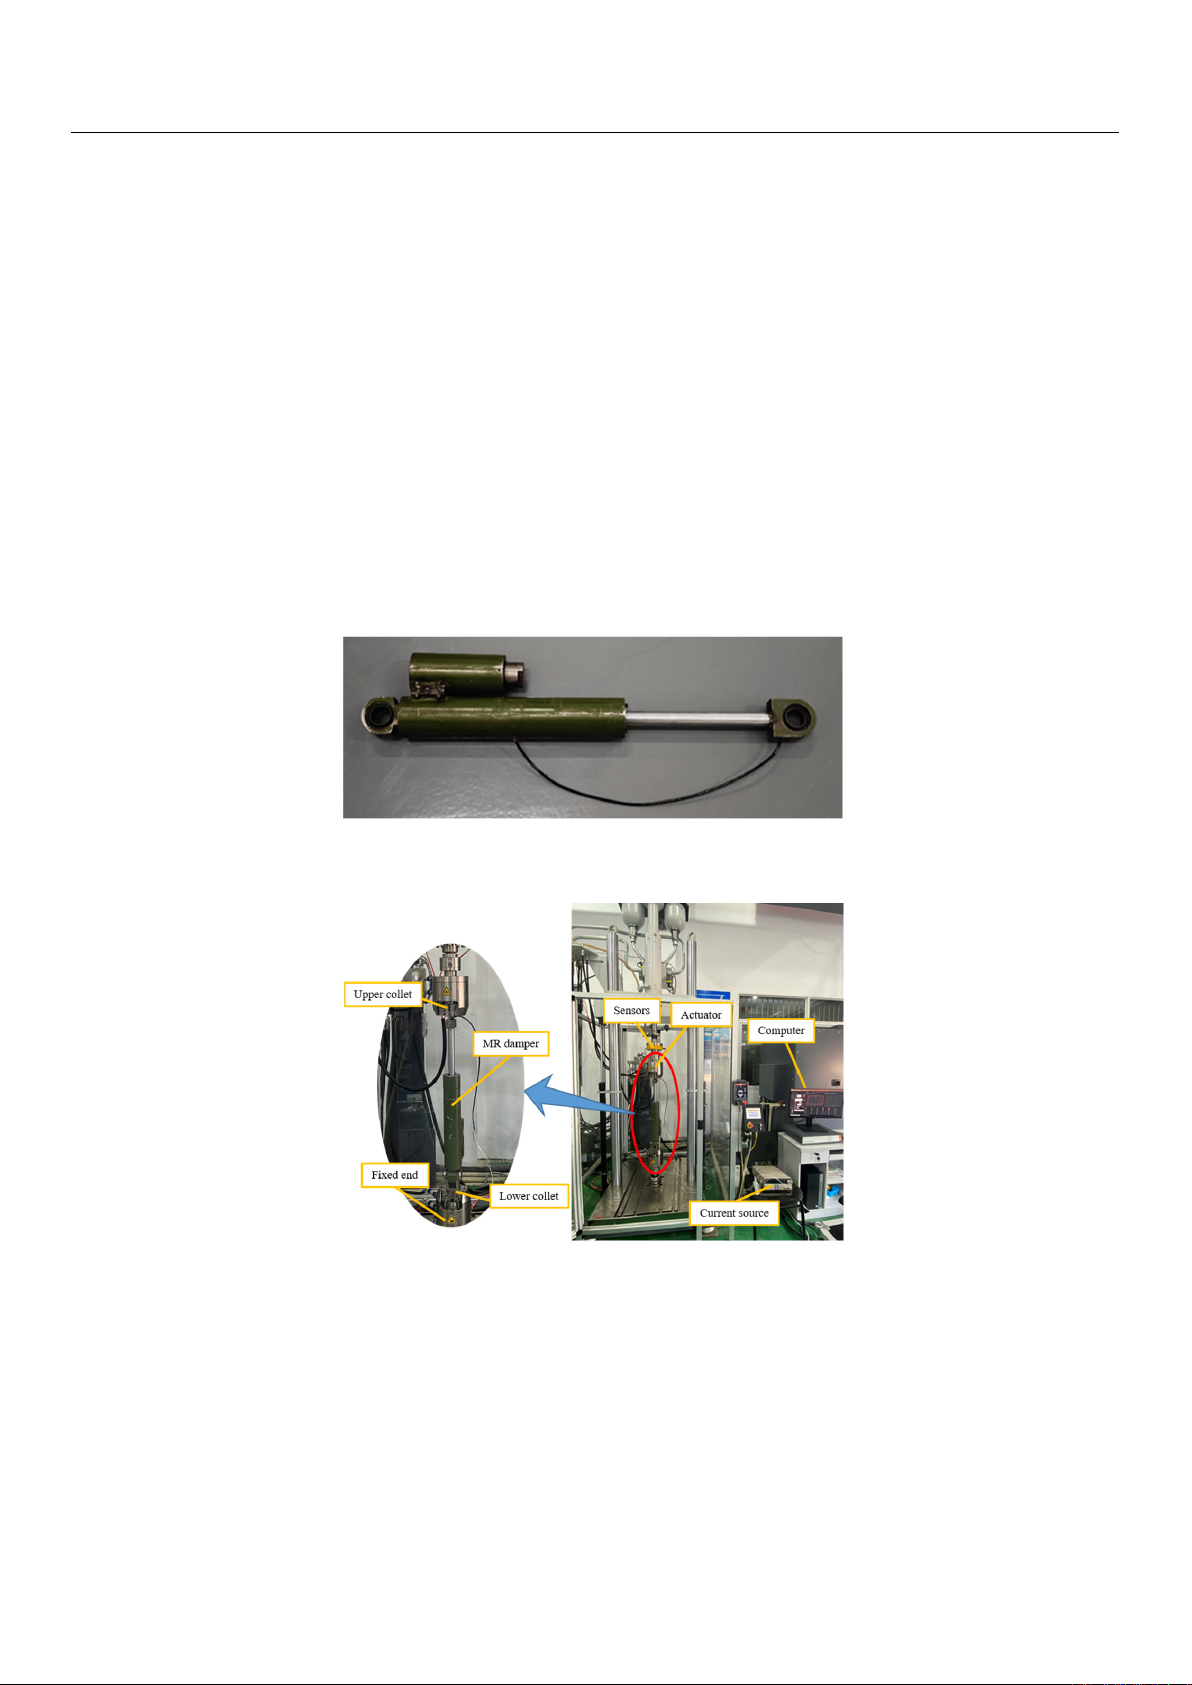
damping force. Figure 1shows the MRD used in the test, which consists of a single outlet
rod and double barrel construction. The primary and secondary barrels are cemented to
each other using nuts. The primary barrel is an MR module that provides the damping
force, while the secondary barrel has a pneumatic pocket to provide volume compensation.
The test system is shown in Figure 2. It comprises a fatigue testing machine, a controlled
current source, and a control computer. The MRD is mounted on the fatigue tester, and
the control computer adjusts the amplitude and frequency of the sinusoidal excitation as
needed. A current source is connected to the damper to provide controlled current. The
displacement and velocity signals collected by the sensors connected to fatigue machines
are used by the control computer to generate corresponding images.
Actuators 2024, 13, x FOR PEER REVIEW 3 of 26
Bouc–Wen model is proposed to describe the mechanical properties of MRDs under vari-
ous excitation conditions. The model includes current, excitation frequency, and ampli-
tude as variables. Finally, the model was used to predict the mechanical properties of this
damper under 80 mm and 1 Hz sinusoidal excitation. The simulations obtained by this
method, as well as the other two methods, are compared with the experimental data. The
findings suggest that the modified model can accurately predict the hysteresis force of the
damper under different excitation conditions with an acceptable level of error.
2. MRD Mechanical Property Tests
To create a nonlinear model of the MRD, it is essential to analyze its dynamic prop-
erties. The MRD used in the test was developed by the group. Fatigue testing machine
input displacement excitation to the damper, and the transducer was used to obtain the
output damping force. Figure 1 shows the MRD used in the test, which consists of a single
outlet rod and double barrel construction. The primary and secondary barrels are ce-
mented to each other using nuts. The primary barrel is an MR module that provides the
damping force, while the secondary barrel has a pneumatic pocket to provide volume
compensation. The test system is shown in Figure 2. It comprises a fatigue testing ma-
chine, a controlled current source, and a control computer. The MRD is mounted on the
fatigue tester, and the control computer adjusts the amplitude and frequency of the sinus-
oidal excitation as needed. A current source is connected to the damper to provide con-
trolled current. The displacement and velocity signals collected by the sensors connected
to fatigue machines are used by the control computer to generate corresponding images.
Figure 1. Exterior view of MRD.
Figure 2. The test setup system.
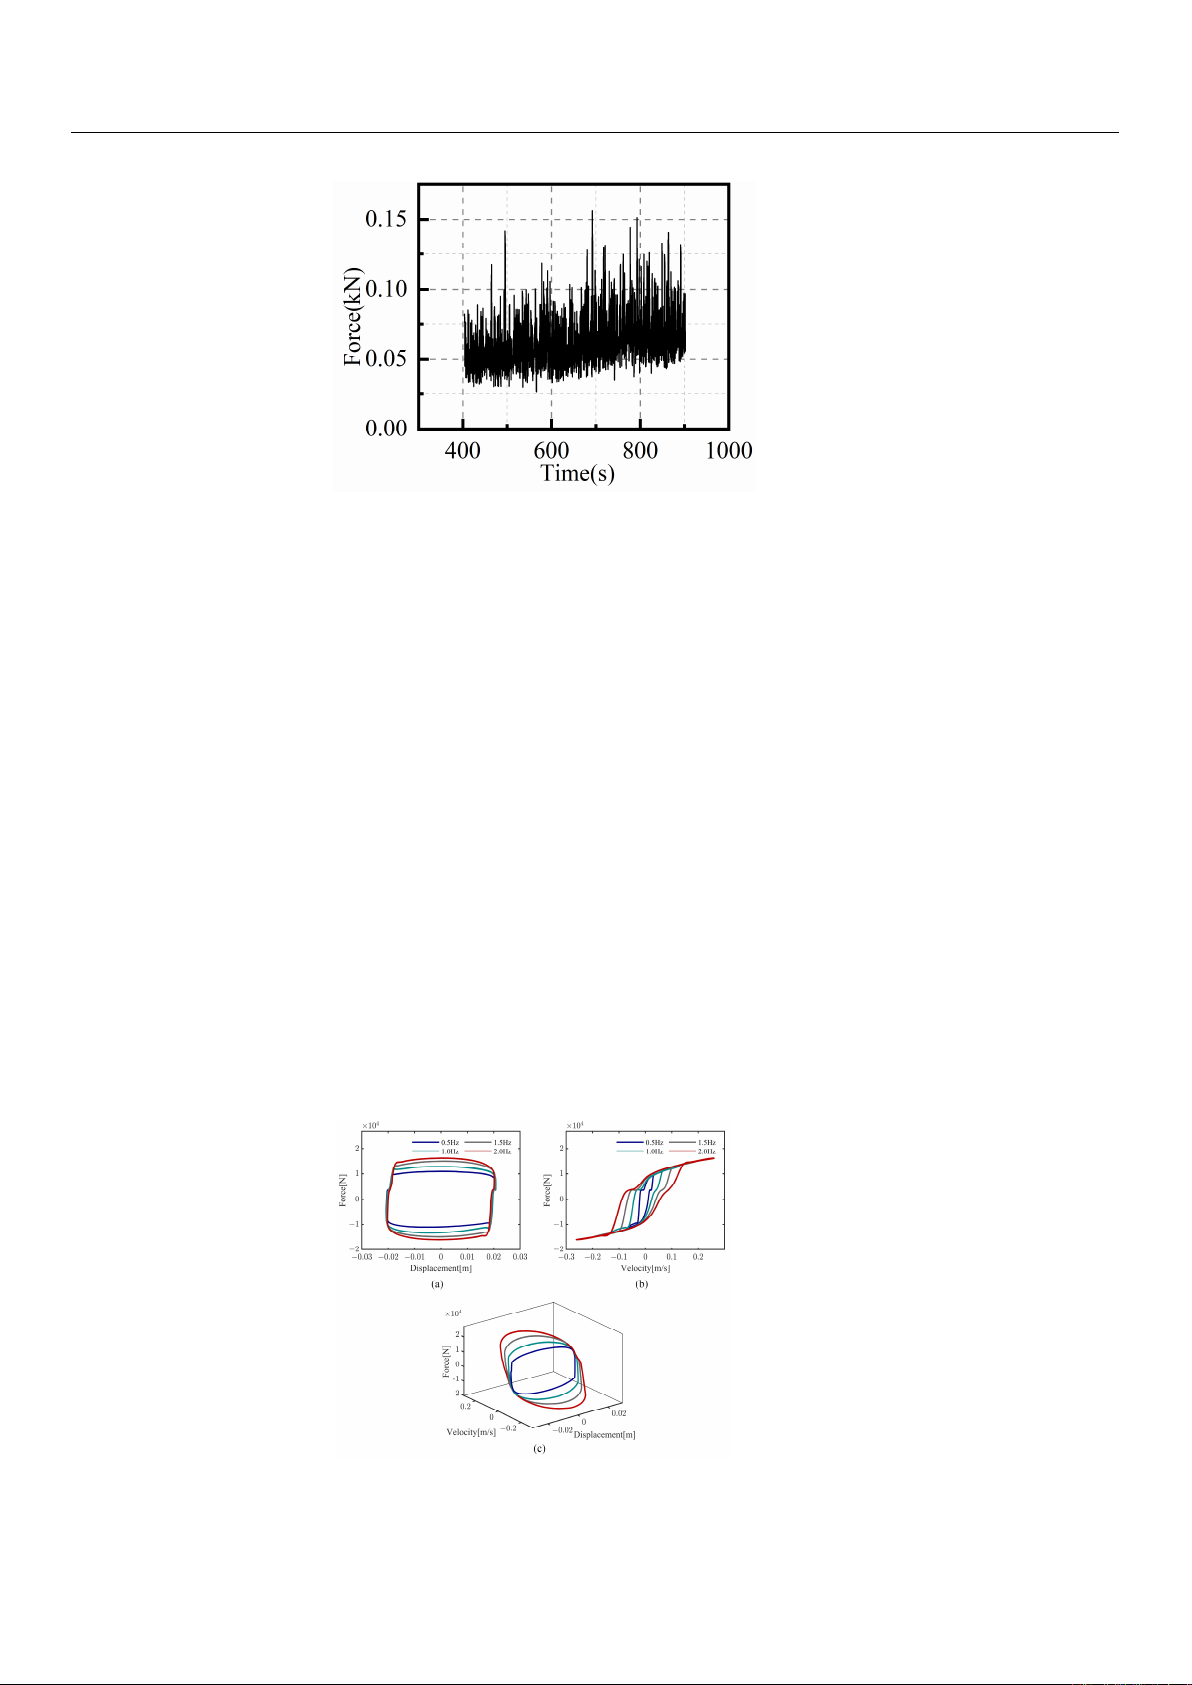
The effect of friction on the damping force in the MRD should be analyzed prior to
the mechanical property test. The MRD containing no fluid was tested by applying a small
uniform stretch (0.01 mm/s), and the friction force was obtained, as shown in Figure 3. The
friction fluctuates from 25 to 100 N, which is so small compared to the overall force that it
can be completely ignored. This is due to the fact that the friction of the damping force in
this paper comes mainly from the two seals, the end cap and the piston. Since the number
of seals is small, the friction force is tiny.
Figure 1. Exterior view of MRD.
Actuators 2024, 13, x FOR PEER REVIEW 3 of 26
Bouc–Wen model is proposed to describe the mechanical properties of MRDs under vari-
ous excitation conditions. The model includes current, excitation frequency, and ampli-
tude as variables. Finally, the model was used to predict the mechanical properties of this
damper under 80 mm and 1 Hz sinusoidal excitation. The simulations obtained by this
method, as well as the other two methods, are compared with the experimental data. The
findings suggest that the modified model can accurately predict the hysteresis force of the
damper under different excitation conditions with an acceptable level of error.
2. MRD Mechanical Property Tests
To create a nonlinear model of the MRD, it is essential to analyze its dynamic prop-
erties. The MRD used in the test was developed by the group. Fatigue testing machine
input displacement excitation to the damper, and the transducer was used to obtain the
output damping force. Figure 1 shows the MRD used in the test, which consists of a single
outlet rod and double barrel construction. The primary and secondary barrels are ce-
mented to each other using nuts. The primary barrel is an MR module that provides the
damping force, while the secondary barrel has a pneumatic pocket to provide volume
compensation. The test system is shown in Figure 2. It comprises a fatigue testing ma-
chine, a controlled current source, and a control computer. The MRD is mounted on the
fatigue tester, and the control computer adjusts the amplitude and frequency of the sinus-
oidal excitation as needed. A current source is connected to the damper to provide con-
trolled current. The displacement and velocity signals collected by the sensors connected
to fatigue machines are used by the control computer to generate corresponding images.
Figure 1. Exterior view of MRD.
Figure 2. The test setup system.
The effect of friction on the damping force in the MRD should be analyzed prior to
the mechanical property test. The MRD containing no fluid was tested by applying a small
uniform stretch (0.01 mm/s), and the friction force was obtained, as shown in Figure 3. The
friction fluctuates from 25 to 100 N, which is so small compared to the overall force that it
can be completely ignored. This is due to the fact that the friction of the damping force in
this paper comes mainly from the two seals, the end cap and the piston. Since the number
of seals is small, the friction force is tiny.
Figure 2. The test setup system.
The effect of friction on the damping force in the MRD should be analyzed prior to the
mechanical property test. The MRD containing no fluid was tested by applying a small
uniform stretch (0.01 mm/s), and the friction force was obtained, as shown in Figure 3. The
friction fluctuates from 25 to 100 N, which is so small compared to the overall force that it
can be completely ignored. This is due to the fact that the friction of the damping force in
this paper comes mainly from the two seals, the end cap and the piston. Since the number
of seals is small, the friction force is tiny.
Actuators 2024,13, 297 4 of 24
Actuators 2024, 13, x FOR PEER REVIEW 4 of 26
Figure 3. The friction force of the MRD.
Subsequently, two sets of tests were performed on the magnetorheological damper
using a sinusoidal signal as input displacement excitation.
()
sin 2
x
Aft
π
=⋅ ⋅⋅
(1)
where
x
denotes the input displacement in millimeters, A denotes the amplitude of the
sinusoidal signal in millimeters, and
f
denotes the frequency of a sinusoidal signal in Hz.
The MR damper was subjected to current excitations in the range of 0–2 A for differ-
ent combinations of the sinusoidal signal frequencies (0.5, 1.0, 1.5, 2.0 Hz) and amplitudes
(20, 50 mm).
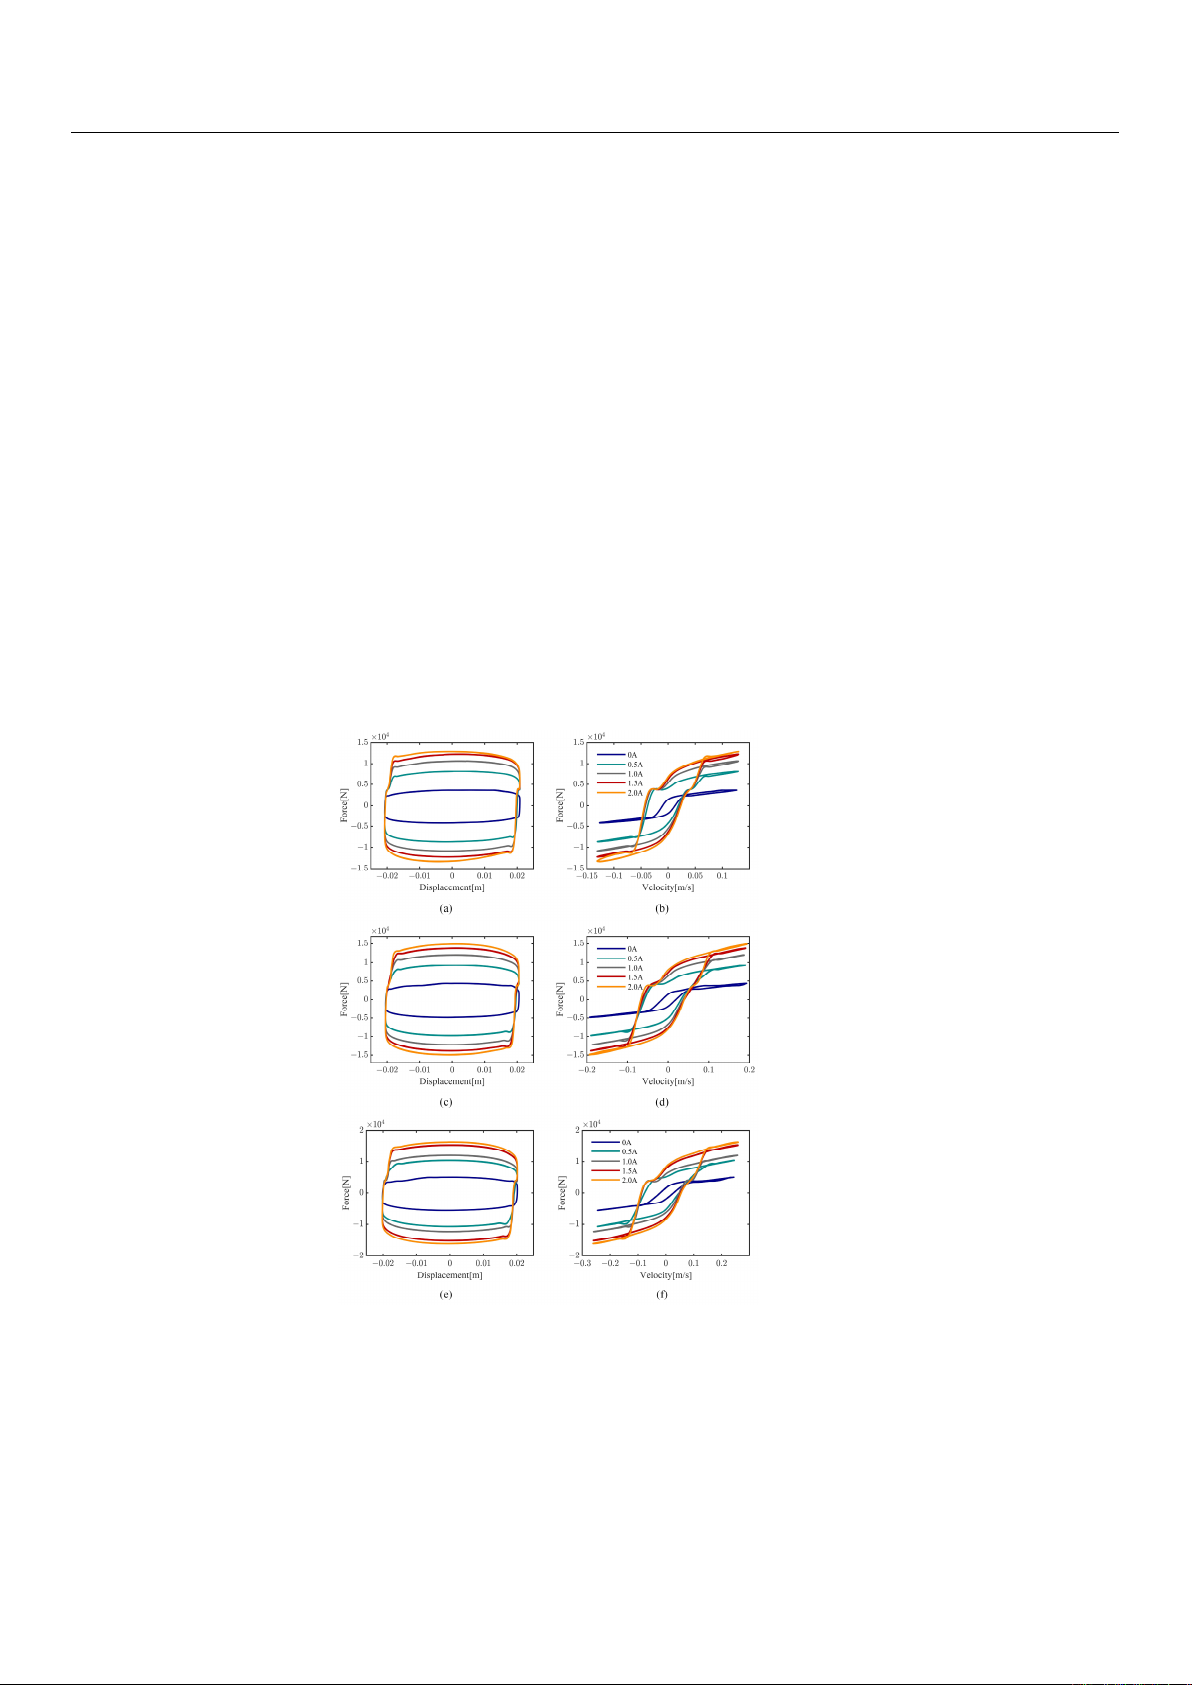
Figure 4 shows that for the same current and displacement, the damping output of
the magnetorheological damper varies at different frequencies. As shown in Figure 4a, an
increase in excitation frequency results in an increase in both the maximum damping out-
put and the enclosed area of the curve. This is because the high-frequency excitation signal
has a larger instantaneous velocity, and the damping force is positively related to the ve-
locity. The area enclosed by the force–displacement curve represents the energy dissi-
pated by the damper during each vibration cycle. The area increases with frequency, in-
dicating that the energy dissipated by the damper also increases. Figure 4b shows that the
amplitude of the damping force at different frequencies for the same velocity is basically
equal when the velocity and acceleration are in the same direction. However, when the
velocity and acceleration are in the opposite direction, the damping force at the same ve-
locity gradually decreases with increasing frequency.
Figure 4a shows a non-standard rectangular curve with a significant bulge in the re-
gion where the displacement is close to zero. This bulge is due to the elastic forces gener-
ated by the air spring used to compensate for the volume in the damper. Furthermore, the
curve exhibits a discontinuity in the form of a step at the point where displacement reaches
its maximum value. This corresponds to the region in Figure 4b, where velocity ap-
proaches zero and then reverses with acceleration. This is due to the fact that insufficient
pressure in the air pocket prevents the flow of the MR fluid from keeping up with the
movement of the piston, creating a vacuum cavity in the working area. The absence is
more noticeable at higher frequencies and velocity amplitudes of the damper.
Figure 4b shows that the force–velocity curve of the MRD has a larger hysteresis loop
in the low-speed region and a smaller hysteresis loop in the high-speed region. This is
because the damping properties of MR fluid vary with speed, exhibiting elastic properties
at low speed and plastic properties at high speed. Therefore, the low-velocity region of
the force–displacement curve is referred to as the elastic region, and the high-velocity re-
gion is referred to as the plastic region.
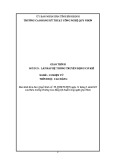
Figures 5 and 6 demonstrate that the output damping force of the magnetorheologi-
cal damper increases with the input current. At 1.5 A, the damping output force gradually
tends to saturate due to the magnetorheological fluid reaching its magnetic saturation
Figure 3. The friction force of the MRD.
Subsequently, two sets of tests were performed on the magnetorheological damper
using a sinusoidal signal as input displacement excitation.
x=A·sin(2π·f·t)(1)
where
x
denotes the input displacement in millimeters,
A
denotes the amplitude of the
sinusoidal signal in millimeters, and fdenotes the frequency of a sinusoidal signal in Hz.
The MR damper was subjected to current excitations in the range of 0–2 A for different
combinations of the sinusoidal signal frequencies (0.5, 1.0, 1.5, 2.0 Hz) and amplitudes (20,
50 mm).
Figure 4shows that for the same current and displacement, the damping output of
the magnetorheological damper varies at different frequencies. As shown in Figure 4a, an
increase in excitation frequency results in an increase in both the maximum damping output
and the enclosed area of the curve. This is because the high-frequency excitation signal has
a larger instantaneous velocity, and the damping force is positively related to the velocity.
The area enclosed by the force–displacement curve represents the energy dissipated by the
damper during each vibration cycle. The area increases with frequency, indicating that the
energy dissipated by the damper also increases. Figure 4b shows that the amplitude of
the damping force at different frequencies for the same velocity is basically equal when
the velocity and acceleration are in the same direction. However, when the velocity and
acceleration are in the opposite direction, the damping force at the same velocity gradually
decreases with increasing frequency.
Actuators 2024, 13, x FOR PEER REVIEW 5 of 26
strength. Simultaneously, as the current increases, the area of the force–displacement
curve envelope also increases in both Figures 5 and 6. This suggests that the damper’s
energy dissipation also increases with the current.
In summary, the mechanical properties of the magnetorheological damper are not
only related to the current but also to the frequency and amplitude of the excitation con-
ditions. This is because the variation in frequency and amplitude affects the speed of
movement of the piston.
Figure 4. Mechanical properties of 20 mm 2.0 A at different frequencies. (a) Force–displacement
curve (20 mm 2.0 A); (b) Force–velocity curve (20 mm 2.0 A); (c) Force–velocity–displacement curve
(20 mm 2.0 A).
Figure 5. Mechanical properties of 20 mm at different frequencies. (a) Force–displacement curve (20
mm 1.0 Hz); (b) Force–velocity curve (20 mm 1.0 Hz); (c) Force–displacement curve (20 mm 1.5 Hz);
(d) Force–velocity curve (20 mm 1.5 Hz); (e) Force–displacement curve (20 mm 2.0 Hz); (f) Force–
velocity curve (20 mm 2.0 Hz).
Figure 4. Mechanical properties of 20 mm 2.0 A at different frequencies. (a) Force–displacement
curve (20 mm 2.0 A); (b) Force–velocity curve (20 mm 2.0 A); (c) Force–velocity–displacement curve
(20 mm 2.0 A).
Actuators 2024,13, 297 5 of 24
Figure 4a shows a non-standard rectangular curve with a significant bulge in the
region where the displacement is close to zero. This bulge is due to the elastic forces
generated by the air spring used to compensate for the volume in the damper. Furthermore,
the curve exhibits a discontinuity in the form of a step at the point where displacement
reaches its maximum value. This corresponds to the region in Figure 4b, where velocity
approaches zero and then reverses with acceleration. This is due to the fact that insufficient
pressure in the air pocket prevents the flow of the MR fluid from keeping up with the
movement of the piston, creating a vacuum cavity in the working area. The absence is more
noticeable at higher frequencies and velocity amplitudes of the damper.
Figure 4b shows that the force–velocity curve of the MRD has a larger hysteresis loop
in the low-speed region and a smaller hysteresis loop in the high-speed region. This is
because the damping properties of MR fluid vary with speed, exhibiting elastic properties
at low speed and plastic properties at high speed. Therefore, the low-velocity region of the
force–displacement curve is referred to as the elastic region, and the high-velocity region is
referred to as the plastic region.
Figures 5and 6demonstrate that the output damping force of the magnetorheological
damper increases with the input current. At 1.5 A, the damping output force gradually
tends to saturate due to the magnetorheological fluid reaching its magnetic saturation
strength. Simultaneously, as the current increases, the area of the force–displacement curve
envelope also increases in both Figures 5and 6. This suggests that the damper’s energy
dissipation also increases with the current.
Actuators 2024, 13, x FOR PEER REVIEW 5 of 26
strength. Simultaneously, as the current increases, the area of the force–displacement
curve envelope also increases in both Figures 5 and 6. This suggests that the damper’s
energy dissipation also increases with the current.
In summary, the mechanical properties of the magnetorheological damper are not
only related to the current but also to the frequency and amplitude of the excitation con-
ditions. This is because the variation in frequency and amplitude affects the speed of
movement of the piston.
Figure 4. Mechanical properties of 20 mm 2.0 A at different frequencies. (a) Force–displacement
curve (20 mm 2.0 A); (b) Force–velocity curve (20 mm 2.0 A); (c) Force–velocity–displacement curve
(20 mm 2.0 A).
Figure 5. Mechanical properties of 20 mm at different frequencies. (a) Force–displacement curve (20
mm 1.0 Hz); (b) Force–velocity curve (20 mm 1.0 Hz); (c) Force–displacement curve (20 mm 1.5 Hz);
(d) Force–velocity curve (20 mm 1.5 Hz); (e) Force–displacement curve (20 mm 2.0 Hz); (f) Force–
velocity curve (20 mm 2.0 Hz).
Figure 5. Mechanical properties of 20 mm at different frequencies. (a) Force–displacement curve
(20 mm 1.0 Hz); (b) Force–velocity curve (20 mm 1.0 Hz); (c) Force–displacement curve (20 mm
1.5 Hz); (d) Force–velocity curve (20 mm 1.5 Hz); (e) Force–displacement curve (20 mm 2.0 Hz);
(f) Force–velocity curve (20 mm 2.0 Hz).
In summary, the mechanical properties of the magnetorheological damper are not only
related to the current but also to the frequency and amplitude of the excitation conditions.
This is because the variation in frequency and amplitude affects the speed of movement of
the piston.


![Giáo trình CAD và ứng dụng (Phần thực hành): [Hướng dẫn chi tiết]](https://cdn.tailieu.vn/images/document/thumbnail/2026/20260305/hoatulip2026/135x160/80431773135924.jpg)
![Giáo trình CAD và ứng dụng: [Hướng dẫn chi tiết/Tài liệu đầy đủ]](https://cdn.tailieu.vn/images/document/thumbnail/2026/20260305/hoatulip2026/135x160/37741773135924.jpg)


