MINISTRY OF EDUCATION AND TRAINING
VIETNAM ACADEMY OF SCIENCE AND TECHNOLOGY
-----------------------------
GRADUATE UNIVERSITY SCIENCE AND TECHNOLOGY
PHAM THI LIEN
RESEARCH ON THE SYNTHESIS, PROPERTIES OF
GdPO4:Tb3+ AND Gd2O3:Eu3+ NANOMATERIALS
ORIENTED FOR BIOMEDICAL APPLICATIONS
62 44 01 27
Major: Optical, optoelectronic and photonic materials Code:
SUMMARY OF DOCTORAL THESIS IN MATERIAL SCIENCE
Ha Noi - 2020
The thesis has been completed at:
Graduate University of Science and Technology -
Vietnam Academy of Science and Technology
Science supervisors:
1. Dr. Nguyen Thanh Huong
2. Prof. Dr. Le Quoc Minh
Reviewer 1:
Reviewer 2:
Reviewer 3:
The thesis was defended at Evaluation Council held at Graduate
University of Science and Technology - Vietnam Academy of
Science and Technology on , 2020.
Thesis can be further
referred at:
- The Library of Graduate University of Science and
Technology.
- National Library of Vietnam.
1
INTRODUCTION
1. 1. The necessity of the thesis
Luminescent nano-materials containing Rare Earth (RE-NP) have
received much attention in recent years. Notably, the materials GdPO4: Tb3+ and Gd2O3:Eu3+ become the critical research tool for the wide- ranging biomedical applications in the diagnosis and treatment of
human disease. Magnetic resonance imaging (MRI) examination and
especially live-cell fluorescence microscopy are widely utilized in
hospitals and clinics.
In Vietnam, many research groups have focused on the synthesis
of luminescent materials as photonic biomarkers, creating the
analytical tool for assessing the quality of biologicals, foods and
vaccines. However, most of the biomedical applications are primarily
based on a single functional tool, e.g. either luminescent material as a
biomarker or magnetic material as a hyperthermia agent for enhancing
the contrast of image. Therefore, it is urgent to develop a
multifunctional tool, especially simultaneously possessing
fluorescence and magnetic properties in a single system to improve
the efficiency of diagnostic and treatment processes.
According to the latest reports in the field of rare-earth luminescent materials, we decide to chose Terbium (Tb3+) and Europium (Eu3+)-activated Gadolinium (Gd3+) compounds as research objects. To our knowledge, these kinds of materials can meet the requirement of multifunctional tool because Gd3+ ions simultaneously exhibit fluorescence and magnetic properties, thus making them well-
suited to serve as nanoprobes in the diagnostic and treatment of human
disease.
2
To meet the requirement for diverse applications, the aim of our
thesis is to synthesize the luminescent nanomaterials with good
repeatability, well-controlled morphology, high solubility in water and
highly efficient luminescence. My doctoral thesis is entitled: “Research on the synthesis, properties of GdPO4:Tb3+ and Gd2O3:Eu3+ nanomaterials oriented for biomedical applications”. 2. Research objectives of the thesis - Successful synthesis of GdPO4:Tb3+ nanorods and Gd2O3:Eu3+
nanospheres.
- Coating GdPO4:Tb3+ nanorods and Gd2O3:Eu3+ nanospheres with a silica shell, functionalizing with NH2 functional group, conjugating
with anti-venom and anti-CEA antibodies for further biomedical
applications.
- Initial experimental application of
the nanocomplexs based GdPO4:Tb3+ nanorods and Gd2O3:Eu3+ nanospheres using immunofluorescence analysis method for labelling cells and
detecting the antigen of cobra venom and CEA antigen of colorectal
cancer cells.
3. Research contents of the thesis
In the following chapter 1, we present a brief overview of rare- earth doped luminescent material; GdPO4:Tb3+/Gd2O3:Eu3+ based luminescent materials and objects for biomedical application. Next,
we describe experimental methods and material characterizations used
in the thesis. We then present the material characterization results of GdPO4:Tb3+ nanorods and Gd2O3:Eu3+ nanospheres. We also examine and determine the magnetic hyperthermia property of GdPO4 and GdPO4:Tb3+ nanorods. These nanomaterials were then conjugated
3
with anti-venom and anti-CEA antibodies for further biomedical
applications. Finally, we demonstrate the great potential of these
multifunctional nanocomplexs for detecting cobra venom antigen and
the CEA antigen of colorectal cancer cells. We conclude in the last
chapter.
In this thesis, the luminescent nanomaterials have been
synthesized by using hydrothermal process and multistep synthesis
approach. Surface morphology and structural characteristics of as-
synthesized nanomaterials were examined with field emission
scanning electron microscopy (FESEM), high-resolution transmission
electron microscopy (HRTEM), energy dispersive X-ray spectroscopy
(EDX). The optical properties of as-prepared samples were measured
with the spectrometers (iHR550, Acton SP2300i and Fluorolof FL3-
2-2, Horiba (USA)). The magnetic properties were investigated with
magnetic field-dependent magnetization measurement using vibrating
sample magnetometer (VSM) system. The measurement of magnetic
induction heating is performed with the commercial RDO-HFI (IMS).
The biological experiments were performed at the Laboratory of
Molecular Biology (Vietnam Military Medical Academy).
Novel attribution of the thesis: - Successful synthesis of GdPO4:Tb3+ nanorods with a length of 300– 500 nm and width of 10–30 nm through hydrothermal process and Gd2O3:Eu3+ nanosphere with a diameter of 145–155 nm via multistep synthesis approach.
- Successfully coating GdPO4:Tb3+ nanorods and Gd2O3:Eu3+ nanospheres with a silica shell, functionalizing with NH2 functional
group, conjugating with anti-venom antibodies and anti-CEA
4
antibodies to detect the cobra venom antigen and CEA antigen of
colorectal cancer cells.
- The magnetic inducting heater effect of GdPO4 and GdPO4:Tb3+ have been investigated, at 300 Oe, 390 kHz, the temperature reach to 44 - 49 oC in 1500 s. The results indicating the synthesized materials are well-suited for application in magnetic hyperthermia
therapy.
The thesis is divided into 4 chapters:
Chapter 1: Rare-earthe doped luminescent nanomaterials.
Chapter 2: Experimental methods. Chapter 3: Synthesis of GdPO4:Tb3+ nanorods and the application of GdPO4:Tb3+ nanocomplexs for the detection of cobra venom antigen. Chapter 4: Synthesis of Gd2O3:Eu3+ nanospheres and the application of Gd2O3:Eu3+ nanocomplexs for the detection of the CEA antigen of colorectal cancer cells.
The main results of the thesis were published in 7 scientific papers. CHAPTER 1: RARE EARTH ION-BASED LUMINESCENT NANO MATERIALS
1.1. Introduction of luminescent nano materials 1.2. Rare earth ion-based fluorescente materials 1.2.1. Luminescent properties of rare earth compounds 1.2.1.1. Characteristics of Gd3+ ion 1.2.1.2. Characteristics of Tb3+ ion 1.2.1.3. Characteristics of Eu2+ and Eu3+ ions 1.2.2. Allowed electronic transition in RE3+ ion 1.2.3. Energy transfer process
5
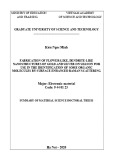
(a)
(b)
Figure 1. 7. Energy level diagram and energy transfer mechanism of Gd3+ ion to Eu3+ ion (a), Gd3+ ion to Tb3+ ion (b)
1.3 Features and applications of Gadolini 1.3.1. Gadolini material 1.3.2. The luminescent host material of Gd2O3 1.3.3. The luminescent host nanomaterial of GdPO4. 1.4. Characteristics of cobra venom and CEA antigens 1.4.1. Characteristics of Naja atra cobra venom
1.4.2. Characteristics of CEA colorectal cancer antigen
CHAPTER 2. EXPERIMENTAL METHOD
2.1. Chemical methods
2.1.1. Hydrothermal method
2.1.1.1. Introduction of hydrothermal method
Characteristics of material can tune by adjusting the following
parametrs: pH, temperature, speed of reaction, time of hydrolysis, and
crystallographic influence on morphology, magnitude and properties
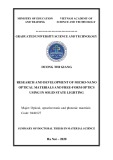
of final products. Synthesis process of GdPO4:Tb3+
6
Figure 2.4: Schematic representation for synthesis process of GdPO4:Tb3+
2.1.2 Multi-step chemical synthesis method
2.1.2.1 Introduction of a multi-step chemical synthesis method 2.1.2.2. Synthesis process of Gd2O3:Eu3+
Figure 2.5. Experimental diagram for preparation of Gd2O3: Eu3+ 2.1.3. Synthetic method of biomedical nano compounds GdPO4:Tb3+; Gd2O3:Eu3+. 2.1.3.1. Surface treatment method
2.1.3.2. Methods of surface functionalization and conjugation
between luminescent nanomaterials and biologically active
elements 2.1.3.3. Coating GdPO4: Tb3+ nanorods by Silica 2.1.3.4. Functionalizing GdPO4:Tb3+@Silica nanorods by -NH2
7
Figure 2. 7. Experimental diagram for wrapping and surface functionalization of GdPO4:Tb3+ nanorods 2.1.3.5. Preparation of GdPO4:Tb3+@Silica-NH2 nano compound with the snake venom antibody (IgG)
Figure 2. 8. Diagram of synthesizing nano compound by integrating GdPO4:Tb3+@silica-NH2 with the snake venom antibody (IgG)
2.1.3.6. Coating Gd2O3:Eu3+ by silica 2.1.3.7. Functionalization of Gd2O3:Eu3+ @Silica by -NH2
Figure 2.9. Diagram of wrapping Gd2O3:Eu3+ by Silica and integrating NH2 group
8
2.1.3.8. Synthesis of Gd2O3:Eu3+@Silica-NH2 nano compound with the CEA antibody.
Figure 2.10. Schematic illustration for the synthesis of nano compound by integrating Gd2O3:Eu3+@silica-NH2 with the CEA antibody (IgG)
2.2. Methods of material analysis
CHAPTER 3: RESEARCHING RESULTS OF GdPO4:Tb3+ AND APPLICATION OF GdPO4:Tb3+ NANO COMPOUND TO DETECT THE VENOM ANTIGEN
3.1. Crystal structure, morphology, optical and magnetic
properties of synthesized materials
3.1.1. FESEM analysis
3.1.1.1 FESEM images of GdPO4. 3.1.1.2. FESEM images of GdPO4: Tb3+
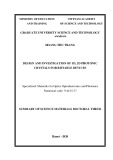
Figure 3.2 exhibits as-prepared materials have nanorod
morphology with the length of 300-500nm and the width of 10-30nm. It can be seen the nanorods in the sample with [Tb3+]/[Gd3+] = 7% are rather uniform and not clustered in bundles compared to others.
9
Figure 3.2. FESEM images of GdPO4:Tb3+ with the ratio of [Tb3+]/[Gd3+] = 0, 1, 3, 5, 7, 9%.
3.1.2 TEM images of GdPO4: Tb3+
Figure 3.3. Images of GdPO4: Tb3+ coated by silica
3.1.2. Powder XRD patterns of synthesized samples
As shown in figure 3.4, the X-ray diffraction peaks show that
synthesized materials have single-phase tetragonal structure with the
tetragonal shape and match with the peaks of standard 98-004-3396
for Gadolinium phosphate.
Figure 3. 4. The X-ray diffraction patterns of GdPO4, GdPO4:Tb3+
3.1.3. Optical properties
3.1.3.1. Luminescent spectra of GdPO4 3.1.3.2. Luminescent spectra of GdPO4:Tb3+
10
Figure 3.6 indicates the absorption peaks at 272 and 275nm, which are strong absorption bands of Gd3+, corresponding to 8S – 6I shift. The ones at 305 and 310nm corresponding to 8S – 6P shift are main absorption peaks of Gd3+. The excitation bands at the wavelengths of 350, 367 and 377 nm derive from Tb3+ ion which correspond to f-f electronic transitions between energy levels
belonging to 4f configuration.
Figure 3. 6. PLE spectra of GdPO4:Tb3+ (0- 9%).
Figure 3.7. PL spectra of GdPO4:Tb3+ with the ratio of 0, 1, 3, 5, 7, 9% excited at 272nm. As shown in figure 3.7, GdPO4:Tb3+ (0- 9%) samples emit the blue light due to the 5D4→7FJ (J = 6, 5, 4, 3) transition of Tb3+. The 5D4→7F6, 5D4→7F5, 5D4→7F4 and 5D4→7F3 transtions of Tb3+ correspond to the wavelengths of 488nm, 543, 586 and 620 nm, respectively. The strongest emission band occurs at 543 nm. 3.1.3.4. Luminescent spectra of GdPO4:Tb3+ @ silica integrated amin functional group and IgG antibody The luminescent intensity of the samples decreases in turn after functionalization, binding to the amine and IgG groups. However, such luminescent intensity slightly declines at the last step of binding to IgG, which is a favorable condition for the application of this material in the rapid detection of the cobra venom antigen.
11
Figure 3. 8. PL spectra of GdPO4:Tb3+(1), GdPO4:Tb3+@silica (2), GdPO4:Tb3+@silica –NH2 (3), GdPO4:Tb3+@silica –NH2-IgG (4).
3.1.4. Infrared (IR) spectra
Figure 3.9. IR spectra of GdPO4:Tb3+(a), GdPO4:Tb3+@silica (b) GdPO4:Tb3+@silica-NH2 (c) và GdPO4:Tb3+@silica-NH2-IgG (d).
The absorption bands of C-H (1400 cm-1), O-H of H2O (3500cm-1 3- (1043, 622 and 545 cm-1) are observed in the and 1600 cm-1) and PO4 IR spectrum of the samples, see figure 3.9. The presence of O-Si-O (1100-900 cm-1) and N-H (2200-2000 cm-1 and 3450 cm-1) bands proves the silica coating and surface functionalization by NH2 group
were successful.
12
3.1.5. Magnetism of GdPO4 and GdPO4:Tb3+
Figure 3.10. Magnetic curves of GdPO4:Tb3+ with the ratio [Tb3+]/[Gd3+] of 0, 1, 3, 5, 7, 9%. Figure 3.11. The magnetic inducting heater effect of GdPO4:Tb3+ with [Tb3+]/[Gd3+]: 0, 1, 3, 5, 7, 9%
It can be seen from figure 3.10 that the magnetization of GdPO4
reaches the highest value of 1,7 emu/g which is twice larger than that
of Zhang’s work and as much as that of Xu’s work. The magnetization of Tb3+ doped samples decrease, nevertheless the lowest value of GdPO4:9%Tb3+ also achieves 0,8 emu/g equivalent to the value of Zhang’s group. Therefore, GdPO4:Tb3+ can be used to increase the contrast level of the magnetic resonance image MRI.
The magnetic inducting heater effect of GdPO4 and GdPO4:Tb3+ have been investigated, at 300 Oe, 390 kHz (figure 3.11), the temperature reach to 44 - 49 oC in 1500 s. The results indicating the synthesized materials are well-suited for application in magnetic
hyperthermia therapy. 3.2. Application of GdPO4:Tb3+ in the detection of Naja atra venom antigen
The experiment of detecting
the venom antigen of GdPO4:Tb3+@silica-NH2-IgG nano compound is shown in figure 3.12.
13
Figure 3. 12. Diagrammatic illustration for detection of the venom antigen by Gd2O3:Tb3+@silica-NH2-IgG fluorescent nano compund
1. Attaching simultaneously the snake venom antigen and nano
compound on the 6-disc wells.
2. Incubating the nano compound integrated the antivenom
antibody with the venom antigen.
3. After washing, only the nano compound integrated the
antibody and antigen of the venom.
4. The nano compound emits blue luminescence with excitation
wavelength at 405nm
3.2.1. Evaluation of conjugating of nano material – IgG antigen
based on FTIR spectra
Figure 3. 13. FTIR spectra of IgG antibody samples before and after
conjugating luminescent material.
14
The line (a) in figure 3.13 indicates the presence of the O-H (3459 cm−1), N-H (2078 cm−1), C=O (1639 cm−1 to1442 cm−1) and the bond of N-H in the first amine group of carbonyl (C-N) group. The peak at 1389cm-1 in the line (b) is due to the formation of C - N bond by means of the aldehyd group (O = C - H) reaction of GDA bond with NH2 of
IgG. As a consequence, the combination of luminescent nanorods and
anti-venom antibodies were formed. 3.2.2. Evaluating the ability of GdPO4:Tb3+@silica-NH2-IgG nano compound in the detection Naja atra venom antigen.
(a) (b) (c)
Figure 3. 14. Image of Naja atra venom antigen under the visible
light (a); Naja atra antigen combined with nano material under the
visible light (b); Naja atra antigen combined with nano material
under the visible light observed under fluorescence microscope of
405nm, the magnification of 40x and eyepiece of 10x (c).
The results showed that the wells incubated with nanorods-antibodies
provided a green image and nanoparticles distributed uniformly
throughout the field green light under a 40x fluorescence microscope
(Figure 3.14 (c)). This result shows that these wells have a specific
association between the nanorods-antibodies and the Naja atra cobra
antigen so that when it was washed, it does not wash away.
Meanwhile, other emissions were not green due to the absence of a
combination of antibody-coated nanoparticles and Naja atra cobra
venom antigens so they were washed away during washing. Based on
15
these results, it could be concluded that this Naja atra venom detection
procedure can shorten the time needed for early diagnosis and improve
the efficacy of treatment and thus could facilitate early treatment of
snake bite and save lives. Thus, with respect to other green-emitting
luminescent materials like Yb, Er-codoped NaYF4 or TbPO4·H2O-
based nanomaterials, our synthesized immunoglobulin G-conjugated GdPO4·nH2O:Tb3+ nanorods are compatible for detection of antigen- antibody reaction. CHAPTER 4: RESEARCHING RESULTS OF Gd2O3:Eu3+ AND APPLICATION OF Gd2O3:Eu3+ NANO COMPOUND TO DETECT THE CEA ANTIGEN OF COLORECTAL
CANCER CELLS
4.1. The analyses of structure, morphology, optical and magnetic
properties of samples 4.1.1. FESEM images
• FESEM images of Gd(OH)CO3.H2O:Eu3+ with the different
ratio of [Urê]/ [Gd3++ Eu3+]
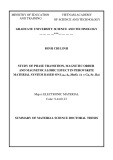
Figure 4.1. FESEM images of Gd(OH)CO3.H2O:Eu3+ with the ratio [Urê]/[Gd3+ + Eu3+] of 20 (a), 25 (b), 30 (c), 35 (d), 40 (e) All samples obtained have nanospherical shape as seen in Figure
4.1. The diameter of such nanospheres increases with the increase of molar ratio [Urê]/ [Gd3+ + Eu3+]. Typically, the average diameter of
16
nanospheres is 140, 190, 210, 240 and 270nm corresponding to the molar ratio [Urê]/[Gd3+ + Eu3+] of 20, 25, 30, 35 and 40, respectively. With the ratio [Urê]/[Gd3+ + Eu3+] of 25, the nanospheres are generally the most uniform. As a consequence, this ratio is used to synthesize Eu3+-doped Gd2O3 with the molar ratio Eu3+/ Gd3+ of 3,5; 5; 6; 7; 7,5 and 8%. • FESEM images of Gd(OH)CO3.H2O: Eu3+ dried at 70oC
Figure 4.3. FESEM images of Gd(OH)CO3.H2O:Eu3+ dried at 70oC with the ratio [Urê]/[Gd3++Eu3+] of 0 (a); 3,5(b); 5(c); 6(d); 7(e); 7.5(f) and 8%(g)
As shown in Figure 4.3, when Eu3+ is not doped, the nanospheres are quite uniform with the diameter of about 157-173nm (Figure 4.3a). When doping Eu3+ with different molar ratios Eu3+/Gd3 + of 3.5; 5; 6; 7; 7.5 and 8%, the nanospheres have the diameter in the range of 100- 230nm. From FESEM images, for Eu3+-doped sample with the concentration of 6%, the nanospheres are rather uniform with the
diameter of 185-195 nm compared to others. As a result, this sample
is selected for next experiments.
4.1.2. Thermogravimetric analysis (TGA)
From Figure 4.4, one can observe 4 phases including: Phase 1 (25- 200oC): the weight of sample decreases 5.79% due to the evaporation
17
of water molecules; Phase 2 (200-380oC): the 8.13 wt % loss is observed because of the decomposition of OH group. Phase 3: the decomposition of cacbonate group in the range of 380-550oC results in 15.21wt% loss. Phase 4: a further 28.49 wt% loss between 550 and 1000oC is caused by the disintegration of cacbonate group. In all 4 phases, there are strong points of heat absorption at 170, 319, 427 and 609 oC. These can be considered as the phase transition points, yielding to can be selected suitable processing temperature to obtain
the material with a stable phase structure. Therefore, we choose the sample processing temperature of 650 oC, at this temperature the product obtained will be Gd2O3:Eu3+.
Figure 4. 4. TG-DTG curves of the as-prepared
Gd(OH)CO3.H2O:Eu3+
Figure 4.5 shows the diameter of Gd2O3 nanospheres (a) after annealing at 650oC with the diameter of about 104-130nm. The diameter of nanospheres in the sample containing 3.5% Eu3+ (b), 5% Eu3+ (c), 6% Eu3+ (d), 7% Eu 3+ (e), 7.5% Eu3+ (f ) and 8% Eu 3+ (g) is about 105-143nm, 117-130nm, 145 -155nm, 136-150nm, 99-130nm
and 176-200nm, respectively.
18
Figure 4.5. FESEM của vật liệu Gd2O3:Eu3+ khi ủ ở nhiệt độ 650oC với tỷ lệ [Eu3+]/[Gd3+] là 0 (a); 3,5(b); 5(c); 6(d); 7(e); 7.5(f);8%(g). 4.1.3. TEM images of Gd2O3: 6%Eu3+
Figure 4.6. TEM images of Gd2O3: 6%Eu3+ (a) and Gd2O3: 6%Eu3+@silica (b). Figure 4.6 exhibits that the nanospheres are uniformly synthesized
with the diameter of about 145-155 nm which is similar to the FESEM
results (Figure 4.6a). The diameter of such nanospheres increase
significantly after coating silica, around 155-165nm. The silica shell
can be easily observed by naked eyes (Figure 4.6b).
4.1.4. Powder XRD patterns of as-synthesized samples
The sample of Gd(OH)CO3.H2O:6%Eu3+ is almost amorphous annealed at 200oC. However, X-ray diffraction peaks are observed at 2θ: 28,70; 33,10; 47,60; 56,40; and 59.10º, in agreement with the standard of JCPDS:110604, when annealing at 650oC. This can be confirmed that the material obtained is cubic crystal.
19
Figure 4. 8. The X-ray diffraction patterns of Gd(OH)CO3.H2O:6%Eu3+ heated at 200oC and 650oC.
4.1.5. EDX spectrum analysis
Through EDX spectrum analysis, it can be seen that the
synthesized sample includes the chemical elements Gd, O, Eu. Such
sample hence can be considered to be pure. The EDX spectrum of Gd2O3: Eu3+@silica indicates the presence of Si atom. 4.1.6. FTIR spectra
Figure 4.11 plots the infrared spectra of Gd2O3: 6% Eu 3+ calcined at 650oC with and without silica shell. The specific absorption regions of Gd2O3 are represented at 415.49; 449.66 and 542.9 cm-1, see Figure 4.11a. The oscillation of 543 cm-1 can be attributed to the strain oscillation of Gd-O, which confirms the formation of Gd2O3. Strong absorption regions at 3446 and 1634 cm-1 specify for the typical bonds of hydroxyl (OH) group and water hydration in structure. Figure 4.11b is the infrared spectrum of Gd2O3:6%Eu3+@silica, the feature oscillations of OH and Si-O-Si bonds are observed at the regions of 1050 – 1250 cm-1 và 650 – 800 cm-1, respectively. Combining the results of EDX and FTIR analysis can confirm that the silica is coated
on the outer shell of the nanospheres.
20
Figure 4. 11. FTIR spectra of (a) Gd2O3:6%Eu3+ and (b) Gd2O3:6%Eu3+@Silica.
4.1.7. Luminescent properties
Figure 4. 12. PLE spectrum of Gd2O3:6%Eu3+
Figure 4.12 shows the PLE spectrum of Gd2O3:6%Eu3+ observed at the emission wavelength of 611nm. The strong absorption Eu3+- O2, the weak band at 266 nm is absorption peaks of 272 and 275nm correspond to the shift of 8S – 6I, a charge-transfer band of the absorption peaks at 305 and 310 nm correspond to the displacement of 8S – 6P. All absorption peaks above are the characteristic of Gd3+. The excitation bands at 394, 467 and 534 nm are derived from the Eu3+ centers corresponding to the electron f-f transitions between the energy levels belonging to the configuration 4f6 of Eu3+.
The PL spectra of Gd2O3:X%Eu (X=3,5; 5; 6; 7; 8%) excitated at
270nm wavelength are plotted in Figure 4.13. Strong emission peak at 611 nm corresponds to the shift of Eu3+ ion from 5Do →7F2. Other peaks at 590, 625, 650 and 705nm have lower intensity and they
21
correspond to the shift of 5D0 → 7F1; 5D0 → 7F2; 5D0 → 7F3 and 5D0 → 7F4.
Figure 4. 13. PL spectra of Gd2O3:X%Eu (X=3,5; 5; 6; 7; 8%) In Fig.4.14 it can be seen the photoluminescence spectra of Gd2O3:6%Eu3+coated with silica shell in different thickness. First, the photoluminescence intensity of Gd2O3:6%Eu3+@silica nanospheres dried at 70ºC before being coated and annealed at 650ºC was stronger
than that of pure core phosphor. When the silica coating in the emission range from 611 to 621nm belonging to the 5D0 – 7F2 displacement occurs interaction on the orbit, the crystal field
degenerates the energy level to make the line. With the sample coated with one layer of silica, maximum separation occurs in the 5D0 – 7F2 emission range due to its low crystal symmetry. When coated with 2
layers, 3 layers at high crystal field symmetry leads to separate less.
When the crystal field is large, the average energy shifts towards the
high energy, the emission peak of 621nm thus increases with
increasing silica thickness.
22
Figure 4.14. PL spectra of Gd2O3:6%Eu containing 1, 2 and 3 layers. 4.2. Combining Gd2O3:Eu3+@Silica-NH2 luminescent material with IgG antbody to detect CEA.
4.2.1. Evaluation of the ability to detect CEA antigen by nano
compound.
Figure 4.16. Diagrammatic illustration for detection of CEA by Gd2O3:Eu3+@Silica-NH2-IgG nano fluorescent compound.
(a) (b) (c) (d)
Figure 4. 17. Fluorescent microscopy images of samples: Ref1 (a), disc 3 (b), disc 4 (c), disc 5 (d) under the fluorescence microscope at 405nm wavelength, 40x magnification, 10x eyepiece.
Figure 4.17 is the images for detecting the CEA antigen by Gd2O3:Eu3+@silica-NH2-IgG nano compound under the fluorescence microscope with the magnification of 40x, the eyepiece of 10x. As
observed, reference disc 1 (Figure 4.17a) is only the image of pure
23
CEA without glowing red. Reference disc 2 do not recognize the
image due to the nano compound being lost during washing. For discs
3, 4 and 5 when the concentration of nano compounds increases from
3 to 10 mg / ml (Figure 4.17b, c, d), it is easy to observe the increase
of red luminescent points, the most obviously observation occurs for
the nano compound with the concentration of 10 mg/ml. This indicates
that an immunofluorescent reaction has occurred between the nano
compound and the CEA antigen.
4.2.2. Evaluation of the ability to detect CEA antigen of the
colorectal cancer cells HT-29 by nano compound.
After evaluating the results of detection of pure CEA antigen, we
test on colorectal cancer HT-29 containing CEA antigen.
(a) (b) (c) (d)
Figure 4. 18. Fluorescence microscopy image of Ref1 (a), disk 3 (b), disc 4 (c), disc 5 (d), under the fluorescence microscope at 405nm wavelength, 40x magnification, 10x eyepiece.
The results obtained show that reference dics 1 (Figure 4.18a)
with only the CEA antigens is not red luminescence. Reference dics 2
can not observe the image because the drifting elements were not
conjugated during the washing process. Discs 3, 4 and 5 (Figure 4.18 b, c, d) corresponding to the volumes of nano complex of 50µl (b), 75µl (c) and 100µl (d) record luminescent images. The color becomes strong with increasing the volume of nano compound. This proves that
there is a conjugation between nano compound and cancer cell's CEA
24
antigen. Therefore, this nano compound can be used to detect the CEA
antigens of colorectal cancer cells.
CONCLUSION
From the obtained research results, we briefly conclude the main
conclusions as follow:
1. Successful synthesis of GdPO4:7%Tb3+ nanorods with a length of 300–500 nm and width of 10–30 nm, single-phase crystallizing with
the rhabdophane tetragonal structure type through hydrothermal
magnetic
process. We investigated and determined the effect from the induction heating of GdPO4 and GdPO4:Tb3+ nanomaterials in aqueous solution. The result exhibited that the
temperature was increased to 44–49°C under an applied magnetic
field of 300 Oe for 1500 seconds. We also successfully synthesized Gd2O3:6%Eu3+ nanosphere with a diameter of 145–155 nm and high uniformity over 95% through multistep synthesis approach.
2. Successfully coating GdPO4:7%Tb3+ nanorods and Gd2O3:6%Eu3+ nanospheres with a silica shell, functionalizing with NH2 functional
group, conjugating with anti-venom and anti-CEA antibodies.
3. Testing GdPO4:7%Tb3+@Silica-NH2-IgG nanocomplexs in the detection of cobra venom antigen and Gd2O3:6%Eu3+@Silica-NH2- IgG nanocomplexs in the detection of the CEA antigen of colorectal
cancer cells.
The obtained results show that the nanosystems based on GdPO4:7%Tb3+ nanorods and Gd2O3:6%Eu3+ nanospheres are feasible for many applications in photonics, display, security,
magnetic hyperthermia in biomedicine, which contributes to early
diagnosis and improves disease treatment efficiency.