MINISTRY OF EDUCATION VIETNAM ACADEMY
AND TRAINING OF SCIENCE AND TECHNOLOGY
GRADUATE UNIVERSITY SCIENCE AND TECHNOLOGY
-----------------------------------
INVESTIGATION OF LASING EMISSION EFFECT AND
OPTICAL AMPLIFICATION IN THE CAVITY CONJUNCTED
WITH 1D, 2D PHOTONIC CRYSTAL STRUCTURES
Nguyen Van An
Major: Materials for Optics Optoelectronics and Photonics
Code: 9 44 01 27
SUMMARY OF SCIENCE MATERIALS DOCTORAL THESIS
Hanoi – 2020
The thesis was completed at: Graduate University of Science and Technology - Vietnam Academy of Science and Technology.
Supervisor 1: Assoc. Prof. Dr. Ngo Quang Minh
Supervisor 2: Assoc. Prof. Dr. Pham Van Hoi
Reviewer 1: …
Reviewer 2: …
Reviewer 3: ….
The thesis will be defended at Graduate University of Science and
Technology - Vietnam Academy of Science and Technology at ……,
…..........., 202….
The thesis could be found at:
- Library of Graduate University of Science and Technology
- National Library of Vietnam
1
INTRODUCTION
1. The urgency of the thesis
The transmission of electromagnetic waves inside 1D-PhC was
first studied by Lord Rayleigh in 1887. In 1987, the research works
about 3D-PhC related to effect of the random emission prohibition in
PhC due to existence of PBG was published and proposed by E.
Yablonovitch and S. John [1,2]. From that, PhC has attracted the
special attention of the researchers in the field of using the new
structures based on PhC to conduct, transmit and control
electromagnetic waves as well as use electromagnetic waves to
information processing. The 2D-PhC controlled waveguide
properties, convergence on 2D surface and 1D-PhC fibers for single
mode lasers with high output power weve proposed by Birks in 1997
[3]. Until 1999, after O. Painter’s team succeeded in fabricating 2D-
PhC lasers with directional feedback distribution effects in the 2D-
PhC lattice structure [4], lasers based on photonic materials have
been promoted in research in photonic laboratories around the world.
The PhC’s cavities with different quasiperiodic lattices have been
studied by many groups by theoretical calculation, simulation and
experiment to fabricate them [5,6]. The 3D-PhC structure can control
the waveguide in 3D space, therefore it has great applicability in
micro-optical integrated circuits and ultra-low emission threshold
laser, the first 3D-PhC was fabricated by E. Yablonovitch in 1991
based on diamond nanoparticles distributed in organic glass lattice
[7]. The micro-resonant cavities with Whispering-Gallery-Mode
(WGM) give a (Q) high quality factor and small mode volume so
they have been used to decrease the laser emission threshold and
other nonlinear optical effects [8-10]. In addition, the micro-resonant
2
cavities with WGM have also been widely used for many fields such
as quantum optic, quantum electrodynamics resonance and narrow
spectrum laser [11-13]. The microspherical laser with the size from a
few microns to several tens of microns is one of the photonic device
subjects that is most interested in research due to pump light and
emission laser have been strongly held in microsphere thanks to the
total reflection on inside surface of device, so ultra-low laser
emission threshold and ultra-narrow laser emission spectrum. The
optical micro-resonant lasers with features such as ultra-low laser
emission threshold, ultra-narrow spectral width, controlled the
number of emission modes depending on the structure of the micro-
resonance and the techniques to collect the emission signals from
micro-resonant cavity have become development research subjects of
photonic sensors for biochemical and environment with ultra-high
sensitivity [14-18]. Now, the research on optical micro-resonant
lasers in general and microspherical lasers, in particular, has given a
lot of new information on photonic physics and they are still very
active research subjects in the world [19-21].
In general, the research and fabrication of nano and micro-
photonic materials and devices in recent years in Vietnam has been
achieved many important results. The laboratory for fiber optic
applications and materials belong to Institute of Materials Science
has been successfully fabricated 1D-PhC structure and has
international publications as well as a number of PhDs successfully
defended their thesis about this research content including
experimental fabrication and related applications [22,23]; the
photonic sensors based on wavelength selection in 1D-PhC structure
fabricated from porous silicon multi-layer membranes were initially
3
applied in equipments for measuring biochemical environments
[23,24]; the fiber optic devices with wavelength selection structure
based on FBG have been researched and developed for optical
communication networks and optical sensors [25,26],… With the
3D-PhC structure, the researchers have also successfully fabricated spherical micro-resonant cavity lasers based on Er3+-doped silica- alumina glass emitting 1550 nm region WGM modes for optical
communication and the visible region applied to sensors with rather
strong intensity, ultra-narrow spectrum width and controlled the
number of emission modes from micro-resonant cavity [27,28].
Besides, there are some research works on photonic devices based on
2D-PhC by simulation have achieved very positive results [29-32]
and opened up new research directions on photonic devices,
including optical amplification by experimental method combined
with simulation calculation.
On the basis of the PhC research results, coupling the micro-
resonant cavity with the PhC structure for laser emission is necessary
direction to demonstrate high orientation in integrated photonic
devices fabricated technology. To continue developing the research
direction of nano and micro-meter photonic structure, towards the
application in optical communication and sensors, we choose the
thesis topic with title: “Investigation of lasing emission effect and
optical amplification in the cavity conjuncted with 1D, 2D photonic
crystal structures”.
2. The objectives of the thesis
- Research, fabricate Er3+-doped silica glass microspheres with
different sizes by arc discharge method; building an experimental
system to investigate WGM mode laser emission spectrum in the
4
optical communication wavelength region ~ 1550 nm of some
fabricated microspheres.
- Design and simulation of integrated structure of silica glass
microsphere with 2D-PhC waveguide based on SOI material to study
on WGM mode laser emission effect in the optical communication
wavelength region ~ 1550 nm.
- Design and construct a sensor system for refractive index
measurement of some liquids using the FBGs that are integrated into
the fiber ring laser configuration without using spectrometer.
Research method
The thesis uses both simulated and experimental calculation
methods. The simulated calculation method was used to determine
PBG, waveguided mode, guided-mode resonance, WGM mode and
field distribution in the structure of PhC. The experimental method
was used to fabricate microspheres, FBG, design and construct laser emission spectrometry system of Er3+-doped silica microspheres
coupled with pump source and receiver by the single-mode optical
tapered fibers, design and construct liquid sensor system based on
FBG integrated in fiber ring laser configuration.
3. The main contents of the thesis:
- Overview of photonic crystal and its application in research on
laser fabrication.
- The research methods.
- Calculate and simulate some optical devices using two-
dimensional photonic crystal structure.
- Study on laser emission effect of microspheres based on Er3+-
doped silica glass, photonic devices and its application. Thesis layout
5
The thesis includes the introduction, four chapters of content
and the general conclusion. The main contents of the thesis is
presented in four chapters. The first chapter presents the concepts,
research situation of PhC structure and its application. The second
chapter introduces the research methods, including theoretical
models of the waveguide - resonator coupling, simulated calculation
and experiment. The third chapter presents the results of calculation
and simulation of some optical devices using 2D-PhC structure. The
fourth chapter presents the results of the emission of microspherical lasers on Er3+-doped silica glass, simulation of the integrated structure of Er3+-doped silica microsphere with 2D-PhC waveguide
and some test results of liquid refractive index measurement using
PBG elements integrated in fiber ring laser configuration.
CHAPTER 1. OVERVIEW OF PHOTONIC CRYSTAL AND
ITS APPLICATION IN RESEARCH ON LASER
FABRICATION
- Introduction to the photonic crystal structure.
- Presenting features of 2D-PhC such as photonic band gap,
waveguided and wave confinement, guided-mode resonance.
- Presentation of the optical processes in spherical micro-
resonance cavities: WGM mode of dielectric microspheres, equations
of state for modes and microsphere - waveguide coupling methods.
- Apply the 1D-PhC structure in fiber optic (FBG) to developing
optical sensor.
CHAPTER 2. THE RESEARCH METHODS
2.1. The theoretical models of the resonator-waveguide coupling
2.1.1. The theory of resonator - waveguide coupling
Mode coupling method has been applied to many physical
6
systems to process the resonant modes or propagating modes. We
can choose a simple LC circuit to illustrate the significance of the
related physical parameters [94].
- If the loss is small, then:
(2.10) da/dt = joa – (1/o)a
where a, 1/o are the mode amplitude and the decay rate due to
the loss, respectively.
- When the resonator is coupled to an external waveguide, due
to escaping into the waveguide, equation (2.10) must be modified:
(2.15) da/dt = joa – (1/o + 1/e)a
where 1/e expresses the additional rate of decay due to escaping
power.
- In case, the waveguide carries a wave traveling toward the
resonator of amplitude s+ due to a source, there will be a coupling of
waveguide and resonator so (2.15) must be written:
(2.19) da/dt = joa – (1/o + 1/e)a + ks+
where k is a coefficient expressing the degree of coupling
between the resonator and the wave s+. We normalize s+ so that 2s = power carried by incident wave; here s+ to designate a wave incident upon the resonator; the reflected wave will be denoted by s-,
respectively.
- If the source is at frequency , then the response is at the same
frequency, from (2.19), that:
ja = joa – (1/o + 1/e)a + ks+
2 /
k
(2.20) from then a = ks+ /[j(-o) + (1/o + 1/e)]
The relationship between k và e are given by:
(2.28)
e From (2.19), we have:
7
e s+
(2.29) da/dt = joa – (1/o + 1/e)a + 2 /
(2.29) is the equation describing excitation of the resonator
mode by an incident wave.
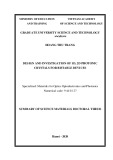
2.1.2. The coupling of a micro-resonator - two waveguides
The simple model is shown in Figure 2.4.
U, o are the amplitude and frequency of the resonator mode
excited in the resonator, respectively. The resonator mode couples to
two waveguides () and () and obeys the equation [96]:
e a4 (2.30)
e a1 + 2 /
dU/dt=joU–(1/e +1/e +1/o)U + 2 /
2
where a1 and a4 are the incident waves in the two waveguides,
2 1a and
4a
normalized so that
the two waveguides; 1/
e and 1/ the
the micro-resonator with are equal to the incident power in e are the coupling ratios between two waveguides () and (),
respectively; 1/0 is the decay rate due to the loss (radiation and other
losses combined). The resonant mode U couples back into the
2 /
e
2 /
outgoing waves in the waveguides in the clockwises direction:
b 2 b 3
a 1 a 4
e
U U
Figure 2.4. Coupled-mode model of resonator with two waveguides 2.1.3. The coupling of the micro-resonator - waveguide when
(2.31) (2.32)
considering backscattering
The coupling between a waveguide and a micro-resonant cavity
8
Figure 2.5. Schematic of the coupling of a micro-resonator with a waveguide when considering backscattering
when considering backscattering can be illustrated in Figure 2.5.
The equations of motion for counter-propagating modes (CCW
and CW) that are coupled to one another as well as to a waveguide
mode can be described by the couple-mode equations similar to those
presented in [96,97]:
dacw/dt = j.acw - (1/2)(1/e + 1/o)acw + (j/2)accw + k.s (2.33)
(2.34) daccw/dt = j.accw - (1/2)(1/e + 1/o)accw + (j/2)acw
here acw and accw are the amplitude of the clockwise and
counterclockwise modes of the resonator, respectively; s denotes the
input wave, which is selected to excite the CW mode; the scattering
rate 1/ describers the mutual coupling of the CW and CCW mode.
2.2. The simulation calculation method
2.2.1. The finite-difference time-domain method (FDTD)
FDTD is a method of directly solving the system of Maxwell
equations in the time-domain [117,118]. The relationship between
the time steps of the FDTD method is as follows: at any point in
space, the next value of the electric field E
over time depends on the
and the numerical rota of the
value of the previous electric field E local distribution of the magnetic field H
in space [117]. Similarly,
for the time-step progression of the magnetic H
.
K. Yee proposed the “leap-frog” leap-frogging scheme for the
9
and H
progression over time of E and H
for E
. The computational processes
calculation is as follows: are illustrated by the flowchart in Figure 2.7. The relationship of E
and H - Calculate the components of E
n t .
at a point in space at the time
- Calculate the components of H
n
1/ 2
. t
at that point at the next
moment
and H
Figure 2.7. Flowchart illustrating the E calculation procedures at different times in space
With the “leap-frog” algorithm proposed by K. Yee, the E-field
value in the space at the specified time is calculated according to the
previous electric field value and its four adjacent magnetic field
values. The same goes for calculating the value of the magnetic field.
2.2.2. The plane wave expansion methode (PWE)
The PWE method has simple manipulation; it is used in the
studies of PhC structure [121-123]. The PWE method allows solving
the complete wave vector equation of the electromagnetic field,
calculates eigenfrequency with standard accuracy and suitable
timing, It can be used to calculate the energy band structure of the
PhC structure, the transmission spectrum [121,124,125],…
2.2.3. The Boundary conditions and convergence of the algorithm
There are many different boundary conditions, but the two basic
10
types mentioned are Bloch periodic boundaries and perfectly
matched layers PML.
The periodic boundary conditions are useful in periodic
systems. For periodic boundaries, in a cell of size L, the field
f(x + L)= f(x) . To simulate open boundary
components satisfy
conditions, we need the boundaries to absorb all the waves towards
them without reflection. This is done by the PML.
2.3. Fabrication method for silica glass microspheres and FBG
2.3.1. Fabrication of microspheres by arc discharge method
The silica and Er3+-doped silica microspheres have been
fabricated by us by the arc discharge method on standard telecom fiber and Er3+-doped fiber according to the process:
- Peel off the coating at the start of the fiber-optic to a length of
1.0 cm.
- Using HF solution to chemically etch peeled optical fiber head
with a length of 0.4 cm.
- Arc discharge at the start of the optical fiber has been etched.
Figure 2.9. Diagram of fabrication principle of FBG by interfering mirror system
2.3.2. Fabrication of FBG using photolithography technique
In this thesis, we present only method to fabricated FBG by
interferometer system; this is method that we used to make FBG. The
11
wavelength of the UV beam we used is UV = 248 nm and the optical fiber with the SiO2 core is highly doped with GeO2 photosensitive
material (14% to 20%). When illuminating UV beam at a certain
location of the optical fiber, the structure of GeO2 there is broken.
The region that receives high UV intensity, the refractive index
increases; the region that receives low UV intensity, the refractive
index remains; on that basis, we obtained the FBG structure.
Diagram of fabrication principle of FBG is illustrated in Figure 2.9.
2.4. Some experimental configurations to survey laser emission
spectra
This section presents experimental configurations to survey laser emission spectra based on the coupling of Er3+-doped silica microsphere with the tapered fibers and fiber laser configuration of
the liquid sensor system using e-FPG.
2.5. Scanning Electron Microscope (SEM)
This section presents the meaning of the SEM method and the
general operating principle of the SEM machines.
CHAPTER 3. CALCULATE AND SIMULATE SOME THE
OPTICAL DEVICES USING 2D-PhC STRUCTURE
3.1. The photonic band gap of 2D-PhC slab structure
The structure of the 2D-PhC waveguide is modelled as shown in
Figure 3.1: 2D-PhC triangular lattice structure with lattice constant a
of air holes of radius r, depth h =220 nm is designed on the dielectric
background Si with thickness d = 220 nm and refractive index
n1 = 3.48; this lattice is placed on SiO2 substrate with refractive
index n2 = 1.44. The PBG simulation was performed using 3D-PWE
method, PML boundary conditions are placed above and below the
slab (parallel to the structural surface), Bloch periodic boundary
12
conditions are applied according to the periodic directions of the
Figure 3.1. The triangular lattice structure of the 2D-PhC slab with lattice constant a of cylindrical air holes of radius r, depth h is designed on the dielectric background Si with thickness d = h = 220 nm
structure, the resolution to perform the simulation is 10 nm.
In the case of a = 400 nm, r = 100 nm, the result is shown in
Figure 3.2. Photonic band structure for the 2D-PhC slab even mode
Figure 3.2.
Figure 3.2 shows the existence of a complete PBG with even
mode and wavelengths in the range from 1369 nm to 1607 nm
/ 2
a
)
and c
0, 2489(
/ 2
a
c
)
. The selected structure has PBG containing
corresponding to normalized frequencies 0, 2922(
wavelengths 1470nm and 1550nm, that means this structure can be
used to fabricate waveguide channels with wavelengths 1470nm and
1550nm.
13
3.2. Waveguide in plane using 2D-PhC slab structure
Using 2D-PhC slab structure in Figure 3.1 with the selected
parameters: a = 400 nm, h = d = 220 nm, r = 100 nm. The PML
boundary condition was used and placed around the structure, the
resolution to perform the simulation is 10 nm. The source is placed at
the input waveguide and behind PML layer, the receiver is placed
around the structure and in the PML layer. 3.2.1. W1 waveguide and field distribution in waveguide
W1 waveguides are created by filling a row of air holes of the
structure as shown in Figure 3.1. To extend the band [132], we
reduce the radius of two adjacent rows of air holes with waveguide
Figure 3.7. Dispersion diagram and electric field distribution of the Ey component in the waveguide at wavelength = 1550 nm
W1 from r = 100 nm to r1 = 95 nm.
By using 3D-PWE method, we get the dispersion diagram, the
electric field distribution of the Ey component in the structure at wavelength = 1550 nm as shown in Figure 3.7. The simulation results show that the selected 2D-PhC structure that conduct wave is
good with wavelength = 1550 nm.
3.2.2. Slotted waveguide and field distribution in waveguide
The model of the slotted 2D-PhC waveguide structure is shown
in Figure 3.8.
The dispersion diagram, the electric field distribution in the
14
structure corresponding to wavelengths = 1470 nm, = 1550 nm
and the refractive index distribution of the structure was simulated by
the 3D-PWE method. Simulation results for the case w = 165 nm,
W = 1.18 W1 and w = 125 nm, W = 1.25 W1 are shown in Figure 3.9
and Figure 3.10, respectively. The results showed that the 2D-PhC
with the selected parameters has good wave conductivity with
Figure 3.8. Slotted 2D-PhC waveguide structure of triangular lattice
Figure 3.9. Dispersion diagram, E-field distribution of the Ey component in the waveguide at = 1470 nm and refractive index distribution of the structure
Figure 3.10. Dispersion diagram, E-field distribution of the Ey component in the waveguide at = 1550 nm and refractive index distribution of the structure
= 1470 nm and 1550 nm.
15
3.3. The optical wave filter based on GMR effect
To test and evaluate the wavelength selection of the 2D-PhC
slab structure, we perform the investigation, calculation and
simulation of the optical wave filters using 2D-PhC slab based on the
GMR effect. The characteristics parameters for filter such as
resonance wavelength 0, quality factor Q… are determined
indirectly through using characteristics expression of the Fano
spectrum. The simulation results for GMR spectra, field distributions
is given by a single lattice structure and two types of dual lattice
structures are presented in detail in this section.
CHAPTER 4. LASER EMISSION OF MICROSPHERE BASED ON Er3+-DOPED SILICA, PHOTONIC DEVICE AND ITS APPLICATION
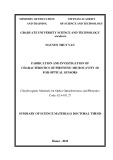
4.1. Fabrication results of Er3+-doped silica microsphere
Figure 4.3. SEM images of Er3+-doped silica glass microsphere
Figure 4.3 shows SEM images of some Er3+-doped silica glass
microspheres that we fabricated by arc discharged method. 4.2. Emission spectrum of Er3+-doped silica microsphere laser
The emission spectrum of Er3+-doped silica microsphere laser
with diameter ∼ 29.7 μm obtained from experiment with a number of
different coupling gaps according to two configurations CW and
CCW are shown in Figure 4.12-4.14.
16
Figure 4.12. WGM mode emission spectra extracted from Er3+-doped silica microsphere: coupling gap 1.5 0.1 m according to CW configuration
Figure 4.13. WGM mode emission spectra extracted from Er3+-doped silica microsphere: coupling gap 1.5 0.1 m according to CCW configuration
Figure 4.14. WGM mode emission spectra depends on the coupling gap according to the CW configuration
4.3. Simulate the WGM mode of silica microspheres 4.3.1. WGM mode of microsphere with diameter of 38.5 m
This section presents some simulation results of WGM mode of
17
silica microsphere with diameter of 38.5 m on the equatorial plane
of the microsphere.
4.3.2. WGM mode of microsphere with diameter of 29.7 m
Figure 4.16 shows some simulation results of WGM mode of
silica microsphere with diameter of 29.7 m on the equatorial plane
of the microsphere.
Figure 4.16. Reflection spectrum on the surface of the microsphere (a), E-field magnitude distribution of WGM mode at = 1551.53 nm with TM mode (b), field distribution of the EZ component at = 1551.53 nm with TM mode (c) and HZ component at = 1550.82 nm with TE mode (d) 4.3.3. Calculate quantum mode numbers using numerical method
Table 4.1 presents the results about sets of values (l, n) that
characterize WGM modes distributed on the equatorial plane of two
silica microspheres is calculated by numerical method using
approximate expressions from (1.40) to (1.44) [87] and 3D-FDTD
simulation method.
18
The Table 4.1 shows that there is a good suitability between one
of quantum value sets (l, n) when calculating numerically with set of
Table 4.1. Sets of values (l, n) are calculated using two different methods
Polarization
Numerical method
3D-FDTD simulation
Resonance wavelength (nm)
Diameter of S (m)
38.5
TM
1550.74
(80, 6)
38.5
TE
1549.01
(85, 5)
29.7
TM
1551.53
(64, 4)
29.7
TE
1550.82
(66, 4)
(104, 1), (98, 2), (92, 3) (88, 4), (84, 5), (80, 6) (105, 1), (99, 2), (93, 3) (88, 4), (84, 5), (80, 6) (79, 1), (73, 2), (68, 3) (64, 4), (61, 5) (80, 1), (74, 2), (69, 3) (65, 4), (61,5)
values (l, n) is determined by 3D-FDFD simulation method.
4.4. Integrated photonic device based on the coupling of the
microsphere with the SOI slotted 2D-PhC waveguides
Figure 4.17. Schematic diagram of the intergration of the Er3+-doped silica microsphere and the two SOI slotted PhC waveguides
4.4.1. Design proposal
The integrated structure consists of two SOI slotted PhC
19
waveguides coupled with microsphere of 29.7 m in diameter is
shown in Figure 4.17. The 2D-PhC waveguide slab is a triangle
lattice of cylindrical air holes with lattice constant of a = 400 nm,
radius of r = 100 nm, depth of h =220 nm is designed on the
dielectric background Si with thickness of d = 220 nm, refractive
index of n1 = 3.48. This lattice is placed on SiO2 substrate with
refractive index of n2 = 1.44. The waveguide width and the air slot width of input waveguide and output waveguide are W = 1.18 W1, w = 165 nm and W’ = 1.25, W1 w’ = 125 nm, respectively.
In order to maintain the WGM modes in the Er3+-doped silica
microsphere, an air ring width of 0.9 m has shown to be suitable
and the corresponding geometry structure is presented in Figure 4.17.
By using 3D-PWE method, we get the dispersion diagram and
the electric field distributions of the Ey components with TE mode in
the input waveguide and output waveguide at = 1470 nm and
1550.84 nm as shown in Figure 4.18, respectively. The simulation
results show that the 2D-PhC waveguide structure with selected
parameters that conduct wave is good with wavelength = 1470 nm
Figure 4.18. Dispersion diagram and E-field distributions of the Ey components in two waveguides at = 1470 nm and 1550.84 nm
and 1550.84 nm.
20
4.4.2. Simulate the characteristic spectrum of integrated photonic
device
Using 3D-PWE and 3D-FDTD methods with PML boundary
conditions are placed around the structure. The WGM mode
emissions excitation sources are TE polarized electric dipoles with
wavelength in the range 1400 - 1600 nm are placed inside and near
the microsphere surface, the selected mesh size for simulation is 10
nm; the Bloch mode source is placed at the input waveguide and
behind PML. The simulation results are shown in figure 4.19. The
results showed that this integrated system is capable of coupling the
Figure 4.19. Refractive index distribution of the integrated structure based on the coupling of the microsphere with diameter of 29.7 m with the two SOI slotted 2D- PhC waveguides (a) and E-field distributions in the integrated structure (b,c)
Bloch mode of the waveguided with the WGM mode of microsphere.
21
4.5. The sensor element based on FBG
4.5.1. The sensor equipment uses two FBGs that are integrated into
the ring laser configuration
The principle schematic of the sensor equipment measuring the
liquid refractive index that we have built is shown in figure 4.20.
When the laser emission mode is selected by re-FBG and the Bragg
reflection wavelength of e-FBG placed in the measuring medium are
coincided (re-B = e-B), maximum resonance in the fiber ring laser
resonance cavity will occur and photoelectrical signal obtained from
Figure 4.20. The principle diagram of the sensor system 4.5.2. Procedure for measuring the refractive index of the solution
photodiode with maximum value.
- The first step: Construct a wavelength B - temperature
calibration curve for re-FBG.
- The second step: Construct a wavelength B - refractive index
calibration curve for e-FBG based on using standard solutions.
- The third step: Place the e-FBG sensor probe in the solution
whose refractive index is to be determined, change the imposed
temperature on the re-FBG, measure the optical power obtained from
the photodiode then plot the optical power - temperature curve.
22
- The fourth step: Determine the imposed temperature on the re-
FBG corresponding to the maximum value of optical power.
- The fifth step: Based on the reflection wavelength-temperature
calibration curve that has constructed for re-FBG to determine the
reflection wavelength value corresponding to the temperature found
in fourth step.
- The sixth step: From reflection wavelength received in fifth
step, based on the reflection wavelength - refractive index calibration
curve has constructed for e-FBG, we will determine the refractive
index of the solution to be measured.
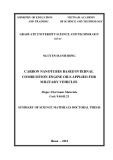
4.5.3. Some experimental results
Figure 4.26 displays the experimental results to detect the
gasoline RON 92 mixed with Ethanol or Methanol in range of
concentration 0% - 14% v/v. The sensitivity of sensor obtained
45 nm/RIU. The limit of detection of measurement is calculated by LOD = /QS [145] and achieved value of 1.5 x 10⁻⁴ RIU (S is
sensitive of sensor, is wavelength of sensor signal and Q is quality
Figure 4.26. Bragg wavelength shift of e-FBG according to the concentration of Ethanol and Methanol in gasoline RON 92
factor of laser mode.
23
Figure 4.27 presents the experimental result to detect Nitrate in
range of concentration 0 - 50 ppm. The limit of detection of the
measurement is evaluated 4.5 ppm, this limit is close to value that
sensor system received by optical spectrum analyzer with high
Figure 4.27. Sự dịch chuyển bước sóng Bragg của e-FBG theo nồng độ Nitrat trong môi trường nước CONCLUSION
resolution [25].
Some main results that the thesis has achieved:
1. Calculated and simulated some optical devices such as waveguide,
optical wave filter using 2D-PhC slab structure by FDTD and PWE
methods. 2. Fabricated some Er3+-doped silica microsphere with diameter of 30 m 60 m by arc discharged method. Designed and
constructed successfully the experimental system to survey the WGM mode laser emission effect of Er3+-doped silica microsphere, simulated and solved the numerical for quantum value sets that
characterize the WGM modes of the fabricated microspheres. The
experimental results and simulation are performed on two
microspheres with diameter of 38.5 m and 29.7 m show that
these microspheres are capable of WGM mode emission in the
24
optical communication region 1550 nm.
3. The integrated structure consists of two SOI slotted PhC
waveguides coupled with microsphere of 29.7 m in diameter was
designed and simulated the WGM emission modes.
The simulation results show that the integrated structure with the
selected parameters is capable of the WGM mode laser emission in
the optical communication region 1550 nm when using a single
mode pump laser source with 1470 nm.
4. Successfully constructed the optical fiber sensor system based on
fiber ring laser combined with two FBG elements that allows to
measure the refractive index of some solutions without using
spectrometers. The obtained results show the prospect of the using a
novel low-cost optical sensor system without using spectrometers for
various applications such as in agriculture, industrial fluids, food,
medical, pharmaceutical industries, environmental controlling
systems and monitoring the quality of drinking water,…
NOVEL CONTRIBUTIONS OF THESIS
- Successfully fabricated the Er3+-doped silica microspheres with desired size and quality and obtained the WGM mode laser emission spectra of the Er3+-doped silica microsphere by experiment.
- Successfully simulated and designed the integrated structure based on the coupling of the Er3+-doped silica microsphere with the
SOI slotted 2D-PhC waveguides.
- Successfully designed and constructed the optical fiber sensor
system based on using two FBG elements that are integrated into the
fiber ring laser configuration that allows to measure the refractive
index of some solutions without using spectrometers.
25
LIST OF WORKS HAS BEEN PUBLISHED LIST OF PUBLICATIONS USED FOR THE THESIS
in Er3+-doped
lasers integration towards
1. Van An Nguyen, Van Dai Pham, Thi Hong Cam Hoang, Huu Thang Le, Thu Trang Hoang, Quang Minh Ngo, Van Hoi Pham, A quantitative analysis of the whispering-gallery-mode lasers in Er3+- doped silica glass microspheres towards integration in SOI slotted photonic crystal waveguides, Opt. Comm., 2019, 440, 14-20. 2. Van An Nguyen, Quang Minh Ngo, and Khai Quang Le, Efficient Color Filters Based on Fano-Like Guided-Mode Resonances in Photonic Crystal Slabs, IEEE Photonics Journal, 2018, 10 (1), 2700208. 3. H Bui, T B Pham, V A Nguyen, V D Pham, T C Do, T V Nguyen, T H C Hoang, H T Le and V H Pham, Novel method of dual fiber Bragg gratings integrated in fiber ring laser for bio-chemical sensors, Meas. Sci. Technol., 2018, 29, 055105. 4. Nguyễn Văn Ân, Ngô Quang Minh, Nâng cao hệ số phẩm chất của bộ lọc phổ cộng hưởng Fano vùng khả kiến dựa trên sự giao thoa các mode dẫn sóng lệch pha trong phiến tinh thể quang tử 2D, Sci. Technol. Develop. Journal: Nat. Sci., 2018, 2 (4), 136-145. 5. Pham Van Hoi, Nguyen The Anh, Nguyen Thi Thu Trang, Le Huu Thang, Nguyen Van An, Enhancement of lasing emission in the metallic-coated microsphere cavity based on Er-doped silica glasses, Comm. in Phys., 2015, 25 (3), 195-201. 6. Van An Nguyen, Van Dai Pham, Thanh Binh Pham, Thu Trang Hoang, Thi Hong Cam Hoang, Quang Minh Ngo and Van Hoi Pham, Whispering-gallery-mode silica glass in SOI photonic crystal microspheres waveguides, Proc. of the 9th - IWAMSN2018, 2019, 269-275. 7. Nguyễn Văn Ân, Ngô Quang Minh, Phạm Văn Hội, Bộ lọc sóng quang học vùng khả kiến phẩm chất cao trên cơ sở giao thoa
26
của hai sóng lệch pha trong phiến tinh thể quang tử hai chiều, ICPA- 10, 2019, 121-126. 8. Nguyễn Văn Ân, Phạm Văn Đại, Hoàng Thị Hồng Cẩm, Phạm Thanh Bình, Ngô Quang Minh, Phạm Văn Hội, Nghiên cứu, chế tạo các hạt vi cầu định hướng kết hợp với cấu trúc tinh thể quang tử dẫn sóng 2D, CAEP V, 2018, 157-163. 9. Nguyễn Văn Ân, Ngô Quang Minh, Phạm Văn Hội, Nghiên cứu cộng hưởng dẫn sóng dạng Fano trong vùng ánh sáng đỏ sử dụng cấu trúc tinh thể quang tử hai chiều, ICPA-9, 2017, 215-218. 10. Phạm Thanh Bình, Phạm Văn Hội, Bùi Huy, Phùng Thị Hà, Nguyễn Văn Thịnh, Lê Hữu Thắng, Nguyễn Văn Ân, Ngô Quang Minh, Phạm Văn Đại, Thiết bị và phương pháp đo chiết suất của chất lỏng bằng đầu dò cách tử Bragg trong sợi quang được ăn mòn (E-FBG) tích hợp trong cấu hình laze cộng hưởng vòng, Sáng chế số: 20134, cấp theo QĐ số: 78881/QĐ-SHTT, ngày: 06/11/2018. LIST OF PUBLICATIONS RELATED TO THE THESIS 1. Pham Van Hoi, Nguyen Thuy Van, Pham Van Dai, Bui Huy, Le Huu Thang, Nguyen Van An and Pham Thanh Binh, Wavelength Shift Measurement Method Without Spectrometer: The New Way for Environment Photonic Sensors, Comm. in Phys., 2018, 28 (2), 139. 2. Van An Nguyen, Thanh Binh Pham, Thi Ha Phung, Thuy Chi Do, Duc Binh Nguyen, Huy Bui, Quang Minh Ngo, and Van Hoi Pham, Spectral characterization of etched-Bragg Grating sensing probe integrated in fiber laser structure for determination of the low Nitrate concentration in water, ICPA-9, 2017, 414-418. 3. Thanh Binh Pham, Van Thinh Nguyen, Huy Bui, Van An Nguyen, Quang Minh Ngo, and Van Hoi Pham, High sensitivity etched-fiber Bragg grating sensor for determination of organic content mixtured in gasoline, Proc. of the ESASGD 2016, Session: Integrated Petroleum Engineering (IPE), 2016, 122-128.