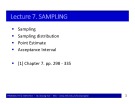
Lecture 7. SAMPLING Lecture 7. SAMPLING
Sampling Sampling distribution Point Estimate Acceptance Interval
PROBABILITY & STATISTICS – Bui Duong Hai – NEU – www.mfe.edu.vn/buiduonghai
1
[1] Chapter 7. pp. 298 - 335
Inferential Statistics Inferential Statistics
Inferential Statistics: Deduce information of
Population from Sample data.
Population size: �, � = (��, ��, … , ��) Parameters:
PROBABILITY & STATISTICS – Bui Duong Hai – NEU – www.mfe.edu.vn/buiduonghai
2
� Population Mean Population proportion � �� Proportion variance
Example Example
8 5 7 7 6 2 5 8
Population: 6 4 Parameter: � = 5.8 �� = 3.16 �
= 0.4 Proportion of “odd value” � =
��
Sample 1: 4
�
= 0.33 5 8 � = 4.33, �̅� = �̅� = 5.67, ��
�
Sample 2: 8 7 8
�
= 0 �̅� = 6 � = 0.917, �̅� = 7.25, ��
�
PROBABILITY & STATISTICS – Bui Duong Hai – NEU – www.mfe.edu.vn/buiduonghai
3
7.1. Random Sample 7.1. Random Sample
PROBABILITY & STATISTICS – Bui Duong Hai – NEU – www.mfe.edu.vn/buiduonghai
4
Population data: from census Exactly Maybe impossible Difficult to gather Costly, much time Sample data: from surveys Possilbe to gather Easier than census Less cost and time
Random Sample Random Sample
Random Sample: Sample drawn from population that every elements are selected with equal probability, and independently.
PROBABILITY & STATISTICS – Bui Duong Hai – NEU – www.mfe.edu.vn/buiduonghai
5
For random sample � �� = ⋯ = � �� = � � �� = ⋯ = � �� = ��
Sampling Method Sampling Method
PROBABILITY & STATISTICS – Bui Duong Hai – NEU – www.mfe.edu.vn/buiduonghai
6
Stratified sampling Cluster sampling Systematic sampling Convenience sampling Judgment sampling [1] p.331
7.2. Sampling Distribution 7.2. Sampling Distribution
A sampling distribution is a distribution of all of the possible values of a statistic for a given sample selected from a population
Distribution of Sample Mean
Distribution of Sample Proportion
PROBABILITY & STATISTICS – Bui Duong Hai – NEU – www.mfe.edu.vn/buiduonghai
7
Distribution of Sample Variance
Distribution of Sample Mean Distribution of Sample Mean
Sample Mean (Random Sample)
�̅=
∑�� �
� =
�
= Standard Error (S.E) �̅is random variable � �̅ = ��̅= � �� � �̅ = ��̅ � ��̅=
�
Sample mean has same expectation with �, but
PROBABILITY & STATISTICS – Bui Duong Hai – NEU – www.mfe.edu.vn/buiduonghai
8
smaller variance.
Correction Factor Correction Factor
In case of large sample or finite population, n is
relatively large in comparison to N
���
The correction factor is
���
���
� �̅ = ×
��� ���
�� � �
× ��̅=
���
�
PROBABILITY & STATISTICS – Bui Duong Hai – NEU – www.mfe.edu.vn/buiduonghai
9
In lectures: sample is not large
Normal Distribution Normal Distribution
If Population is Normal distributed: �~�(�, ��) or
Non-normal distributed but � > 30 then:
�) �̅~�(��̅, ��̅
�̅~� �,
�� �
PROBABILITY & STATISTICS – Bui Duong Hai – NEU – www.mfe.edu.vn/buiduonghai
10
Ex. Population �~�(20,4�) Sample � = 16 �̅~� 20, 1�
Example Example
Example 7.1. Workers’ salary is Normal distributed with Mean of 300 $ and Standard deviation of 20 $. (a) What is the probability that salary of a worker chosen
randomly exceeds 305?
(b) Random choose 10 workers, what is the probability
that sample mean exceeds 305?
(c) What is the probability that sample mean of 100
workers exceeds 305?
(d) With the probability of 0.67, what is the maximum of
sample mean of 10 workers?
(e) With the probability of 0.67, what is the maximum of
PROBABILITY & STATISTICS – Bui Duong Hai – NEU – www.mfe.edu.vn/buiduonghai
11
sample mean of 100 workers?
Distribution of Sample Proportion Distribution of Sample Proportion
Population Proportion = Probability = � Sample proportion = �̅
�(���)
� �̅ = � ; � �̅ =
�
With � ≥ 100
�̅~� �,
� 1 − � �
PROBABILITY & STATISTICS – Bui Duong Hai – NEU – www.mfe.edu.vn/buiduonghai
12
Example 7.2. Probability that candidate pass the exam is 0.4. Find the probability that proportion of pass in 200 candidate is greater than 45%
7.3. Acceptance Interval 7.3. Acceptance Interval
PROBABILITY & STATISTICS – Bui Duong Hai – NEU – www.mfe.edu.vn/buiduonghai
13
Assume that Population is known Parameter �, �, �� are known Deduce for statistics in sample With probability of 95%, 90%, or (1 − �)
Sample mean Sample mean
With probability of 95%
� −1.96 < � < 1.96 = 0.95
� −1.96 < < 1.96 = 0.95
�̅− � �/ �
< �̅< � + 1.96 � − 1.96
Acceptance interval 95% of sample mean � � � �
�
Or: � ± 1.96
�
PROBABILITY & STATISTICS – Bui Duong Hai – NEU – www.mfe.edu.vn/buiduonghai
14
Sample mean Sample mean
In general, probability of 1 − � The acceptance interval for sample mean: �
�
� − ��/� < �� < � + ��/�
�
�
�
or � ± ��/�
�
PROBABILITY & STATISTICS – Bui Duong Hai – NEU – www.mfe.edu.vn/buiduonghai
15
Example 7.3. Worker income ($) is normal distribution with mean of 300 and variance of 400. What is the interval that average income of 25 workers falls into, with probability of 95%, 90%, 80% ?
Sample Proportion Sample Proportion
If population parameter � is known � is population proportion or probability Acceptance interval of sample proportion �̅
� − ��/� < �� < � + ��/�
�(� − �) � �(� − �) �
Or
� ± ��/�
PROBABILITY & STATISTICS – Bui Duong Hai – NEU – www.mfe.edu.vn/buiduonghai
16
�(� − �) �
Sample Proportion Sample Proportion
Example 7.4. Probability that a visitor buying at least one item in the shopping mall is 0.3. (a) Find the probability that in 200 visitors, there are at
least 65 customers.
(b) At probability level of 95%, in 200 visitors, what are
PROBABILITY & STATISTICS – Bui Duong Hai – NEU – www.mfe.edu.vn/buiduonghai
17
acceptance interval of relative frequency of number of buyers, and acceptance interval of number of buyers?
Key Concepts Key Concepts
Random Sample Sampling Distribution Acceptance Interval
Exercise Exercise
PROBABILITY & STATISTICS – Bui Duong Hai – NEU – www.mfe.edu.vn/buiduonghai
18
[1] Chapter 7 (309) 13, 16, (320) 21, 27, 29 (326) 37, 38

