
RESEARC H Open Access
Expression of MICA, MICB and NKG2D in human
leukemic myelomonocytic and cervical cancer cells
Benny Weiss-Steider, Isabel Soto-Cruz, Christian A Martinez-Campos and Jorge Flavio Mendoza-Rincon
*
Abstract
Background: Cancer cells are known to secrete the stress molecules MICA and MICB that activate cytotoxicity by
lymphocytes and NK cells through their NKG2D receptor as a mechanism of immunological defense. This work was
undertaken to evaluate if cancer cells can also express this receptor as a possible mechanisms of depletion of MIC
molecules and thus interfere with their immune recognition.
Methods: Myelomonocytic leukemic (TPH-1 and U-937) and cervical cancer (CALO and INBL) cell lines were
evaluated by Western Blot, ELISA, flow cytometry and immunocytochemistry to evaluate their capacity to express
and secrete MICA and MICB and to be induced to proliferate by these molecules as well as to express their
receptor NKG2D. Statistical analysis was performed by two-way ANOVA for time course analysis and Student’s t-test
for comparison between groups. Values were considered significantly different if p < 0.05.
Results: THP-1 and U-937 produce and secrete the stress MICA and MICB as shown by Western Blot of lysed cells
and by ELISA of their conditioned media. By Western Blot and flow cytometry we found that these cells also
express the receptor NKG2D. When THP-1 and U-937 were cultured with recombinant MICA and MICB they
exhibited a dose dependent induction for their proliferation. CALO and INBL also produce MICA and MICB and
were induced to proliferate by these stress molecules. By Western Blot, flow cytometry and immunocytochemistry
we also found that these cells express NKG2D.
Conclusions: Our novel results that tumor cells can simultaneously secrete MIC molecules and express their
receptor, and to be induced for proliferation by these stress molecules, and that tumor epithelial cells can also
express the NKG2D receptor that was thought to be exclusive of NK and cytotoxic lymphocytes is discussed as a
possible mechanism of immunological escape and of tumor growth induction.
Background
NKG2D is a member of the NKG2 family of HLA class I
C-type lectin receptors and is expressed as a homodimer
by NK cells [1,2] and cytotoxic lymphocytes [3,4]. The
ligands for NKG2D include the human class I-like mole-
cules MICA and MICB [5], which are stress-induced
molecules expressed by tumors of epithelial origin [6,7]
and, leukemias [8], as well as by virus-infected cells
[9,10]. The recognition of the MICA and MICB ligands
on tumor cells by the NKG2D receptor, found on NK
cells, induces the cytotoxic activity of NK cells [11] and
the subsequent lysis of their tumor targets [12]. The
secretion of MICA and MICB by cancer cells has been
suggested as a mechanism for tumor cell immune escape
through the saturation of NKG2D receptors on cytotoxic
cells [13,14], thus abrogating their ability to recognize
tumor cells. In fact, high levels of these molecules were
found in the sera of human cancer patients [15], and a
direct correlation was found between increased serum
concentrations of these molecules and tumor stage [16].
It is not known if the secretion of MICA and MICB by
the tumor cells has any effect on the cancer cells them-
selves. This work was undertaken to determine if two
human leukemic myelomonocytic cell lines, THP-1 and
U-937, produce MICA and MICB and express NKG2D,
and if these stress molecules induce cell proliferation. In
order to determine if these properties are shared by other
tumors, we also analyzed the CALO and INBL human
epithelial cervical cancer cell lines.
* Correspondence: jflavio.m@gmail.com
Laboratorio de Oncología Molecular. Unidad de Diferenciación Celular y
Cáncer. FES-Zaragoza, Universidad Nacional Autónoma de México. Ciudad de
México. 09230. Mexico
Weiss-Steider et al.Journal of Experimental & Clinical Cancer Research 2011, 30:37
http://www.jeccr.com/content/30/1/37
© 2011 Weiss-Steider et al; licensee BioMed Central Ltd. This is an Open Access article distributed under the terms of the Creative
Commons Attribution License (http://creativecommons.org/licenses/by/2.0), which permits unrestricted use, distribution, and
reproduction in any medium, provided the original work is properly cited.

Methods
Cells and antibodies
The U-937 and THP-1 cell lines were purchased from
ATCC (American Type Culture Collection), whereas
CALO and INBL were established in our laboratory
[17,18]. The cells were cultured at 37°C with 5% CO
2
in
RPMI-1640 medium (Invitrogen) supplemented with
10% heat-inactivated FCS (Hyclone), 1-mM MEM
sodium pyruvate solution, 2-mM MEM non-essential
amino acids solution (Gibco), 0.1-mM L-glutamine,
100-U/ml penicillin and 100-μg/ml streptomycin
(Gibco). Polyclonal antibody against MICA/MICB and
murine monoclonal anti-MICA, anti-MICB and anti-
NKG2D antibodies were purchased from R&D Systems.
Proliferation assays
U-937 and THP-1, as well as CALO and INBL, cells
were plated at 5 × 10
3
cells per well in 96-well plates.
Cells were treated with different concentrations of either
MICA or MICB for 72 h at 37°C with 5% CO
2
in RPMI-
1640 containing 10% FCS. Proliferation was measured
using the MTT assay (3-[4,5-Dimethylthiazol-2-4]-2,5-
diphanyltetrazolium bromide) (Sigma). Briefly, 5 × 10
3
cells were cultured for 72 h in the presence of 1, 10, or
100 ng recombinant human MICA or MICB protein.
MTT reagent was then added and the plates were read
in a micro-titer plate reader at 570 nm.
Cell lysis and immunoblotting
For immunoprecipitation, 10
7
cells were lysed for
15 min at 4°C in a lysis buffer (50-mM Tris-HCl, pH
7.4, 150-mM NaCl, 5-mM EDTA, 10-mM NaF, 1-mM
sodium orthovanadate, 1-mM phenylmethanesulfonyl
fluoride, 1-μg/ml leupeptin, 1-μg/ml pepstatin, 1-μg/ml
aprotinin and 1% Triton X-100). The insoluble material
was pelleted (15,000 × gfor 15 min) at 4°C.
Total protein content in the lysates was determined
using the Bio-Rad protein assay (Bio-Rad), and 150 μg
of protein was incubated with protein A-agarose beads
(Invitrogen) previously coupled with the corresponding
antibody. The immune complexes were washed five
times with cold washing buffer (50-mM Tris-HCl, pH
7.4, 150-mM NaCl, 5-mM EDTA, 10-mM NaF, 1-mM
sodium orthovanadate, 1-mM phenylmethanesulfonyl
fluoride, 1-μg/ml leupeptin, 1-μg/ml pepstatin, 1-μg/ml
aprotinin and 0.1% Triton X-100) and resolved by SDS-
PAGE (10% acylamide).
To obtain total cell lysates, 10
7
cells were washed once
with ice-cold phosphate-buffered saline (PBS) in a
microfuge tube. Pellets were rapidly resuspended in
40 μL of lysis buffer, incubated for 15 min on ice and
insoluble material was pelleted (15,000 × gfor 15 min)
at 4°C. Forty microliters of 2× Laemmli sample buffer
(120-mM/L Tris, pH 6.8, 2-mM urea, 100-mM/L DTT,
10% glycerol and 0.001% bromophenol blue) were
immediately added while vortexing, and the sample was
boiled for 5 min. Fifty microliters of each sample, along
with molecular weight markers (Bio-Rad), were electro-
phoresed by vertical SDS-PAGE.
The proteins were electroblotted onto nitrocellulose
membranes, and the membranes were blocked overnight
in TBST buffer (10-mM Tris-HCl, pH 7.4, 100-mM
NaCl and 0.5% Tween 20) containing 3% BSA. For pro-
tein immunodetection, the membranes were subjected
to immunoblotting with 1 μg/ml of the appropriate anti-
body for 1.5 h at room temperature followed by HRP-
conjugated anti-mouse or anti-rabbit IgG diluted to
1:6,000 (Zymed) for 30 min at room temperature. The
membranes were then washed five times in TBST and
the bands were visualized using the ECL system, accord-
ing to the manufacturer’s instructions (Pierce).
ELISA assay
For ELISA assays, 5 × 10
4
U-937 and THP-1, as well as
CALO and INBL, cells were plated in 48-well plates for
7 days. The cell culture supernatants were collected
every 24 h and stored at -70°C until use, and ELISA
detection was performed using 100 μL of each superna-
tant. In brief, plates were coated with 100 μLofthe
supernatants from the leukemic myelomonocytic and
cervical cancer cells by incubating at 37°C for 1 h, wash-
ing three times with PBS-Tween (PBST) and blocking
with 120 μL of PBST-3% BSA for 1 h at 37°C. Monoclo-
nal antibodies (1:100 in PBST-3% BSA) were added for
1 h at 37°C. Anti-mouse IgG2a-HRP (1:4000 in PBST-
3% BSA) was added for 1 h at 37°C. Plates were then
washed and developed using 100 μLofABTSsystem
substrate (Zymed). The absorbance was measured at
405 nm.
Immunohistochemical analysis of NKG2D
Immunohistochemical staining for the expression of
NKG2D was completed by standard procedures. In
brief, CALO and INBL cell lines were seeded onto poly-
L-lysine-coated microscopy slides and allowed to grow
for 72 h. Cells were heated in citrate buffer (0.01 mol/L,
pH 6.0) in a microwave oven (85-95°C, 3 times for
5 min each) followed by blocking the nonspecific bind-
ing sites with goat serum. Cells were incubated with the
primary mouse monoclonal anti-NKG2D antibody (R&D
Systems) overnight in a humidified chamber at 4°C. The
samples were then incubated with a polyclonal goat
anti-rabbit HRP-conjugated secondary antibody for
30 min at room temperature. Slides were then processed
with the universal LSAB-2 single reagents (peroxidase)
kit, and the expression of NKG2D was identified by
Weiss-Steider et al.Journal of Experimental & Clinical Cancer Research 2011, 30:37
http://www.jeccr.com/content/30/1/37
Page 2 of 8
enzyme development with diaminobenzidine. As a final
step, the slides were stained with methylene blue coun-
terstaining and dehydrated in graded alcohols. Negative
control slides were processed similarly, except with the
primary antibody omitted, and incubated with an irrele-
vant isotype antibody. Immunohistochemical staining
was examined using a light microscope (Leica D100)
equipped with a digital camera.
Expression of surface NKG2D by flow cytometry
Cell suspensions (0.4 × 10
6
cells/ml) in PBS with 5%
FBS and 0.01% azide were incubated with 10 μg/ml of
the primary murine monoclonal anti-NKG2D antibody
or the respective isotype control for 90 min at 4°C.
After washing the cells with PBS, they were incubated in
the dark for 30 min with 0.45-μg/ml FITC-labeled goat
anti-mouse IgG at 4°C. After washing again, the cells
were fixed for 20 min in 1% paraformaldehyde, followed
by two more washes. The stained cells were analyzed in
a FACScan cytometer (Becton Dickinson).
Isolation of human monocytes
Human monocytes were isolated from peripheral blood
samples of healthy donors by Ficoll-Paque density gradi-
ent centrifugation and plastic adherence purification.
Cell viability was greater than 95%, as assessed by trypan
blue exclusion, and the purity of monocytes was greater
than 93%, as determined by immunofluorescent staining
with anti-CD14 monoclonal antibody (Becton Dickin-
son) and flow cytometric analysis.
Statistical analysis
All data are expressed as the mean ± SD of three repli-
cates, and all experiments were repeated three times,
unless otherwise stated. Statistical analysis was per-
formed by two-way ANOVA for the time course analy-
sis and Student’s t-test for the comparison between
groups. Values were considered significantly different if
p < 0.05.
All reagents were from Sigma Chemical Co., San
Louis, MO, USA, unless otherwise specified.
Results
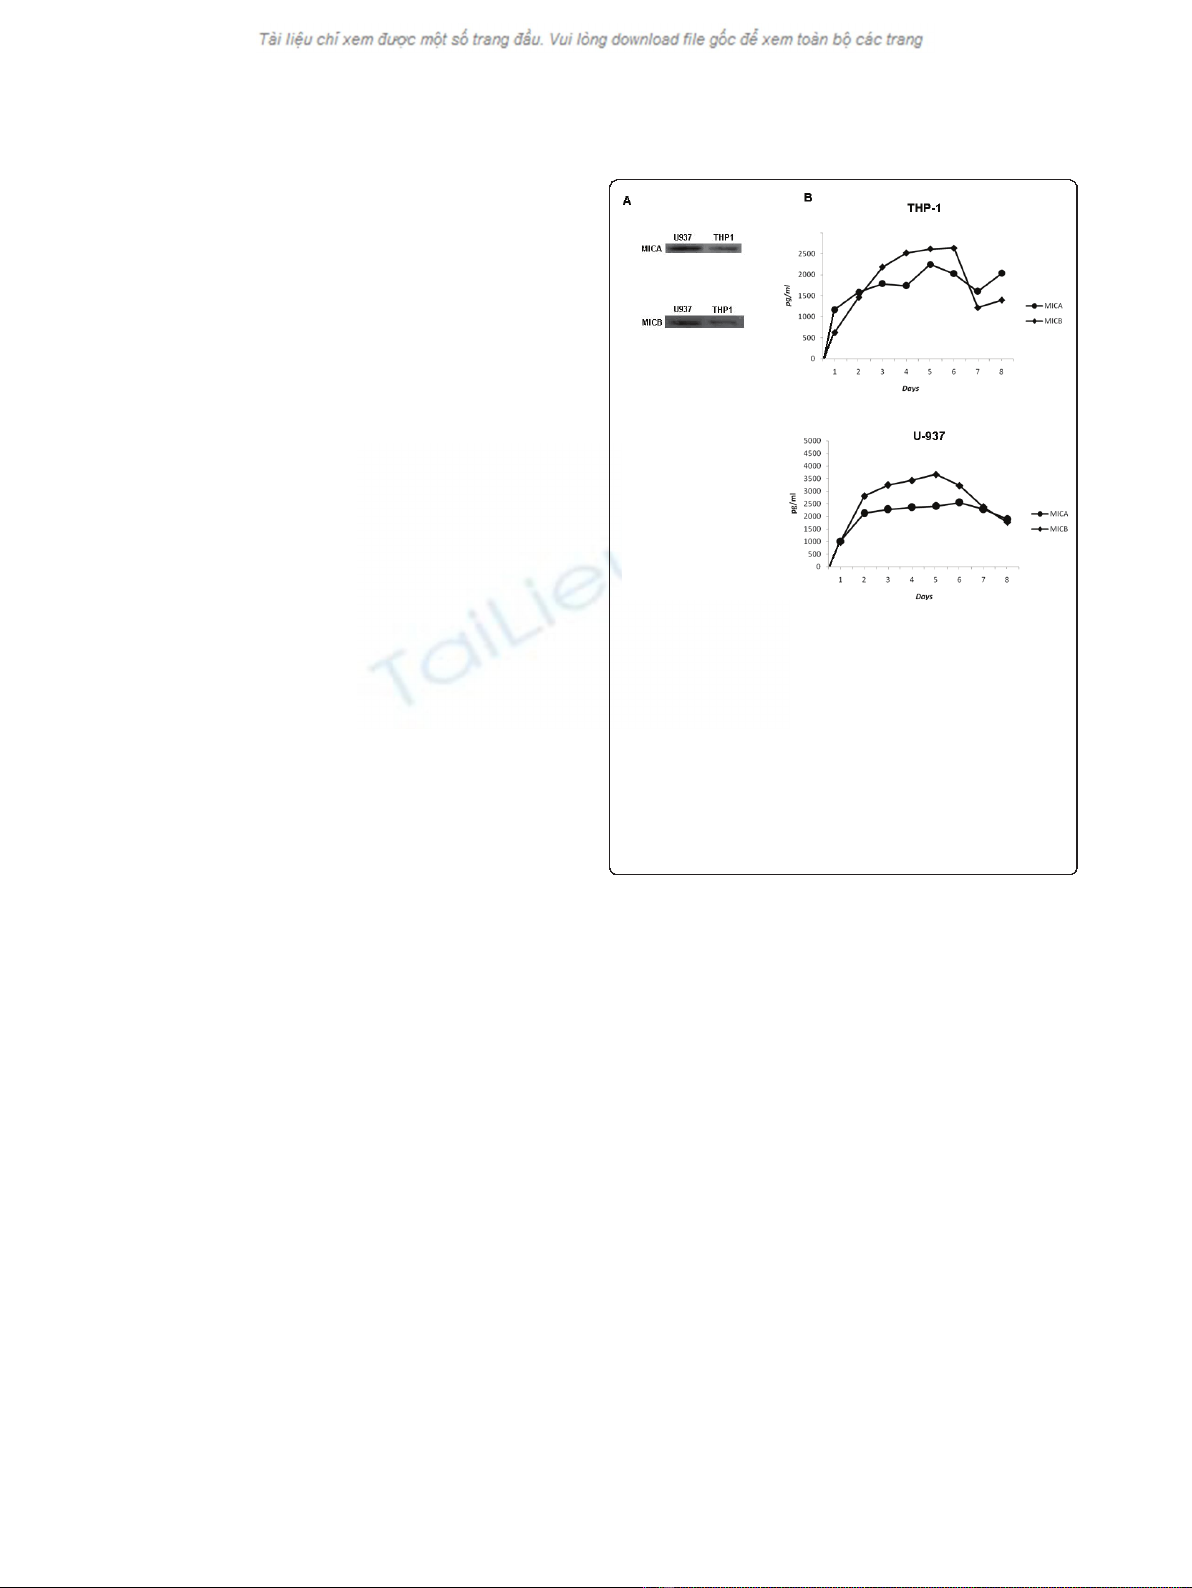
The leukemic myelomonocytic U-937 and THP-1 cell lines
produce and secrete MICA and MICB
In order to evaluate if the leukemic myelomonocytic
U-937andTPH-1celllinesproduceMICAandMICB,
we performed a western blot analysis using specific anti-
bodies against MICA and MICB and found that both
proteins were expressed in both cell lines (Figure 1A).
To determine if the cells secreted MICA and MICB, we
cultivated 5 × 10
3
cells for up to eight days and evalu-
ated the amounts of these proteins in their respective
conditioned media (CM). Using ELISA, we determined
that MICA and MICB were indeed secreted into the
CMfromthefirstdayofculture(Figure1B).Wedid
not find any MICA or MICB in the conditioned media
of normal monocytes that were cultured under the same
conditions as the myelomonocytic cells.
U-937 and THP-1 proliferate in response to MICA and
MICB
After we detected that MICA and MICB were secreted by
U-937 and THP-1 cells, we determined if external MICA
and MICB could modulate their proliferation. For this
purpose, we cultured 5 × 10
3
U-937 and TPH-1 cells for
3 days in the presence of 1, 10, or 100 ng of MICA or
MICB and observed that both proteins induced signifi-
cant dose-dependent proliferation (Figure 2). Normal
monocytes were cultured in the same conditions as the
myelomonocytic cells and no proliferation was obtained.
U-937 and TPH-1 express NKG2D
After we demonstrated that the leukemic myelomonocy-
tic cell lines proliferated in response to exogenous
Figure 1 Leukemic myelomonocitic cells express and secrete
MICA and MICB. THP-1 and U937 cells (1 × 10
7
) were lysed, proteins
were immunoprecipitated and equal amounts of proteins from the
total lysates were resolved by SDS-PAGE and transferred to
nitrocellulose membranes. The blot was developed using either anti-
MICA monoclonal antibodies or anti-MICB monoclonal antibodies (A)
and an appropriate secondary antibody conjugated to HRP for
chemiluminescent detection. THP-1 and U937 cells (50 × 10
3
) were
cultured in 48-well plates for 7 days, and the conditioned media
were collected daily. MIC proteins were detected by ELISA assay
using specific antibodies. The production of MICA and MICB was
evaluated using monoclonal antibodies against MICA and MICB in
THP-1 and U-937 cells (B). Standard deviations were less than 5%
Weiss-Steider et al.Journal of Experimental & Clinical Cancer Research 2011, 30:37
http://www.jeccr.com/content/30/1/37
Page 3 of 8
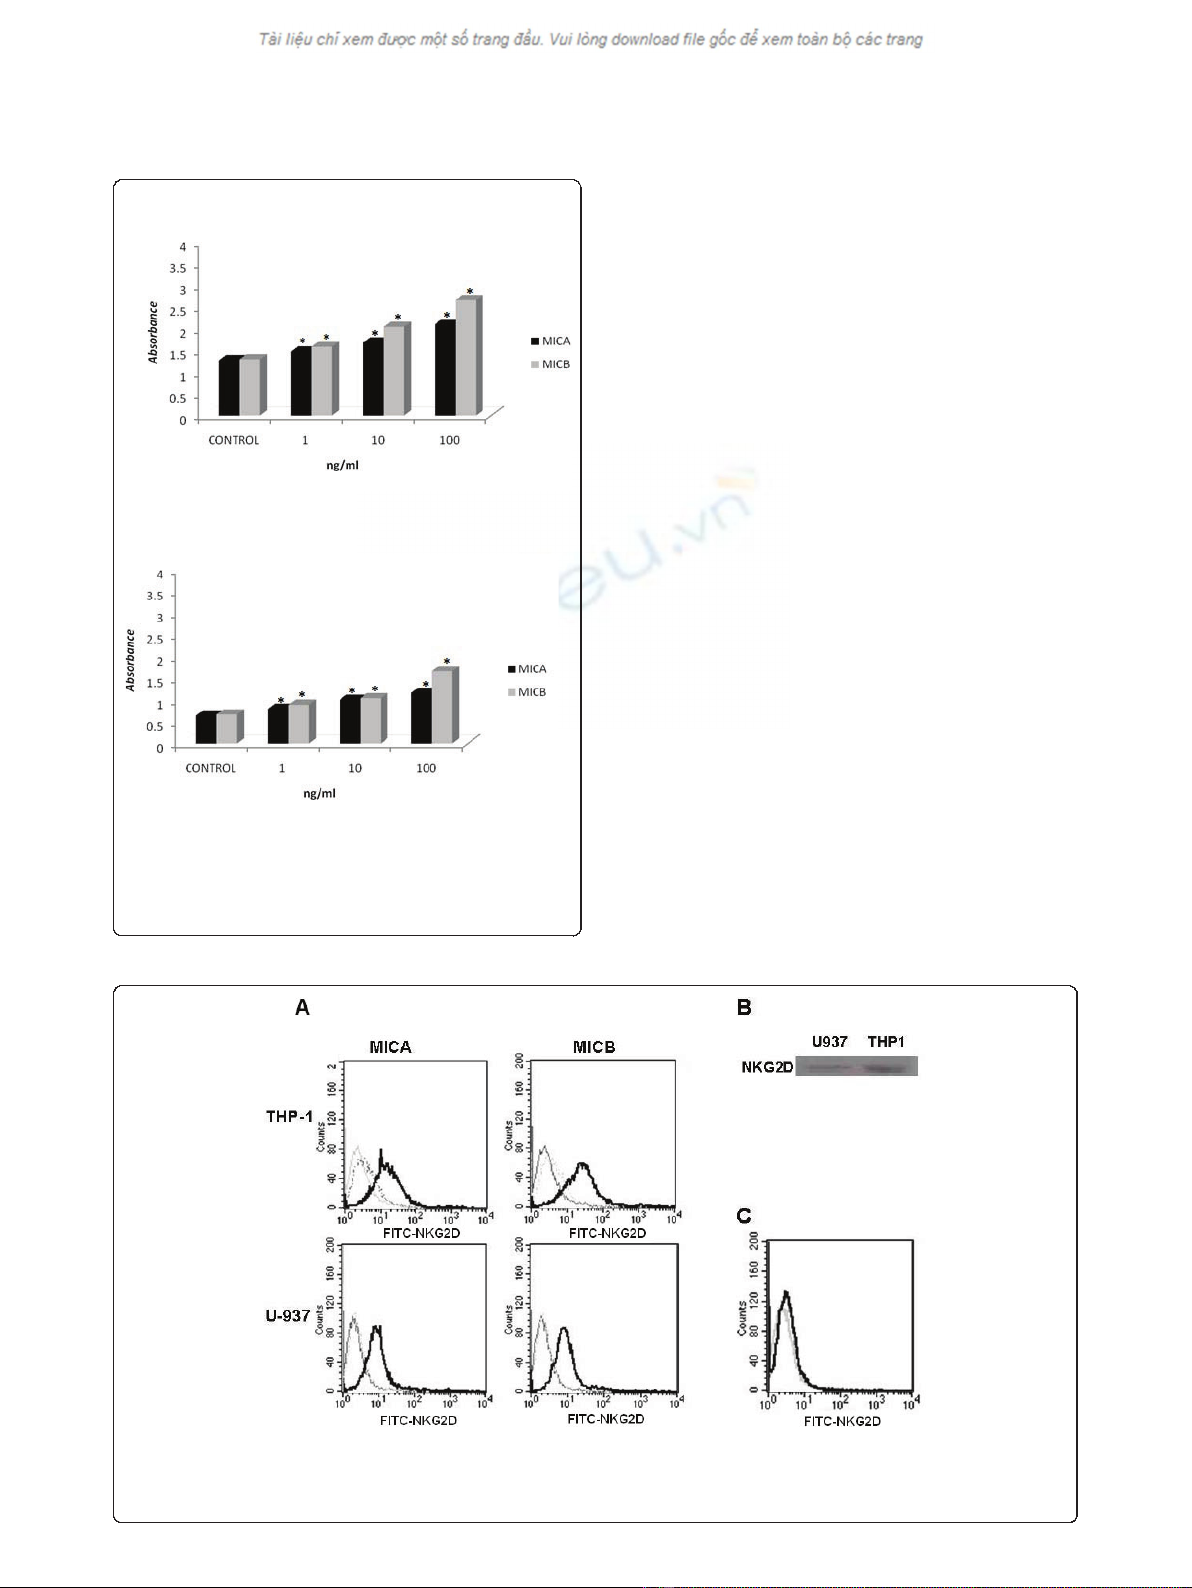
MICA and MICB, we evaluated the possible expression
of NKG2D, which is the specific receptor for these pro-
teins. Flow cytometry (Figure 3A) and western blot ana-
lysis (Figure 3B) using specific antibody against this
receptor were used to show that U-937 and THP-1 cells
do express NKG2D. Monocytes were used in the cyto-
metry assay as a negative control (Figure 3C). It is inter-
esting to note that we could only detect NKG2D by
flow cytometry when the cells were previously activated
for 18 h by either MICA or MICB.
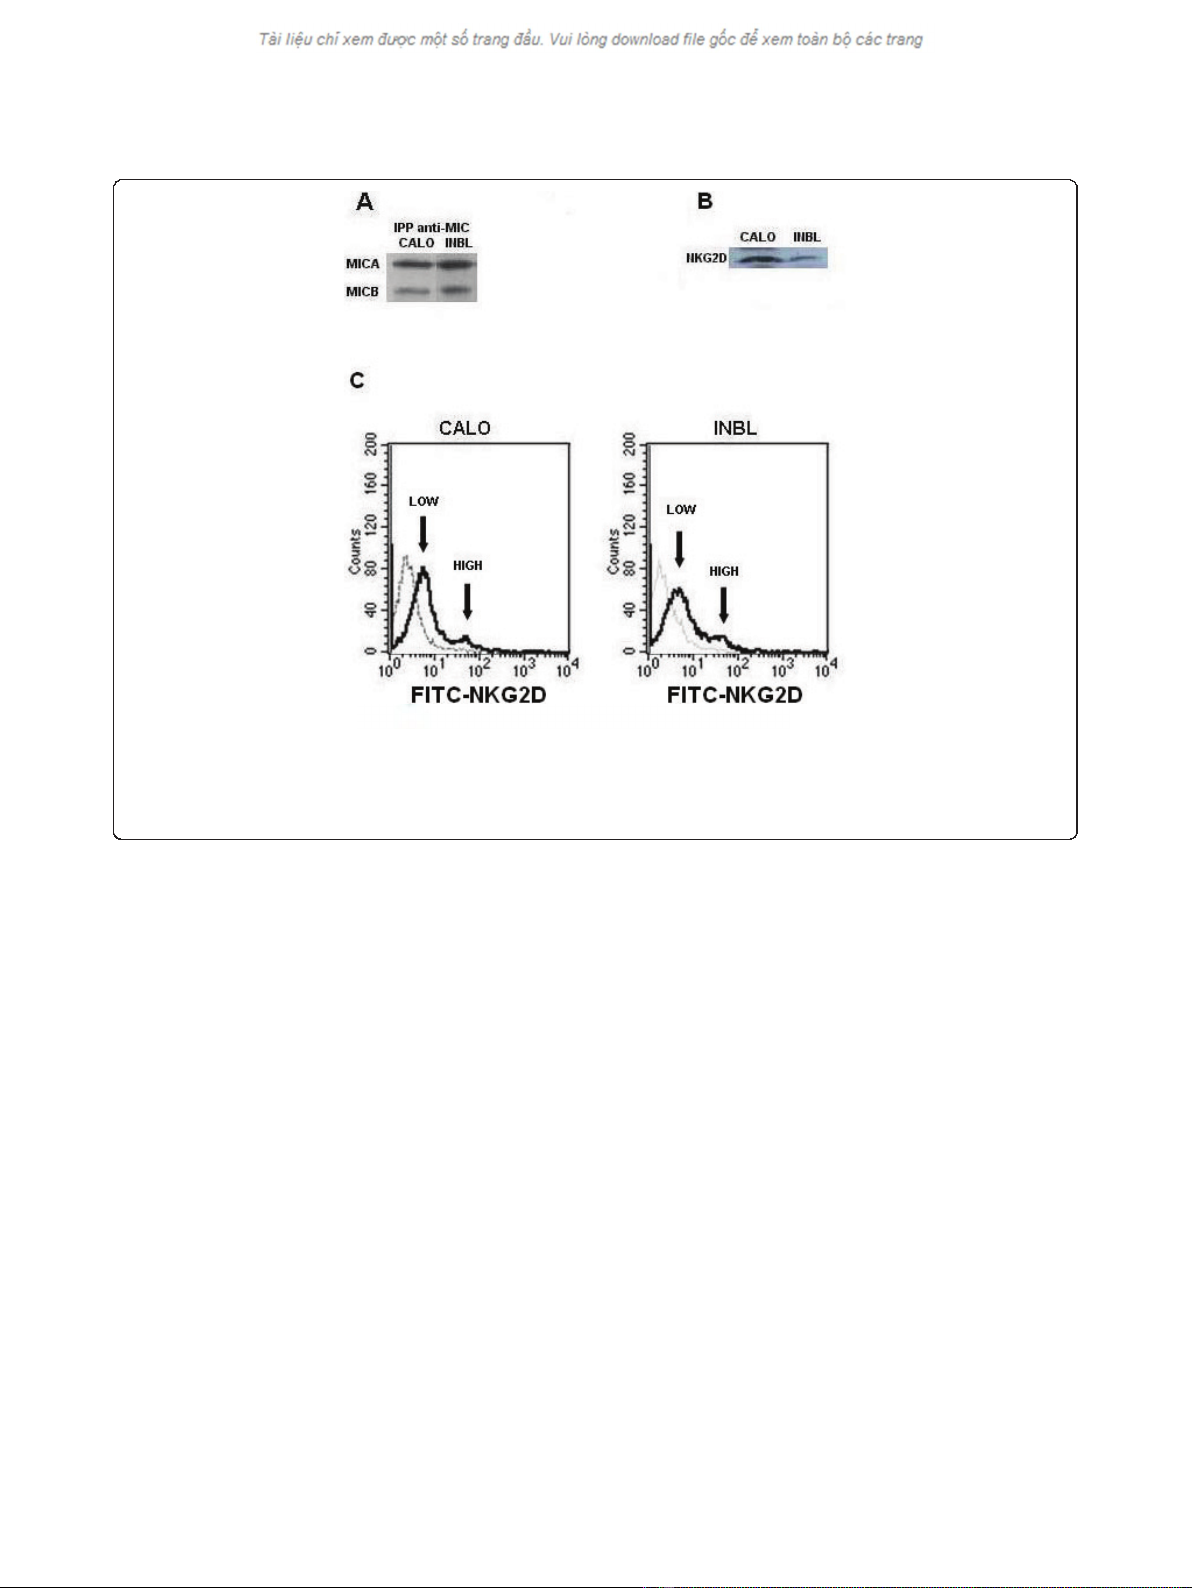
The CALO and INBL cervical cancer cell lines secrete MICA
and MICB and express NKG2D
In order to evaluate the capacity of other tumor cell types
to express MICA and MICB, as well as NKG2D, we eval-
uated the possible expression of these proteins in two
human epithelial cervical cancer cell lines, CALO and
INBL, using polyclonal antibodies against MICA/MICB
and anti-NKG2D for western blot and flow cytometric
analyses. Our results show that MICA, MICB and
NKG2D were expressed in both cell lines (Figs. 4A and
4B). It is interesting to mention that when flow cyto-
metric analysis for NKG2D expression was performed
after the cells were activated for 72 h by MICB, only a
small minority of the cells exhibited high NKG2D expres-
sion, while the majority of the cells expressed low levels
of the receptor (Figure 4C). The presence of NKG2D was
further evaluated by immunohistochemical analysis,
which revealed a reproducible pattern of staining in both
cervical cancer cell lines (Figure 5). We also evaluated if
CALO and INBL secreted MICA and MICB into their
culture media. For this purpose, we seeded 5 × 10
3
cells
THP-1
U-937
Figure 2 MICA and MICB induce leukemic myelomonocytic cell
line proliferation. TPH-1 and U937 cells (5 × 10
3
) were cultured for
72 h in 96-well plates in the presence of 1, 10, or 100 ng
recombinant human MICA or MICB. Proliferation was assayed using
the MTT technique. The evaluation of THP-1 (A) and U-937 (B) cell
proliferation. * indicates p < 0.05
Figure 3 NKG2D is expressed in leukemicmyelomonocyticcelllines. Flow cytometric analysis of NKG2D expression in the leukemic
myelomonocytic TPH-1 and U937 cell lines in the presence of either MICA or MICB (A) and in normal blood monocytes under the same
conditions (C). NKG2D was also detected by western blot analysis in THP-1 and U937 cells (B). The NKG2D levels in the isotype controls (dotted
lines), non-treated cells (grey line) and MIC-treated cells with either 10 ng MICA or MICB for 18 h (solid lines) are depicted in the graphs.
Weiss-Steider et al.Journal of Experimental & Clinical Cancer Research 2011, 30:37
http://www.jeccr.com/content/30/1/37
Page 4 of 8
for up to eight days and detected significant amounts of
MICA and MICB in the CM by ELISA; the concentration
of MICA AND MICB increased during the first five days
in culture (Figure 6).
CALO and INBL proliferate in response to MICA and MICB
After we detected the expression of MICA, MICB, and
NKG2D in CALO and INBL cells, we proceeded to eval-
uate if MICA and MICB could modulate their prolifera-
tion. For this purpose, we cultured 5 × 10
3
CALO and
INBL cells for 3 days in the presence of 1, 10, or 100 ng
of MICA or MICB and found that both ligands stimu-
lated significant cell proliferation (Figure 7).
Discussion
The production of MICA and MICB by virus-infection
or tumor cells has been previously reported [19,20], and
the ability of these ligands to induce cytotoxic activity in
NK cells and other cytotoxic lymphocytes through the
interaction with their cognate receptor, NKG2D, has
been well established [21,22]. Thus, a mechanism by
which malignant cells express stress signals, and how
other cells recognize those signals to become specifically
cytotoxic and mount an immunological response to
eradicate the tumor cells, has been clearly established.
In this work, we present evidence that both the stress
signals and their cognate receptor can be expressed on
the same tumor cells. We showed that the leukemic U-
937 and TPH-1 myelomonocytic cell lines secrete MICA
and MICB, and that those cells also express NKG2D,
the receptor for the secreted proteins. We found that
ectopic MICA and MICB could induce a strong prolif-
erative response on those cells, suggesting the possibility
of an autoregulatory mechanism by which MICA and
MICB secreted by the tumor cells are recognized by
their own NKG2D receptor to contribute to tumor cell
proliferation. The fact that these cells could express and
secrete MICA and MICB was expected, because malig-
nant cells are known to express these signal proteins;
nevertheless, we were surprised that the same cells
expressed NKG2D. We were further surprised when we
found that epithelial human cervical cancer cell lines
not only expressed MICA and MICB but also their
receptor. We do not know why the levels of MICA and
MICB took a longer time to be expressed in cervical
cells than in myelomonocytic cells but we could specu-
late that it could be related to their doubling times in
vitro because the cervical cells had a doubling time of
Figure 4 Cervical cancer cell lines express MICA, MICB and NKG2D. CALO and INBL cells (1×10
7
) were lysed proteins immunoprecipitated
and equal amounts of protein from total lysates were resolved by SDS-PAGE and transferred to nitrocellulose membranes. The blots were
developed with either polyclonal anti-MIC antibodies (A) or monoclonal anti-NKG2D antibodies (B) and an appropriate secondary antibody
conjugated to HRP for chemiluminescence detection. Flow cytometric analysis of NKG2D expression in cervical carcinoma cell lines after 72 h
induction with 10 ng MICB (C). We used only MICB to induce the expression of NKG2D because we previously obtained that MICB was a better
inducer of myelomonocytic cell proliferation than MICA. Graphs show NKG2D levels (solid line) and isotype controls (dotted line).
Weiss-Steider et al.Journal of Experimental & Clinical Cancer Research 2011, 30:37
http://www.jeccr.com/content/30/1/37
Page 5 of 8


![PET/CT trong ung thư phổi: Báo cáo [Năm]](https://cdn.tailieu.vn/images/document/thumbnail/2024/20240705/sanhobien01/135x160/8121720150427.jpg)


%20--%3e%3cdefs%3e%3cstyle%3e%20.st0%20{%20fill:%20%23fff;%20}%20.st1%20{%20fill:%20%237800fa;%20}%20%3c/style%3e%3c/defs%3e%3cpath%20class='st1'%20d='M117.78,12.18H43.11c2.9,3.47,4.65,7.94,4.65,12.82,0,5.6-2.3,10.66-6.01,14.29h76.02l7.22-13.56-7.22-13.56Z'/%3e%3cg%3e%3cpath%20class='st0'%20d='M53.58,26.17h-.59v-1.46h.59v-4.96h2.83c1.78,0,2.67.94,2.67,2.82v5.76c0,1.87-.89,2.81-2.67,2.81h-2.83v-4.96ZM55.36,21.37v3.34h1.1v1.46h-1.1v3.34h1.01c.61,0,.91-.37.91-1.1v-5.93c0-.74-.3-1.1-.91-1.1h-1.01Z'/%3e%3cpath%20class='st0'%20d='M65.99,31.14h-1.8l-.31-2.07h-2.19l-.31,2.07h-1.64l1.82-11.39h2.62l1.82,11.39ZM65.28,18.04c-.25.46-.51.77-.75.94-.21.15-.47.22-.79.22-.26,0-.57-.07-.92-.22l-.38-.15c-.14-.05-.26-.07-.37-.07-.3,0-.53.18-.71.54l-.91-.68c.25-.46.51-.77.75-.94.21-.14.48-.21.79-.21.26,0,.57.07.92.21l.38.15c.14.05.26.07.37.07.3,0,.53-.18.71-.54l.91.68ZM61.91,27.52h1.73l-.87-5.76-.87,5.76Z'/%3e%3cpath%20class='st0'%20d='M74.53,26.89v1.52c0,1.91-.89,2.86-2.67,2.86s-2.67-.95-2.67-2.86v-5.93c0-1.91.89-2.86,2.67-2.86s2.67.95,2.67,2.86v1.11h-1.69v-1.22c0-.75-.31-1.12-.93-1.12s-.93.37-.93,1.12v6.15c0,.74.31,1.11.93,1.11s.93-.37.93-1.11v-1.63h1.69Z'/%3e%3cpath%20class='st0'%20d='M81.4,31.14h-1.8l-.31-2.07h-2.19l-.31,2.07h-1.64l1.82-11.39h2.62l1.82,11.39ZM75.9,19.2l1.52-1.91h1.71l1.51,1.91h-1.61l-.76-.95-.75.95h-1.61ZM77.32,27.52h1.73l-.87-5.76-.87,5.76ZM83.1,15.99l-1.76,1.91h-1.26l1.17-1.91h1.86Z'/%3e%3cpath%20class='st0'%20d='M84.86,19.75c1.78,0,2.67.94,2.67,2.82v1.48c0,1.87-.89,2.81-2.67,2.81h-.85v4.28h-1.79v-11.39h2.64ZM84.01,21.37v3.86h.85c.58,0,.87-.36.87-1.08v-1.71c0-.71-.29-1.07-.87-1.07h-.85Z'/%3e%3cpath%20class='st0'%20d='M93.51,19.75c1.78,0,2.67.94,2.67,2.82v1.48c0,1.87-.89,2.81-2.67,2.81h-.85v4.28h-1.79v-11.39h2.64ZM92.66,21.37v3.86h.85c.58,0,.87-.36.87-1.08v-1.71c0-.71-.29-1.07-.87-1.07h-.85Z'/%3e%3cpath%20class='st0'%20d='M98.8,31.14h-1.79v-11.39h1.79v4.88h2.03v-4.88h1.83v11.39h-1.83v-4.88h-2.03v4.88Z'/%3e%3cpath%20class='st0'%20d='M105.36,24.55h2.46v1.62h-2.46v3.34h3.09v1.63h-4.88v-11.39h4.88v1.63h-3.09v3.18ZM108.17,17.29l-1.76,1.91h-1.26l1.17-1.91h1.86Z'/%3e%3cpath%20class='st0'%20d='M112.2,19.75c1.78,0,2.67.94,2.67,2.82v1.48c0,1.87-.89,2.81-2.67,2.81h-.85v4.28h-1.79v-11.39h2.64ZM111.35,21.37v3.86h.85c.58,0,.87-.36.87-1.08v-1.71c0-.71-.29-1.07-.87-1.07h-.85Z'/%3e%3c/g%3e%3ccircle%20class='st1'%20cx='25'%20cy='25'%20r='20'/%3e%3cpath%20class='st0'%20d='M32.78,19.27c2.92,0,4.43,2.55,5.28,5.33l.71,2.17c.14.38-.33.75-.71.75h-5.61c.19-.33.24-.71.09-1.08l-.75-2.45c-.43-1.32-.99-2.64-1.79-3.77.75-.57,1.65-.94,2.78-.94h0ZM25,18.38c3.25,0,4.9,2.78,5.89,5.89l.76,2.45c.14.42-.33.8-.8.8h-11.69c-.42,0-.94-.38-.8-.8l.75-2.45c.99-3.11,2.64-5.89,5.89-5.89h0ZM25,11.35c1.74,0,3.11,1.37,3.11,3.11s-1.37,3.11-3.11,3.11-3.11-1.41-3.11-3.11,1.41-3.11,3.11-3.11h0ZM17.27,19.27c1.08,0,1.98.38,2.73.94-.8,1.13-1.37,2.45-1.74,3.77l-.8,2.45c-.14.38-.05.75.09,1.08h-5.56c-.42,0-.9-.38-.75-.75l.71-2.17c.9-2.78,2.41-5.33,5.33-5.33h0ZM17.27,12.91c1.51,0,2.78,1.27,2.78,2.83s-1.27,2.83-2.78,2.83-2.83-1.27-2.83-2.83,1.27-2.83,2.83-2.83h0ZM32.78,12.91c1.56,0,2.78,1.27,2.78,2.83s-1.23,2.83-2.78,2.83-2.83-1.27-2.83-2.83,1.27-2.83,2.83-2.83h0ZM27.07,28.56v.09c0,.57-.24,1.08-.61,1.46h0v.05c-.38.33-.9.57-1.46.57s-1.08-.24-1.46-.61h0c-.38-.38-.61-.9-.61-1.46v-.09h1.41v.09c0,.19.05.38.19.47v.05c.09.09.28.19.47.19s.38-.09.47-.19v-.05c.14-.09.24-.28.24-.47t-.05-.09h1.41ZM30.99,28.56v.09c0,1.65-.66,3.16-1.74,4.24-1.08,1.08-2.59,1.79-4.24,1.79s-3.16-.71-4.24-1.79l-.05-.05c-1.04-1.08-1.7-2.55-1.7-4.2v-.09h1.41v.09c0,1.27.47,2.4,1.27,3.25h.05c.85.85,1.98,1.37,3.25,1.37s2.4-.52,3.25-1.37c.85-.8,1.37-1.98,1.37-3.25v-.09h1.37ZM34.99,28.56v.09c0,2.78-1.13,5.28-2.92,7.07-1.79,1.79-4.29,2.92-7.07,2.92s-5.23-1.13-7.07-2.92c-1.79-1.79-2.92-4.29-2.92-7.07v-.09h1.41v.09c0,2.4.94,4.53,2.5,6.08,1.56,1.56,3.72,2.5,6.08,2.5s4.52-.94,6.08-2.5c1.56-1.56,2.5-3.68,2.5-6.08v-.09h1.41Z'/%3e%3c/svg%3e)