
ISSN 1859-1531 - TẠP CHÍ KHOA HỌC VÀ CÔNG NGHỆ - ĐẠI HỌC ĐÀ NẴNG, VOL. 23, NO. 2, 2025 59
INVESTIGATING PERFORMANCE OF A MULTI-SUBCARRIER FREE SPACE
OPTIC USING LOG-NORMAL CHANNEL MODEL
KHẢO SÁT HIỆU NĂNG CỦA HỆ THỐNG THÔNG TIN QUANG KHÔNG DÂY ĐA SÓNG
MANG PHỤ SỬ DỤNG MÔ HÌNH KÊNH LOG-NORMAL
Phuoc Quang Vuong1,2, Dien Van Nguyen3,4, Phuc Duy Vo1, Quynh Quang Nhu Nguyen1, Thai Quang Pham5,
Cuong Quoc Pham1, Lanh Sy Nguyen1, Hong Kiem Nguyen3, Hung Tan Nguyen3, Tuan Van Nguyen1*
1The University of Danang - University of Science and Technology, Vietnam
2Hue University - University of Science, Vietnam
3The University of Danang - Advanced Institute of Science and Technology, Vietnam
4FPT University, Vietnam
5Ho Chi Minh City University of Technology, Vietnam
*Corresponding author: nvtuan@dut.udn.vn
(Received: November 08, 2024; Revised: January 13, 2025; Accepted: January 21, 2025)
DOI: 10.31130/ud-jst.2025.474E
Abstract - The paper builds a computational model of a multi-
subcarrier free space optic, a variant of the Subcarrier Intensity
Modulation Free Space Optic (SIM-FSO), establishes algorithmic
flowcharts, writes a computational program to investigate the
system performance under various modulation methods, air
turbulence levels and different numbers of subcarriers and data
rates. In order to achieve a BER value of 10-4, FSO-SIM systems
using BPSK, DPSK, 16-QAM, 64-QAM, 16-PSK and 64-PSK
modulation techniques require SNR approximately values of
17 dB, 18 dB, 19.6 dB, 22.6 dB, 22.8 dB and 34.5 dB, respectively.
When compared to other modulation techniques, DPSK performs
better and comes very close to BPSK without requiring complex
synchronous detection. The paper focuses on evaluating the
performance of the SIM-FSO-DPSK system at various bitrates,
subcarrier numbers, and with different diversity techniques to
enhance transmission capacity and system performance.
Tóm tắt - Bài báo xây dựng mô hình tính toán cho hệ thống
thông tin quang không dây đa sóng mang phụ, một biến thể của
hệ thống quang không dây điều chế cường độ sóng mang phụ,
lập lưu đồ thuật toán và viết chương trình khảo sát hiệu năng với
các phương pháp điều chế, mức độ nhiễu loạn không khí, số sóng
mang phụ và tốc độ dữ liệu khác nhau. Kết quả cho thấy, để đạt
BER = 10-4, các hệ thống FSO-SIM dùng các kỹ thuật điều chế
sóng mang phụ BPSK, DPSK, 16-QAM, 64-QAM, 16-PSK và
64-PSK yêu cầu các giá trị SNR lần lượt xấp xỉ 17 dB, 18 dB,
19,6 dB, 22,6 dB, 22,8 dB và 34,5 dB. Nhận thấy, DPSK cho
hiệu năng tốt hơn so với các trường hợp sử dụng các định điều
chế khác, gần bằng với BPSK nhưng không cần cấu trúc tách
sóng đồng bộ phức tạp. Bài báo tập trung khảo sát hiệu năng của
hệ thống SIM-FSO-DPSK theo tốc độ bít, số sóng mang phụ và
các phương pháp phân tập khác nhau nhằm nâng cao dung lượng
truyền dẫn và chất lượng hệ thống.
Keywords – Performance; multi-subcarrier free space optic
system; algorithm flowchart; air turbulence; diversity.
Từ khóa - Hiệu năng; hệ thống quang không dây đa sóng mang
phụ; lưu đồ thuật toán; nhiễu loạn không khí; phân tập.
1. Introduction
Nowadays, as a result of the continuous increase in
internet traffic and the rapid development of optical
technologies, the modern telecommunications network
architecture has experienced significant modifications.
With their huge transmission capacity, current fiber-optic
communication systems can connect many users and
provide a wide range of services. Deploying such fiber-
optic infrastructures is difficult, though, especially in areas
with unusual geography or restricted infrastructure. Free-
Space Optical (FSO) communication is considered as a
necessary addition to current optical transmission systems.
In recent years, FSO has become an attractive alternative
for traditional broadband wireless connections due to its
ultra high-speed transmission capability, no frequency
license requirement, simple installation, relocation, or
reconfiguration when network topology changes are
needed [1–5].
Basically, FSO technology uses light transmission to
send signals between two locations through free space.
However, the atmosphere is not an ideal medium for
communication. The light beam may suffer from
deflection by air turbulence caused by changes in the
refractive index along the transmission path caused by
variations in air temperature and pressure. Furthermore,
weather factors like wind, rain, and fluctuating light levels
throughout the day may affect system performance,
creating major challenges for FSO systems that aim to
achieve user’s demands for signal quality, high capacity,
and long transmission distances [6–9]. Therefore,
improving the quality of signal in FSO system while
considering balancing power, capacity, and complexity of
system has become an important goal for both research
teams as well as service providers. To address these
challenges, advanced signal modulation techniques and
diversity schemes have been proposed for FSO systems to
improve the reliability and efficiency of optical
communication links.
To balance these above goals, multi-subcarrier
modulation techniques combined with basic modulation
methods have attracted a lot of attention in recent years [10–
12]. However, in these studies, the authors mainly focus on
60 P. Q. Vuong, D. V. Nguyen, P. D. Vo, Q. Q. N. Nguyen, T. Q. Pham, C. Q. Pham, L. S. Nguyen, H. K. Nguyen, H. T. Nguyen, T. V. Nguyen
BPSK-SIM systems, where the BPSK modulation and
demodulation methods require the recovery of the subcarrier
at the receiver. This requires the synchronization of phase
and frequency with the subcarrier at the transmitter (coherent
detection) using a Phase-Locked Loop (PLL), which
increases system complexity. In [13-15], the authors did not
discuss the application of diversity techniques at the receiver
to improve transmitted signal quality.
This paper compares and evaluates the performance of
FSO-SIM systems after surveying their features using
multi-subcarrier techniques with different modulation
methods, including BPSK, DPSK, 16-QAM, 64-QAM, 16-
PSK, and 64-PSK. We also examine the SIM-FSO-DPSK
system at various bit rates, with varying numbers of
subcarriers that improve transmission capacity, and with
different diversity techniques to enhance overall system
performance.
2. Diagram of an FSO system using multi-subcarrier
modulation SIM technique
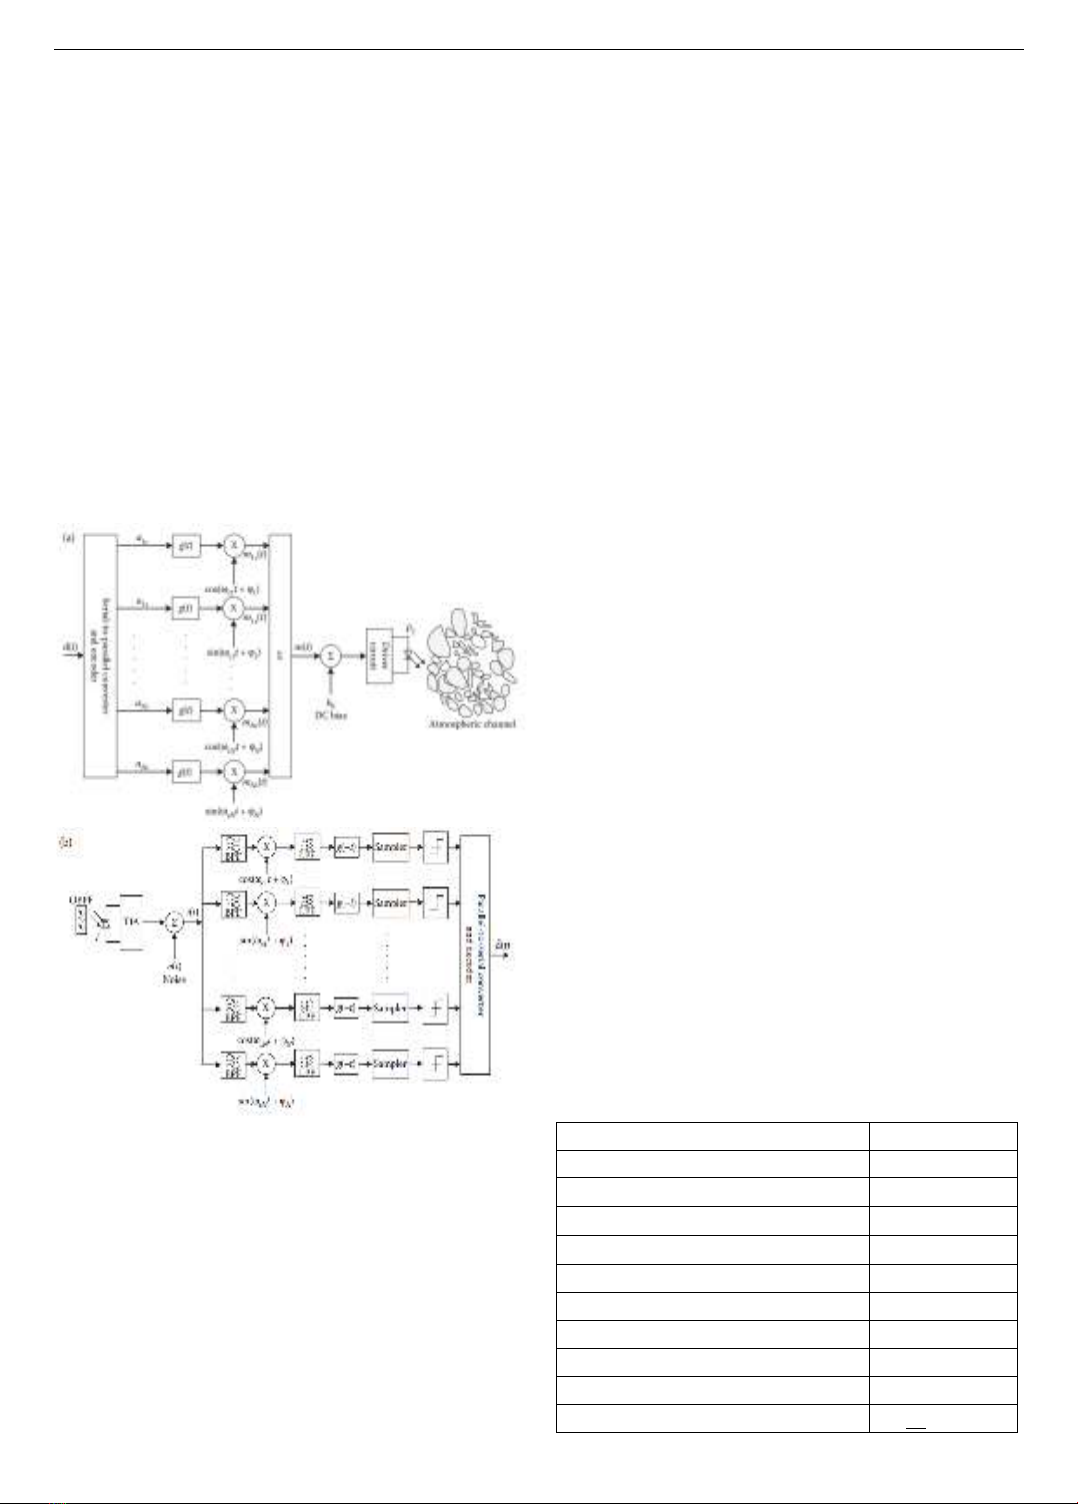
Figure 1. Block diagram of the FSO-SIM system using
N-subcarrier modulation technique. (a) block diagram of
the transmitter section; (b) block diagram of the receiver section
Figure 1 illustrates the block diagram of the FSO-SIM
system with 𝑁 subcarriers [16]. The source data (original
data), 𝑑(𝑡), is first converted from serial to parallel and then
encoded to distribute the data to the corresponding 𝑁
subcarriers. At this stage, the data is modulated with the
subcarriers to generate electrical signals 𝑚1(𝑡), 𝑚2(𝑡)
… 𝑚𝑁(𝑡), which are then combined into a single signal,
𝑚(𝑡). After that, the signal 𝑚(𝑡) is DC-biased before being
fed into the driver circuit to modulate by laser and generate
an optical signal with power 𝑃𝑇. Note that, when the signal
travels through the FSO channel, it is affected by
atmospheric turbulence and leads to random fluctuations in
received optical signal intensity. With the intensity
variations are characterized by the air turbulence intensity
𝜎𝑙
2 (Rytov variance) [17], for weak turbulence conditions
(𝜎𝑙
2< 1), these fluctuations have a log-normal distribution.
The overall performance of the system decreases as a result
of fading and signal distortion. Both unknown fading
effects caused by turbulence and deterministic path loss
determine the received optical power 𝑃𝑅. After travelling
through the air to an optical bandpass filter (OBPF) and into
a TIA (Transimpedance Amplifier) optical receiver, the
optical signal is converted back into 𝑚(𝑡)with the addition
of noise. The signal 𝑚(𝑡) is then passed through the
bandpass filters (BPFs), which have central frequencies
corresponding to the subcarrier frequencies used at the
transmitter, to recover the individual signals 𝑚1(𝑡), 𝑚2(𝑡)
… 𝑚𝑁(𝑡). Finally, these signals are demodulated and digital
signal processed to restore the data streams and reassemble
the original source data, 𝑑(𝑡).
The scenario with 𝑁 users, in which each user uses a
subcarrier with a different frequency, is not shown in
Figure 1. Similarly, before getting intensity modulation,
each user's data is modulated with separate subcarriers.
The expression for 𝑚(𝑡) is given as follows:
𝑚(𝑡)=∑𝑚𝑖(𝑡)
𝑁
𝑖=1 (1)
And each subcarrier is expressed by [16]
𝑚𝑖(𝑡)= 𝑔(𝑡)𝑎𝑖𝑐 𝑐𝑜𝑠(𝜔𝑐𝑖 𝑡 + 𝜑𝑖)
− 𝑔(𝑡)𝑎𝑖𝑠 𝑠𝑖𝑛(𝜔𝑐𝑖 𝑡 + 𝜑𝑖) (2)
where 𝑔(𝑡) is the pulse-shaping function, and [𝜔𝑐𝑖 , 𝜑𝑖]𝑖=1
𝑁
is the angular frequency and phase of each subcarrier. Note
that each subcarrier can be modulated by any modulation
method, such as: QAM, M-PSK, M-FSK, or M-ASK, etc...
After that, the optical signal at the transmitter, with power
𝑃𝑇, is transmitted through free space to the TIA receiver,
where it attenuates to a power 𝑃𝑅. Here, the receiver optical
signal is converted to an electrical signal 𝑖(𝑡). By
normalizing the receiver's area to 1 and representing the
received power by the irradiance 𝐼, we have the received
signal as below:
𝑖(𝑡)=𝑅𝐼[1 + 𝜉𝑚(𝑡)] + 𝑛(𝑡) (3)
where, the optical modulation index
𝜉 = |𝑚(𝑡)/𝑖𝐵− 𝑖𝑇ℎ|.
Table 1. Parameter values of the simulation system
System parameters
Value
Bit rate
155 Mbps
Wavelength
= 850 nm
Modulation index
= 1
Normalized carrier amplitude
𝐴 =1
Filter bandwidth
𝐵0 = 10−9m
Receiver opening angle
FOV = 0.6 rad
Number of subcariers
𝑁 = 1÷10
Length of LoS route
𝑑 = 1 km
Optical-electrical responsivity
𝑅 = 0.95 A/W
Load resistance of receiver
𝑅𝐿 = 50 Ω
ISSN 1859-1531 - TẠP CHÍ KHOA HỌC VÀ CÔNG NGHỆ - ĐẠI HỌC ĐÀ NẴNG, VOL. 23, NO. 2, 2025 61
After that, a bandpass filter (BPF), with a minimum
bandwidth of 2𝑅𝐵, is used to select the coressponding
subcarriers for demodulation, reduce the power of noise,
and reduce any slowly varying components
𝑅𝐼 in the
received signal. For a subcarrier with frequency 𝜔𝑐𝑖 , the
received signal is expressed as:
𝑖(𝑡)= 𝐼𝑐𝑜𝑚𝑝 + 𝑄𝑐𝑜𝑚𝑝 (4)
𝐼𝑐𝑜𝑚𝑝 = 𝑅𝐼𝜉𝑔(𝑡)𝑎𝑖𝑐 𝑐𝑜𝑠(𝜔𝑐𝑖 𝑡 + 𝜑𝑖)+ 𝑛𝐼(𝑡) (5)
𝑄𝑐𝑜𝑚𝑝 = −𝑅𝐼𝜉𝑔(𝑡)𝑎𝑖𝑠 𝑠𝑖𝑛(𝜔𝑐𝑖 𝑡 + 𝜑𝑖)+ 𝑛𝑄(𝑡) (6)
where, 𝑛𝐼(𝑡) and 𝑛𝑄(𝑡) are AWGN noise with a mean of 0
and variance of 𝜎2.
3. Results and discussion
3.1. Performance comparison of the SIM-FSO system
using different subcarrier modulation techniques
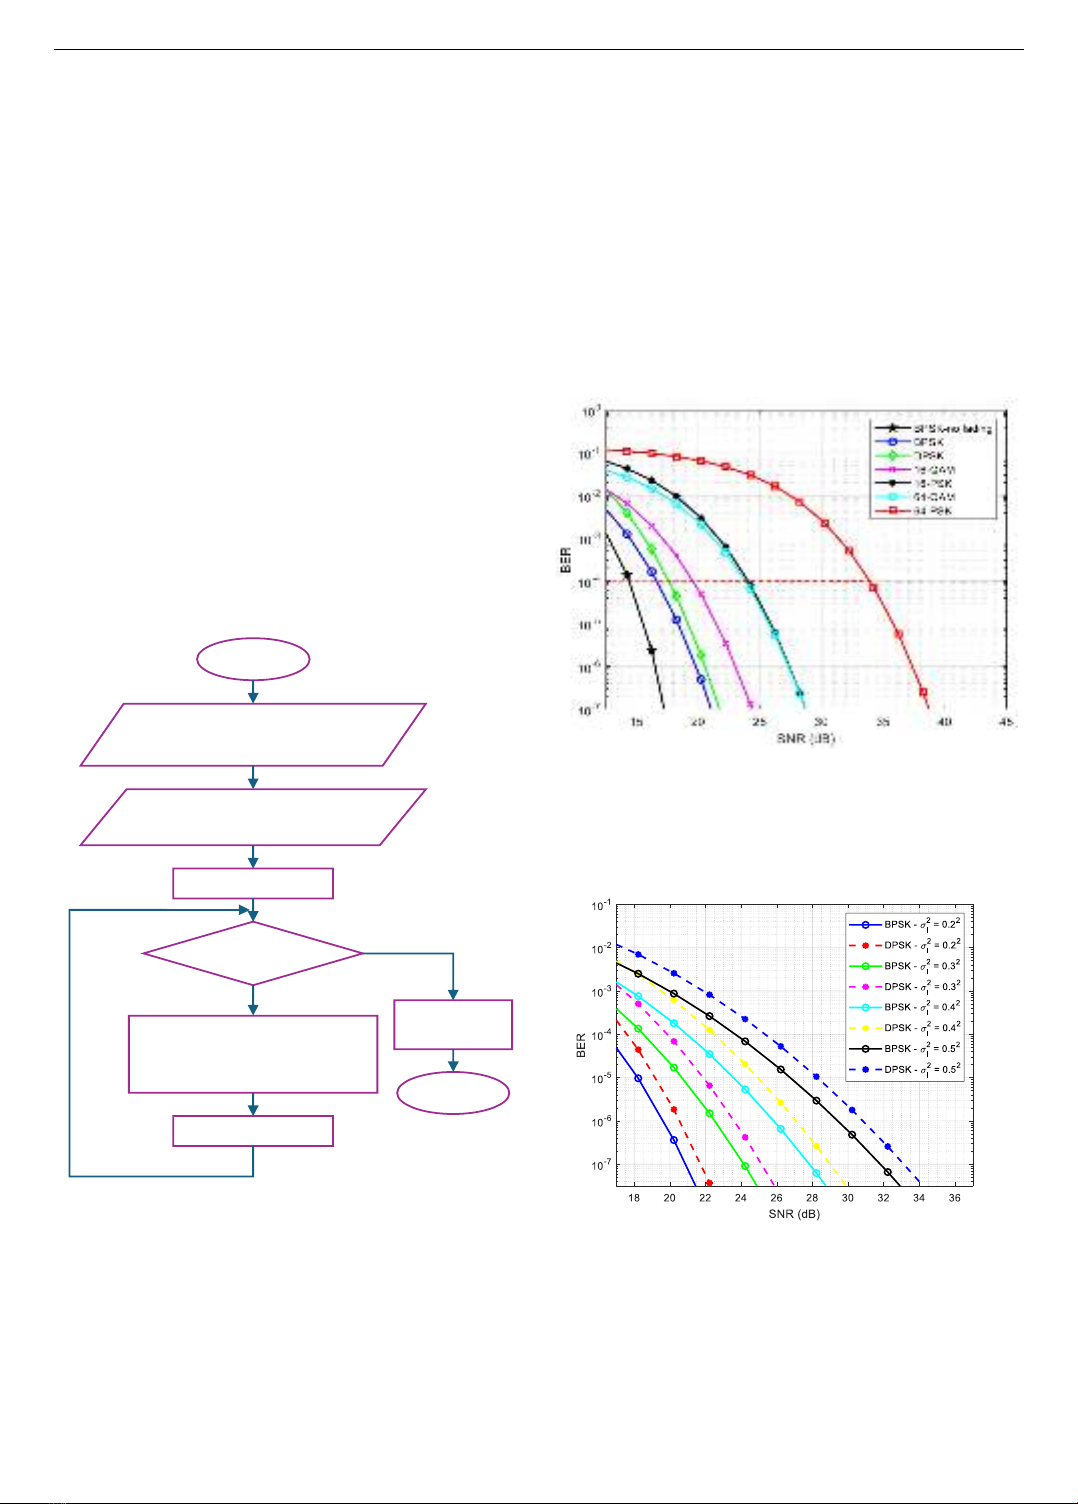
Figure 2 illustrates the flowchart for estimating the
FSO-SIM system’s BER of using different modulation
methods. Meanwhile, Figure 3 presents the relationship
between the bit error rate (BER) and the signal-to-noise
ratio (SNR) for the FSO-SIM system at the wavelength of
𝜆 = 850 nm. The analysis considers various modulation
techniques and assumes air turbulence intensity of
𝜎𝑙
2= 0. 22.
Figure 2. Flowchart for determining the BER values of
the SIM-FSO system using different modulation techniques
The result demonstrates that the BPSK modulation
gives better performance than other ones, regarding the
required SNR to achieve the given BER. Specifically, to
achieve BER of 10−4, the FSO-SIM system using different
subcarrier modulation techniques BPSK, DPSK, 16-QAM,
64-QAM, 16-PSK, and 64-PSK need growing SNR values
of 17 dB, 18 dB, 19.6 dB, 22.6 dB, 22.8 dB, and 34.5 dB
respectively. This suggests that the M-PSK and M-QAM
modulation techniques, the greater phase states 𝑀 require
the higher SNR values demands to maintain a consistent
BER - since the proximity of bit combinations increases,
raising the system’s error probability.
Consequently, increasing the phase states 𝑀 improves
the bit rate but reduces the overall system performance.
Based on the result of these evaluations, selecting a
modulation technique depends on specific applications and
requires the balancing system requirements such as
complexity, capacity, power efficiency, bandwidth, and cost.
Since BPSK and DPSK modulation offer higher signal
quality than M-PSK and M-QAM, the paper focuses on
evaluating the FSO-SIM system's performance using these
modulation methods. Furthermore, system capacity will be
increased by employing multiple SIM subcarriers.
Figure 3. BER graph of the FSO-SIM system using different
modulation techniques with
=850 nm và 𝜎𝑙
2= 0. 22
3.2. Performance comparison of the SIM-FSO system
using BPSK and DPSK with different turbulence
intensities
Figure 4. BER graph of the SIM-FSO system using BPSK and
DPSK modulation with different turbulence intensities
Figure 4 illustrates the relationship between BER and
SNR for the FSO-SIM system using BPSK and DPSK
modulation techniques, with varying air turbulence
intensities of 𝜎𝑙
2=[0. 22, 0. 32, 0. 42, 0. 52]. The BER is
plotted based on 𝑆𝑁𝑅 = (𝑅𝐸[𝐼])2/𝜎2, where both R and
I0 are normalized to 1. Simulations are set up with different
𝜎𝑙
2 values.
tart
nput the set n ise ariance alues
l
nput the set N alues
alculate at and l
c rresp nding t each m dulati n
type
l t the
graph
nd
length yes
n
62 P. Q. Vuong, D. V. Nguyen, P. D. Vo, Q. Q. N. Nguyen, T. Q. Pham, C. Q. Pham, L. S. Nguyen, H. K. Nguyen, H. T. Nguyen, T. V. Nguyen
The results show that for any given 𝜎𝑙
2, BPSK
modulation technique always gives slightly better BER
than the DPSK case does. For example, to achieve an equal
BER, the required SNR for the DPSK demodulator is
higher than that for BPSK, approximately 0.5 to 1 dB.
However, the DPSK method is simpler than BPSK one
since it d esn’t require coherent detection at the receiver.
Which mean the subcarrier can be recovered without the
need of Phase-Locked Loop (PLL). Therefore, to reduce
system complexity, compared to earlier studies, the paper
proposes evaluating system performance using the DPSK
technique in the following sections.
3.3. Performance analysis of the SIM-FSO-DPSK system
corresponding to different bit rates and number of
subcarriers with various turbulence intensities
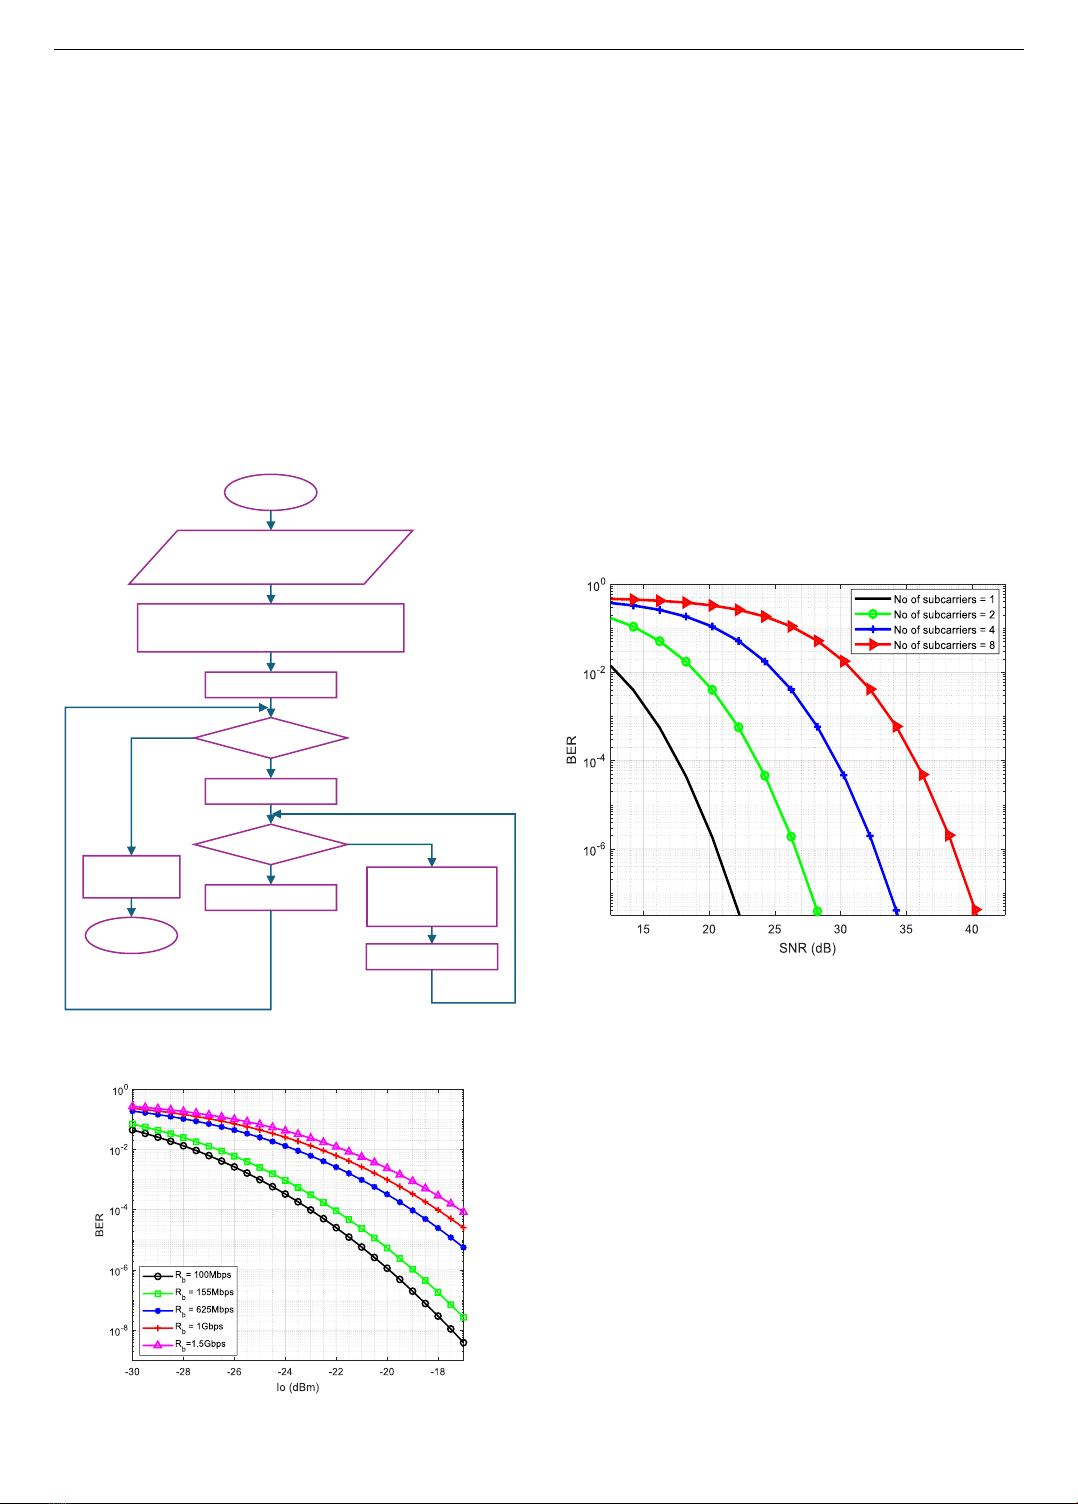
Figure 5 presents the algorithm flowchart for determining
BER of the SIM-FSO-DPSK system at different bit rates 𝑅𝑏.
Figure 5. Algorithm flowchart for determining the BER values
of the SIM-FSO-DPSK system at different 𝑅𝑏
Figure 6. BER graph of the FSO-SIM-DPSK system at different
bit rates 𝑅𝑏 and 𝜆 = 850𝑛𝑚
Figure 6 illustrates the relationship between BER and
radiation intensity 𝐼0 at the ngreceiver for the SIM-FSO-
DPSK system operating at wavelength of 𝜆 = 850𝑛𝑚. It
has been observed that for a given 𝐼0, system performance
degrades (corresponding with BER increasing) as the data
bit rate per channel increases from 100 Mbps, 155 Mbps,
625 Mbps, 1 Gbps, to 1.5 Gbps. As the bit rate increases,
so does the receiver bandwidth (𝐵𝐸= 0.75 𝑅𝑏), resulting
in increasing noise power, which reduces SNR and raises
BER.
Figure 7 shows the relationship between BER and SNR
of the SIM-FSO-DPSK system with varying numbers of
subcarriers 𝑁 = 1, 2, 4, 8 , assuming that all subcarriers
have the same modulation index 𝜉𝑠𝑐 = 𝜉/𝑁 . It can be
observed that, for a given BER value, the required SNR
increases as the number of subcarriers rises. Specifically,
to achieve a given BER of 10−3, the required SNR values
for SIM-FSO-DPSK systems using 1, 2, 4, and 8
subcarriers are approximately 16 dB, 22 dB, 28 dB, and
34 dB, respectively. And to achieve a BER of 10−4, the
required SNR values for these systems are approximately
18 dB, 24 dB, 30 dB, and 36 dB, respectively.
Figure 7. BER graph of the system for different numbers of
subcarriers
This result can be explained as follows, as the SNR for
each subcarrier is proportional to the square of
the modulation index, according to the formula
𝑆𝑁𝑅 = (𝑅𝜉𝐼0)2/2𝜎2. Therefore, an additional loss of
approximately 20 𝑙𝑔( 𝑁) [𝑑𝐵] occurs when the number of
subcarriers increases.
At the same BER requirement, the SNR increases with
the number of subcarriers according to:
𝑆𝑁𝑅𝐹𝑆𝑂−𝐷𝑃𝑆𝐾−𝑆𝐼𝑀−𝑁𝑠𝑢𝑏𝑐𝑎𝑟𝑟𝑖𝑒𝑟 =
𝑆𝑁𝑅𝐹𝑆𝑂−𝐷𝑃𝑆𝐾−𝑆𝐼𝑀−1_𝑠𝑢𝑏𝑐𝑎𝑟𝑟𝑖𝑒𝑟 +20 𝑙𝑔(𝑁) [𝑑𝐵] (7)
where, 𝑁 is the number of subcarriers used in the FSO-
SIM system.
3.4. SIM-FSO-DPSK system using SelC receive diversity
technique
The SelC (Selection Combining) technique is suitable
for DPSK modulation, where the subcarrier signal is
asynchronously demodulated. Moreover, the SelC
tart
nput the set it rate alues
set irradiance intensity alues
alculate l g irradiance ariance l y
a elength
l t the
graph alculate at
and
nd
length
length
yes
yes
n
n
ISSN 1859-1531 - TẠP CHÍ KHOA HỌC VÀ CÔNG NGHỆ - ĐẠI HỌC ĐÀ NẴNG, VOL. 23, NO. 2, 2025 63
technique may reduce the receiver complexity compared to
MRC and EGC as in earlier works, and the SNR of SelC is
given by:
𝛾𝑆𝑒𝑙𝐶 (𝐼)=𝑅2𝐴2𝐼max
2
2𝑁𝜎2 (8)
where, 𝐼max = 𝑚𝑎𝑥(𝐼1, 𝐼2,...𝐼𝑁).
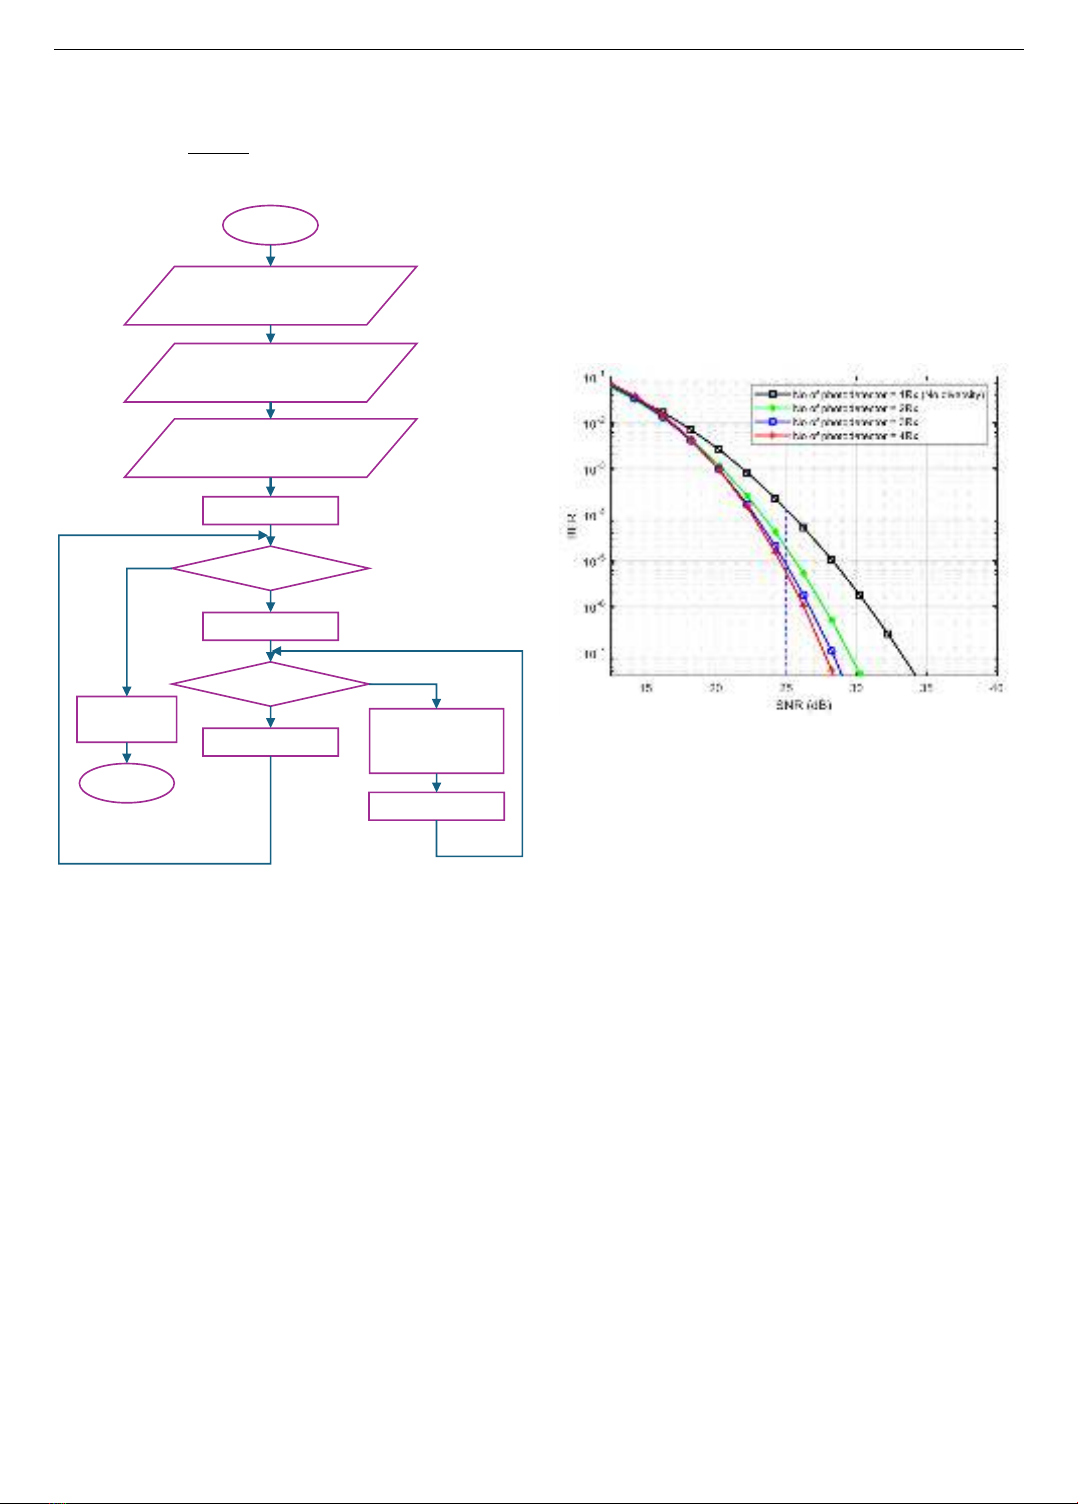
Figure 8. Flowchart for determining the BER values of
the FSO-SIM-DPSK system using the SelC receive diversity
technique
Figure 8 shows an algorithm for calculating the BER in
the SIM-FSO-DPSK system using the SelC diversity
reception technique. Figure 9 illustrates the simulation
results, demonstrating the relationship between BER and
SNR in the SIM-FSO-DPSK system using SelC diversity
reception with the number of optical PIN photodetectors in
the receiver are set to 𝑁 = 1, 2, 3, and 4 in the turbulent
conditions with 𝜎𝑙
2= 0. 52.
When 𝑁 = 1 , corresponding to SIM-FSO-DPSK
system without diversity reception, where turbulence
causes slow fading at the symbol rate 𝑅symbol at which the
system operates. Assuming that, the turbulence correlation
time is much greater than the duration of two symbols, so
that the receiver can perform DPSK demodulation easily.
When 𝑁 = 2, 3, 4 , this corresponds to a SIM-FSO-
DPSK system employing SelC diversity reception. Here,
𝑁 photodetectors (PIN) are located at appropriate distances
to receive uncorrelated laser radiation while remaining
within the laser beam width.
The results in Figure 9 show that the performance of the
SIM-FSO-DPSK system improves when the number of
photodetectors 𝑁 increases from 2 to 4. For example, at a
given SNR of 25 dB, the BER in the case of system without
SelC diversity ( 𝑁 = 1 ) and with diversity using
𝑁 = 2, 3, 4 photodetectors are approximately 1.1x10⁻⁴,
1.2x10⁻⁵, 9x10⁻⁶ and 8x10⁻⁶ respectively. However, once
the number of photodetectors reaches a certain threshold,
further increases only get a minimal performance gains,
as shown by the nearly overlapping BER curves when
𝑁 increases from 3 to 4. So, limiting the number of
photodetectors at 4 may reduce system complexity
and cost.
Figure 9. BER graph of the SIM-FSO-DPSK system using
the SelC receive diversity technique
4. Conclusions
Based on the computational model of a multi-
subcarrier free space optic system (SIM-FSO), this paper
has demonstrated algorithm flowcharts and written a
Matlab program to evaluate the system's performance
using various modulation techniques. From the
simulation results, the paper has analyzed, compared, and
evaluated the system's performance under various
modulation methods, air turbulence levels, different
numbers of subcarriers, and data rates. In this paper, to
reduce the complexity of the receiver, we propose using
DPSK modulation rather than BPSK method, as earlier
studies with the need of PLL for su carrier’s
synchronization. The work also deploys the SelC
diversity technique, which can improve signal quality
while slightly increasing the complexity or cost of the
system. Considering the above results, the paper proposes
the SIM-FSO-DPSK system as a solution to balance the
demands of increased capacity, improved signal quality,
reduced complexity, and lower system costs, which
enhances the system's practical applicability and satisfy
the growing information needs of users.
Acknowledgement: This research is funded by Vietnam
National Foundation for Science and Technology
Development (NAFOSTED) under grant number
NCUD.02-2019.51.
tart
nput the tur ulence intensitie
ariance alues
l t the
graph alculate e at
and
nd
length N
length
yes
yes
n
n
nput the set detect r c unt
alues
nput the set alues at the
recei er


![Đề cương ôn tập môn Đo lường điện [chuẩn nhất]](https://cdn.tailieu.vn/images/document/thumbnail/2026/20260310/hoaphuong0906/135x160/75761773197829.jpg)
![Giáo trình Máy điện 1 Đại học Bà Rịa - Vũng Tàu [Download PDF]](https://cdn.tailieu.vn/images/document/thumbnail/2026/20260310/hoaphuong0906/135x160/29511773283865.jpg)


![Giáo trình Điện tử số Phần 2: [Mô tả nội dung phần 2, ví dụ: Mạch logic, Thiết kế mạch,...]](https://cdn.tailieu.vn/images/document/thumbnail/2026/20260305/hoatulip2026/135x160/87191773135922.jpg)


