RESEARCH Open Access
RNAi-mediated knockdown of cyclooxygenase2
inhibits the growth, invasion and migration of
SaOS2 human osteosarcoma cells: a case control
study
Qinghua Zhao
1
, Chuan Wang
2
, Jiaxue Zhu
1
, Lei Wang
1
, Shuanghai Dong
1
, Guoqiao Zhang
2
, Jiwei Tian
1*
Abstract
Background: Cyclooxygenase2 (COX-2), one isoform of cyclooxygenase proinflammatory enzymes, is responsible
for tumor development, invasion and metastasis. Due to its role and frequent overexpression in a variety of human
malignancies, including osteosarcoma, COX-2 has received considerable attention. However, the function of COX-2
in the pathogenesis of cancer is not well understood. We examined the role of COX-2 in osteosarcoma.
Methods: We employed lentivirus mediated-RNA interference technology to knockdown endogenous gene COX-2
expression in human osteosarcoma cells (SaOS2) and analyzed the phenotypical changes. The effect of COX-2
treatment on the proliferation, cell cycle, invasion and migration of the SaOS2 cells were assessed using the MTT,
flow cytometry, invasion and migration assays, respectively. COX-2, vascular endothelial growth factor (VEGF),
epidermal growth factor (EGF), basic fibroblast growth factor (bFGF) mRNA and protein expression were detected
by RT-PCR and western blotting.
Results: Our results indicate that a decrease of COX-2 expression in human osteosarcoma cells significantly
inhibited the growth, decreased the invasion and migration ability of SaOS2 cells. In addition, it also reduced VEGF,
EGF and bFGF mRNA and protein expression.
Conclusions: The COX-2 signaling pathway may provide a novel therapeutic target for the treatment of human
osteosarcoma.
Background
Osteosarcoma is the most common primary malignant
tumor arising in bone predominantly affecting children
and adolescents [1]. It is also one of the most heteroge-
neous of human tumors [2]. The 5-year survival rate has
increased up to 70% in patients with localized disease,
however, the prognosis is very poor and the 5-year sur-
vival rate is only 20-30% in patients with metastatic dis-
ease at diagnosis [3]. Although an adjuvant treatment
regimen after surgical resection seems to prolong survi-
val, the precise treatment protocol of drug-of-choice is
still debated because the exact mechanisms the
development and progression of osteosarcoma are still
largely unknown [4]. Effective systemic therapy capable
of reversing the aggressive nature of this disease is cur-
rently not available [5]. Therefore, an understanding of
the molecular mechanisms of osteosarcoma is one of
the most important issues for treatment. New therapeu-
tic strategies are necessary to increase survival rates in
patients with osteosarcoma.
Cyclooxygenasesarekeyenzymesintheconversion
of arachidonic acid into prostaglandin (PG) and other
eicosanoids including PGD2, PGE2, PGF2, PGI2 and
thromboxane A2 [6]. There are two isoforms of
cyclooxygenase, designated COX-1 and COX-2. COX-1
is constitutively expressed in most tissues, and seems
to perform physiological functions [7]. However, COX-2
is an inducible enzyme associated with inflammatory
* Correspondence: tjw609@163.com
1
Department of Orthopaedics, Affiliated First People’s Hospital, Shanghai Jiao
Tong University, 100 Haining Road, Shanghai 200080, China
Full list of author information is available at the end of the article
Zhao et al.Journal of Experimental & Clinical Cancer Research 2011, 30:26
http://www.jeccr.com/content/30/1/26
© 2011 Zhao et al; licensee BioMed Central Ltd. This is an Open Access article distributed under the terms of the Creative Commons
Attribution License (http://creativecommons.org/licenses/by/2.0), which permits unrestricted use, distribution, and reproduction in
any medium, provided the original work is properly cited.

disease and cancer. Many reports have indicated that
COX-2 expression is increased in a variety of human
malignancies, including osteosarcoma, and is responsi-
ble for producing large amounts of PGE2 in tumor tis-
sues [8-11]. These molecules are thought to play a
critical role in tumor growth, because they reduce apop-
totic cell death, stimulate angiogenesis and invasiveness
[12,13]. COX-2 overexpression has been associated with
poor prognosis in osteosarcoma [14]. Selective COX-2
inhibitors have been shown to significantly reduce the
cell proliferation rates as well as invasiveness in U2OS
cells [15]. Transgenic mice overexpressing human
COX-2 in mammary glands developed focal mammary
gland hyperplasia, dysplasia and metastatic tumors [16].
Epidemiological studies have revealed a decreased risk
of colon cancer in people who regularly take COX-2
inhibitors [17,18]. Specifically, COX-2 silencing
mediated by RNA interference (RNAi) has been found
to be associated with decreased invasion in laryngeal
carcinoma [19] and human colon carcinoma. In this
report, for the first time, we employed RNAi technology
to explore the therapeutic potential of the DNA vector-
based shRNA targeting COX-2 for the treatment of
human osteosarcoma. Moreover, the mechanism under-
lying inhibition of angiogenesis and metastasis by tar-
geting COX-2 is not fully understood. Another aim of
this study was to establish whether there is a direct rela-
tionship between COX-2 expression and VEGF, EGF
and bFGF production in osteosarcoma cells.
Methods
Cell culture and infection
The human osteosarcoma cell line, SaOS2 and 293T
cells were purchased from the American Type Culture
Collection. Cells were grown in 5% CO2 saturated
humidity, at 37°C and cultured in DMEM (Gibco, USA)
supplemented with penicillin/streptomycin, 2 mmol/L
glutamine and 10% FBS. Cells were subcultured at 9 ×
10
4
cells per well into 6-well tissue culture plates. After
24 h culture, cells were infected with recombinant lenti-
virus vectors at a multiplicity of infection (MOI) of 40.
Design of shRNA and plasmid preparation
We designed and cloned a shRNA template into a lenti-
virus vector previously used [5]. A third generation self-
inactivating lentivirus vector pGCL-GFP containing a
CMV-driven GFP reporter and a U6 promoter upstream
of the cloning sites. Three coding regions corresponding to
targeting human COX-2 (GenBank Accession:
NM 000963.2) were selected as siRNA target sequences
(Table 1) under the guide of siRNA designing software
offered by Genscript. We constructed three shRNA-COX-2
lentivirus vectors, namely LV-COX-2siRNA-1, LV-COX-
2siRNA-2 and LV-COX-2siRNA-3, respectively. To detect
the interference effects of different target, COX-2 mRNA
and protein levels were determined using RT-PCR and wes-
tern blotting. Recombinant lentivirus vectors and control
lentivirus vector were produced by co-transfecting with the
lentivirus expression plasmid and packaging plasmids in
293T cells. Infectious lentiviruses were harvested 48 h post-
transfection, centrifuged and filtered through 0.45 um cellu-
lose acetate filters. The infectious titer was determined by
hole-by-dilution titer assay. The virus titers produced were
approximately 10
9
transducing u/ml medium.
Cell proliferation assay
Cell proliferation was determined by 3-(4,5-dimethylthia-
zole-2-yl)-2,5-diphenyltetrazolium bromide (MTT) assay.
SaOS2 cells were seeded in 96-well culture plates in cul-
ture medium at an optimal density (4 × 10
3
cells per
well) in triplicate wells for the parental, LV-Control and
LV-COX-2siRNA cells. After 1, 2, 3, 4 and 5 d, cells were
stained with 20 ml MTT (5 mg/ml) (Sigma, St Louis,
MO, USA) at 37°C for 4 h and subsequently made solu-
ble in 150 ml of DMSO. Absorbance was measured at
490 nm using a microtiter plate reader. Cell growth
curves were calculated as mean values of triplicates per
group.
Flow cytometry
Cells were collected and washed with PBS, then centri-
fuged at 800 r/min and fixed with 70% cold ethanol
kept at 4°C overnight. Cells were permeabilized in
reagent consisting of 0.5% Triton X-100, 230 μg/ml
RNase A and 50 μg/ml propidium iodide in PBS. Sam-
ples were kept at 37°C for 30 min, followed by flow
cytometry analysis (Becton Dickinson FACScan).
Real-time PCR
Total RNA was extracted from cultured cells using
Trizol reagent (Invitrogen, USA) for reverse transcrip-
tion. RNA were synthesized to cDNA using Superscript
First-Strand Synthesis Kit (Promega, USA) following the
manufacturer’s protocols. Quantitative real-time poly-
merase chain reaction (RT-PCR) assays were carried out
using SYBR Green Real-Time PCR Master Mix (Toyobo,
Osaka, Japan) and RT-PCR amplification equipment
using specific primers: COX-2, sense strand 5’-
CCCTTGGGTGTCAAAGGTAAA-3’, antisense strand
5’-AAACTGATGCGTGAAGTGCTG-3’,COX-1,sense
strand 5’-ATGCCACGCTCTGGCTACGTG-3’,anti-
sense strand 5’-CTGGGAGCCCACCTTGAAGGAGT-
3’,b-actin, sense strand 5’-GCGAGCACAGAGCCTCG
CCTTTG-3’, antisense strand 5’-GATGCCGTGCTC-
GATGGGGTAC-3’, VEGFA sense strand 5’-CGTGTAC
GTTGGTGCCCGCT-3’, antisense strand 5’-TCCTT
CCTCCTGCCCGGCTC-3’,VEGFBsensestrand5’-
CCCAGCTGCGTGACTGTGCA-3’, antisense strand
Zhao et al.Journal of Experimental & Clinical Cancer Research 2011, 30:26
http://www.jeccr.com/content/30/1/26
Page 2 of 9

5’-TCAGCTGGGGAGGGTGCTCC-3’,VEGFCsense
strand 5’-TGTTCTCTGCTCGCCGCTGC-3’,antisense
strand 5’-TGCATAAGCCGTGGCCTCGC-3’,EGF
sense strand 5’-TGCTCCTGTGGGATGCAGCA-3’,
antisense strand 5’-GGGGGTGGAGTAGAGTCAAGA-
CAGT-3’, bFGF sense strand 5’-CCCCAGAAAACCC
GAGCGAGT-3’, antisense strand 5’-GGGCACCGC
GTCCGCTAATC-3’,Theexpressionofinterestgenes
were determined by normalization of the threshold cycle
(Ct) of these genes to that of the control b-actin.
Western blotting
Cells were lysed in RIPA buffer (150 mM NaCl, 100 mM
Tris-HCl, 1% Tween-20, 1% sodium deoxycholate and
0.1% SDS) with 0.5 mM EDTA, 1 mM PMSF, 10 μg/ml
aprotinin and 1 μg/ml pepstatin. Proteins were resolved
in SDS-PAGE and transferred to PVDF membranes,
which were probed with appropriate antibodies, The
immunoreactive protein complexes were detected by
enhanced chemiluminescence (Amersham Bioscience,
Boston, MA). The specific antibody used: anti-COX-2
antibody (Cell Signaling, #4842, 1 μg/ml), anti-VEGFA
antibody (Abcam, ab51745, 0.1 μg/ml), anti-VEGFB anti-
body (Cell Signaling, #2463, 1 μg/ml), anti-VEGFC
antibody (Cell Signaling, #2445, 1 μg/ml), anti-EGF
antibody (Cell Signaling, #2963, 1 μg/ml), anti-bFGF
antibody (Cell Signaling, #8910, 1 μg/ml), anti-b-actin
antibody (Cell Signaling, #4970, 1 μg/ml).
Invasion assay
Invasion by SaOS2 cells was assayed using 12-well cell
culture chambers containing inserts with 8 μmpores
coated with matrigel (Corning, USA). The cells were
added to the upper chamber at a density of 4 × 10
4
cells/insert, After 24 h of incubation, cells on the upper
surface were wiped off with a cotton swab. Cells that
had invaded the lower surface were fixed with 70%
ethanol, stained with 0.2% crystal violet, Invasiveness
was quantitated by selecting ten different views (100
times) and calculating the number of invading cells.
Migration assay
Migration assays were performed using two-chamber-
Transwell (Corning, USA) as described previously [20].
The lower surface of a polycarbonate filter with 8 μm
pores was coated with 1 μg/ml bovine collagen IV. Cells
were trypsinized and suspended in a serum-free medium
containing 1% BSA at a concentration of 4 × 10
4
cells/
insert. The cells were placed in the upper chamber and
free DMEM was placed in the lower chamber. After
12 hr at 37°C, the cells in the upper chamber were
wiped off with a cotton swab. The cells on the lower
surface of the filter were fixed with 70% ethanol, stained
with 0.2% crystal violet, migration was quantitated by
selecting ten different views (100 times) and calculating
the number of migrated cells.
Statistical analysis
All statistical analyses were performed using SPSS 10.0.
Data were expressed as mean ± SD. The statistical cor-
relation of data between groups was analyzed by one-
wayanalysisofvariance(ANOVA)andStudent’sttest,
where P< 0.05 were considered significant.
Results
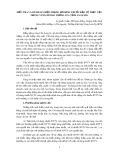
Selection of the most effective COX-2 specific shRNA
expression vector
To exclude off-target silencing effects mediated by spe-
cific shRNA, we employed three different COX-2
shRNAs (shRNA1, shRNA2, shRNA3). Three specific
plasmids and the control plasmid were cotransfected
with packing plasmid into 293T cells, respectively. 48 h
after transfection, GFP expression in 293T cells was
observed under a fluorescent microscope (Figure 1a).
Table 1 Interfering sequence specified for COX-2 gene
Sequence
LV-COX-2siRNA-1 Oligo1: 5’TaaACACAGTGCACTACATACTTAtcaagagTAAGTATGTAGTG
CACTGTGTTTTTTTTTC3’
Oligo2: 5’TCGAGAAAAAAaaACACAGTGCACTACATACTTActcttgaTAA
GTATGTAGTGCACTGTGTTTA3’
LV- COX-2siRNA-2 Oligo1: 5’TaaTCACATTTGATTGACAGTCCAtcaagagTGGACTGTCAATC
AAATGTGA TTTTTTTTC3’
Oligo2: 5’TCGAGAAAAAAaaTCACATTTGATTGACAGTCCActcttgaTGG
ACTGTCAATCAAATGTGATTA3’
LV- COX-2siRNA-3 Oligo1: 5’TaaCCTTCTCTAACCTCTCCTATTtcaagagAATAGGAGAGGTT
AGAGAAGGTTTTTTTTC3’
Oligo2: 5’TCGAGAAAAAAaaCCTTCTCTAACCTCTCCTATTctcttgaAAT
AGGAGAGGTTAGAGAAGGTTA3’
The three interfering sequence targeted for human COX-2 gene were named LV-COX-2siRNA-1, LV-COX-2siRNA-2 and LV-COX-2siRNA-3, whose coding regions
were corresponding to directly at human COX-2 (NM 000963.2) starting at 352, 456 and 517, respectively.
Zhao et al.Journal of Experimental & Clinical Cancer Research 2011, 30:26
http://www.jeccr.com/content/30/1/26
Page 3 of 9
The level of COX-2 expression was evaluated by RT-PCR
and western blotting. Results indicated that all of the
COX-2shRNA-1, shRNA-2 and shRNA-3 significantly
decreased the COX-2 mRNA and protein levels in 293T
cells. According to the results, LV-COX-2siRNA-1 was
the most effective lentivirus vector, and was used in the
following experiments (Figure 1b and 1c).
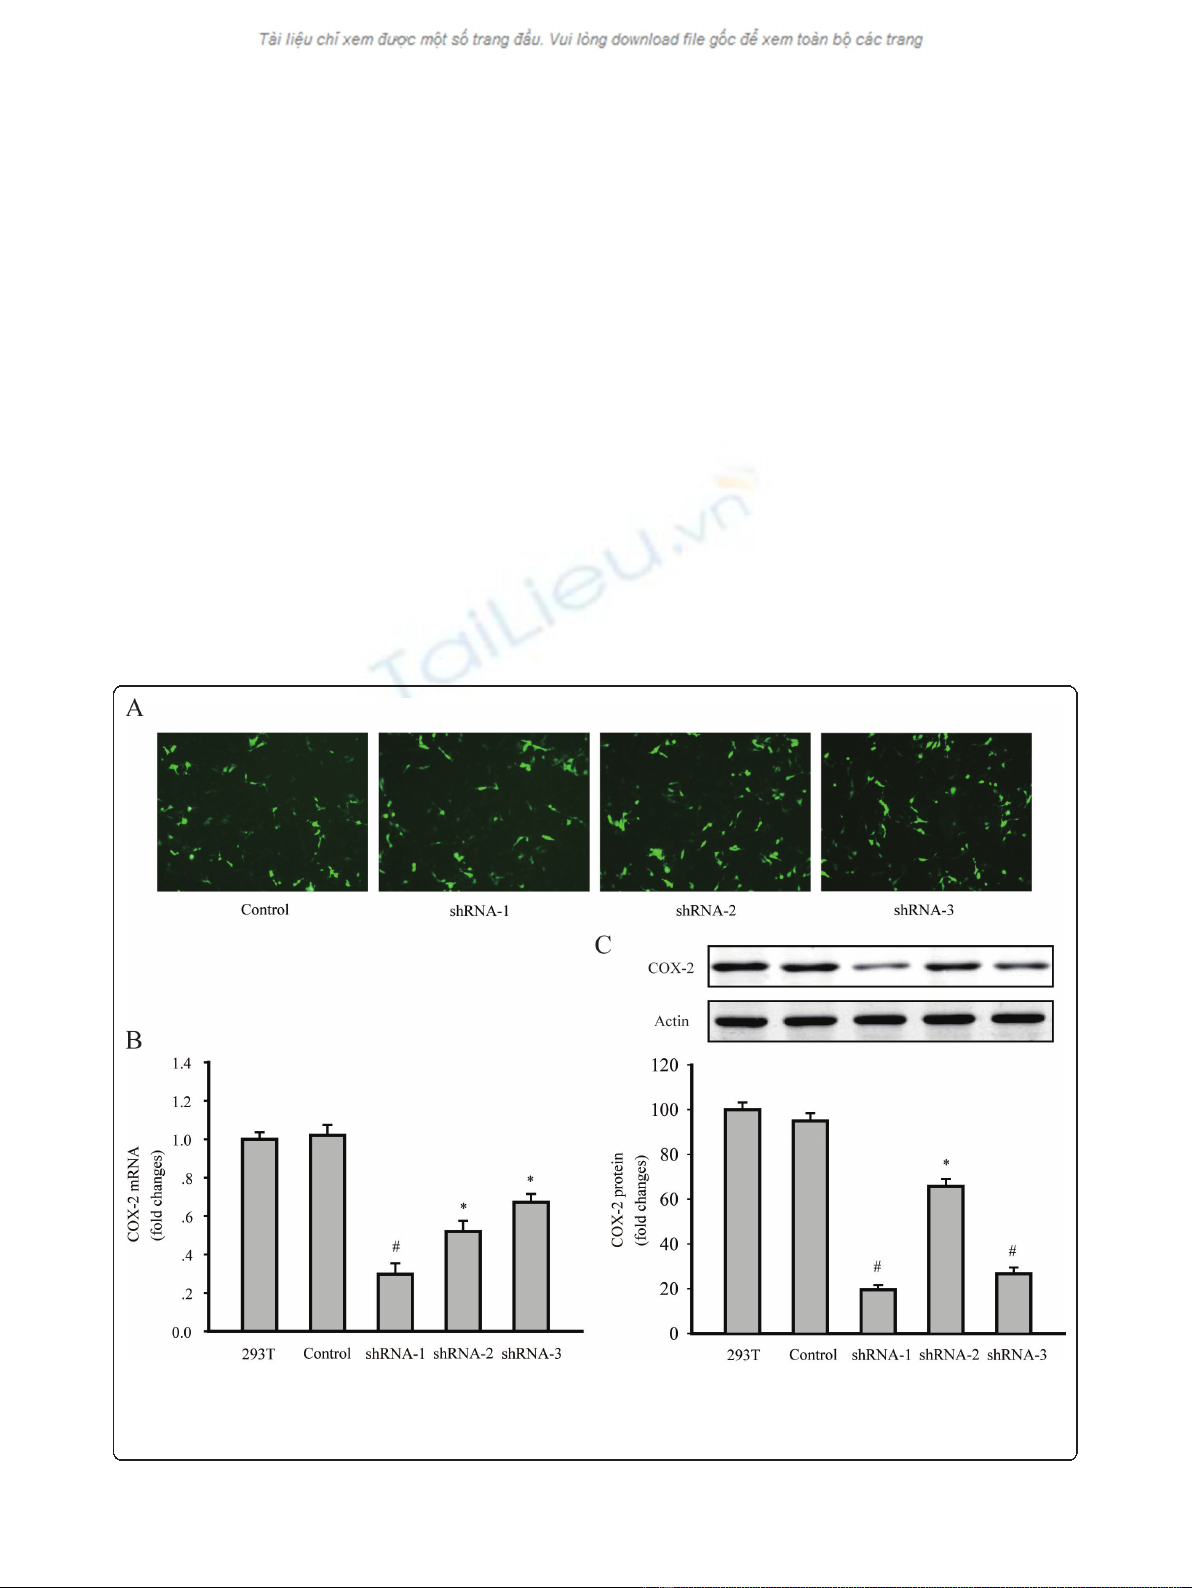
Downregulation of COX-2 expression by LV-COX-2siRNA-1
in SaOS2 cells
To explore the effect of LV-COX-2siRNA-1 on the
expression of COX-2, GFP expression was observed
under a fluorescent microscope in SaOS2 cells 72 h after
infection with LV-COX-2siRNA-1 (Figure 2a). RT-PCR
was employed to test the mRNA levels of COX-2 in par-
ental, LV-Control and LV-COX-2siRNA-1 cells. The
results indicated that LV-COX-2siRNA-1 significantly
inhibited mRNA (P= 0.0001) and protein (data not
shown) levels of COX-2 compared with the LV-Control
and parental SaOS2 cells (Figure 2b). We also found that
LV-COX-2siRNA-1 did not affect the COX1 mRNA level
in SaOS2 cells compared with the LV-Control and paren-
tal SaOS2 cells (Figure 2c), which indicated the efficacy
and specificity of LV-COX-2siRNA-1.
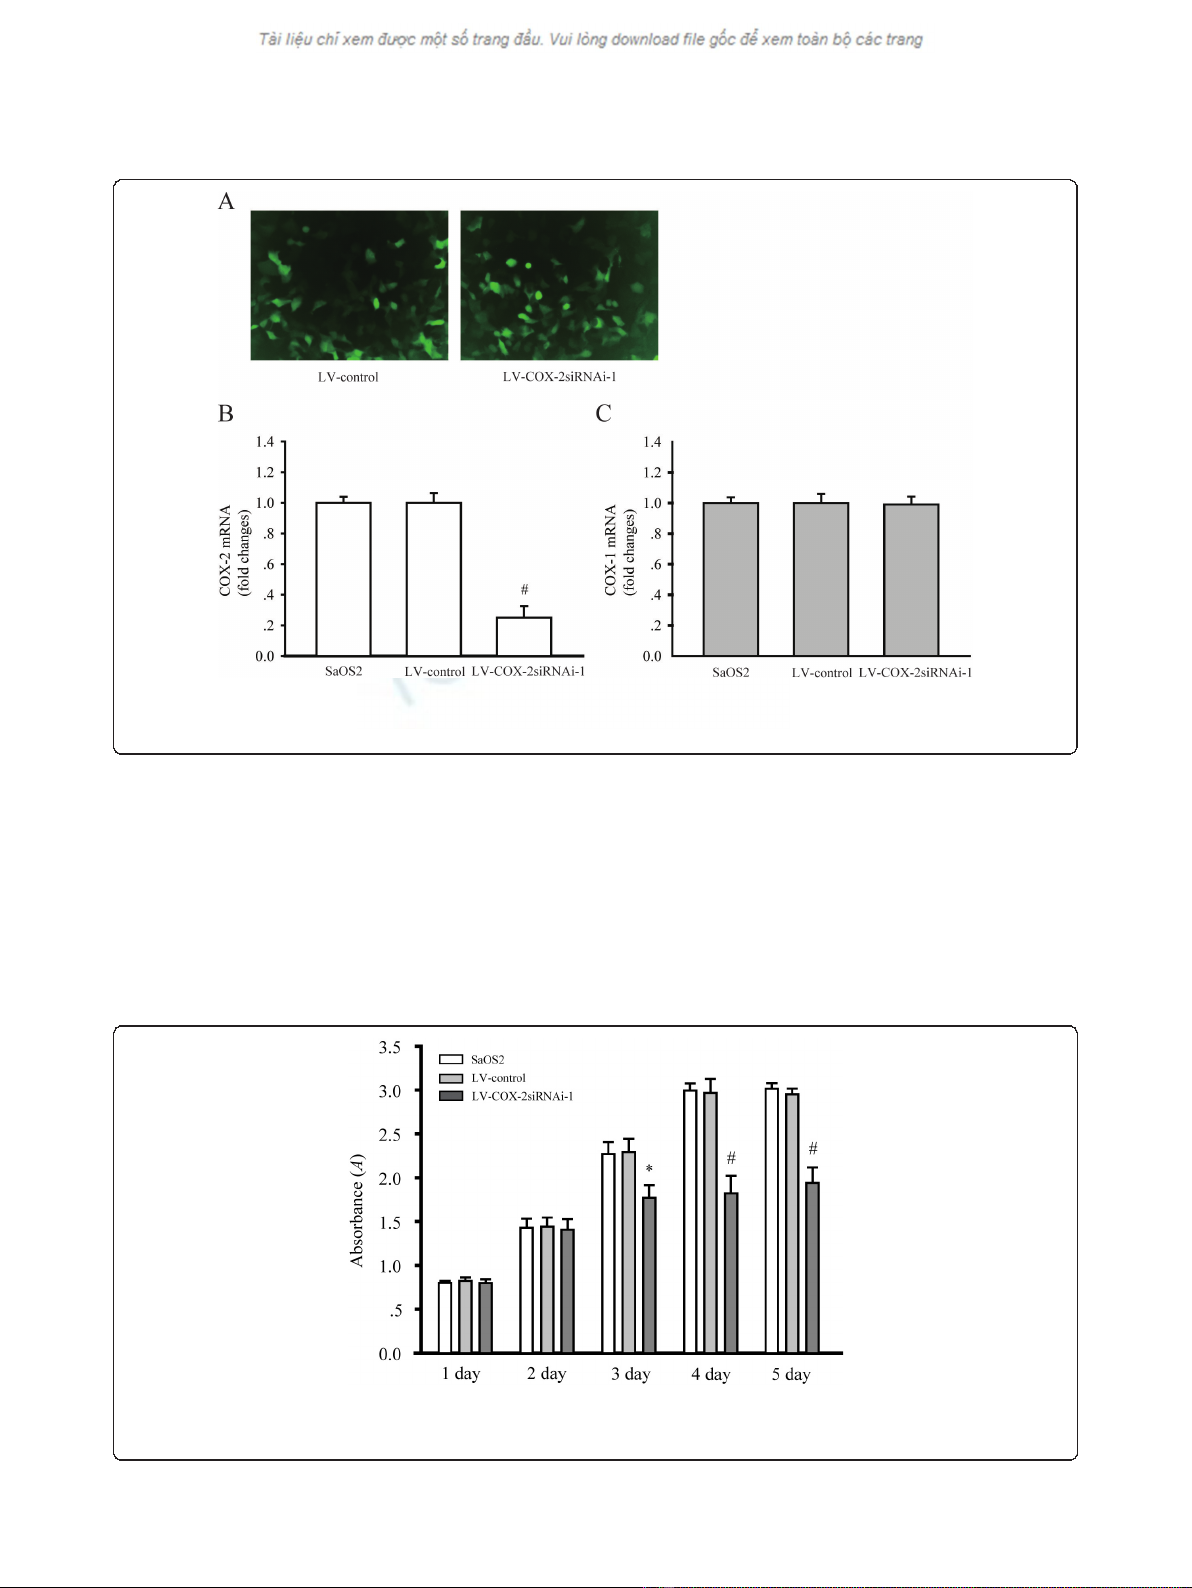
Effects of LV-COX-2siRNA-1 on cell growth of SaOS2 cells
To determine the effects of LV-COX-2siRNA-1 on cell
proliferation, MTT assays were performed to examine
the cell proliferation activity. Cell proliferation was
monitored for five days after SaOS2 cells were infected
with LV-COX-2siRNA-1 or LV-Control. As shown in
Figure 3a, the growth of cells infected with LV-COX-
2siRNA-1 was significantly inhibited compared with LV-
Control and parental SaOS2 cells.
Effects of LV-COX-2siRNA-1 on cell cycle of SaOS2 cells
The effects of LV-COX-2siRNA-1 on the cell cycle of
SaOS2 cells were examined and each experiment was
performed in triplicate. SaOS2 cells were infected with
LV-COX-2siRNA-1; 72 h after cell proliferation, G1, G2
Figure 1 Downregulation of COX-2 expression in 293T cells by shRNA transfection. (A) GFP expressed 48 h after the transfection of the
control, shRNA1, shRNA2 and shRNA3 plasmid in 293T cells, under a fluorescent microscope, respectively. (magnification 200 ×). (B) COX-2
mRNA levels were detected by RT-PCR. (C) COX-2 protein levels were detected by western blotting. Data are presented as mean ± s.e.m. * P<
0.01, # P< 0.001, compared with untransfected 293T cells group or control plasmid transfected cells group.
Zhao et al.Journal of Experimental & Clinical Cancer Research 2011, 30:26
http://www.jeccr.com/content/30/1/26
Page 4 of 9
and S phase of cells were detected by flow cytometric
analysis. The percentage of SaOS2 cells infected with
LV-COX-2siRNA-1 in the G1 phase significantly
increased, while the percentage in the G2 phase notably
decreased compared with LV-Control and parental
SaOS2 cells. This indicates that RNAi-mediated downre-
gulation of COX-2 expression in SaOS2 cells leads to
cell cycle arrest in the G1 phase (Table 2).
Effects of LV-COX-2siRNA-1 on invasion and migration
ability of SaOS2 cells
Matrix invasion and migration abilities of cancer cells
are associated closely with metastatic potential. The
in vitro cell invasion and migration assay were per-
formed and the number of invading and migrating cells
were counted. Invasion and migration activity of SaOS2
cells were assessed in the various transfectants.
Figure 2 COX-2 expression was inhibited by LV-COX-2siRNAi-1 in SaOS2 cells. (A) SaOS2 cells infected with LV-Control and LV-COX-
2siRNAi-1. GFP expressed 48 h after the infection (magnification 40 ×). COX-2 (B), but not COX-1 (C) mRNA level was significantly inhibited by
LV-COX-2siRNAi-1. Data are presented as mean ± s.e.m. # P< 0.001, compared with LV-Control and parental SaOS2 cell group.
Figure 3 Osteosarcoma cells proliferation were assessed by MTT assays. The growth of SaOS2 cells in 96-well plates applied to absorbance
at 490 nm were detected on day 1, 2, 3, 4 and 5, respectively. Data are presented as mean ± s.e.m. # P< 0.001, compared with LV-Control and
parental SaOS2 cell group.
Zhao et al.Journal of Experimental & Clinical Cancer Research 2011, 30:26
http://www.jeccr.com/content/30/1/26
Page 5 of 9


![Vaccine và ứng dụng: Bài tiểu luận [chuẩn SEO]](https://cdn.tailieu.vn/images/document/thumbnail/2016/20160519/3008140018/135x160/652005293.jpg)