http://www.iaeme.com/IJM/index.asp 395 editor@iaeme.com
International Journal of Management (IJM)
Volume 7, Issue 7, November–December 2016, pp.395–405, Article ID: IJM_07_07_044
Available online at
http://www.iaeme.com/ijm/issues.asp?JType=IJM&VType=7&IType=7
Journal Impact Factor (2016): 8.1920 (Calculated by GISI) www.jifactor.com
ISSN Print: 0976-6502 and ISSN Online: 0976-6510
© IAEME Publication
COMPARISON OF EMPLOYEE BRANDING THROUGH
DISCRIMINANT ANALYSIS
Dr. D.K. Ghosh
UGC BSR Faculty Fellow, Retired Professor and Head of Statistics Department,
Saurashtra University, Rajkot, India
Shweta S. Kulshrestha
Assistant Professor, School of Management, RK. University, Rajkot, Gujarat, India
ABSTRACT
The company needs to maintain the employee brand and due to which the satisfaction level of the
employee is maintained and the effectiveness of the organisation can be improved. In my data
analysis I have collected the data from the employees of Amul group of companies, Balaji Wafers
Prvt. Ltd., Echjay Industries Prvt. Ltd., Falcon Pump Prvt. Ltd., P.M. Diesels Prvt. Ltd., Jyoti CNC
Prvt. Ltd., Kadwani Forge Ltd., Patel Brass Work Prvt. Ltd., Saral group of Industries and Thirth
Agro Technology Prvt. Ltd. I have collected the data through preparation of questionnaire and have
analyzed the data using discriminate analysis for analyzing the employee branding impacting the
organizational success through SPSS software. Through the Analysis it is clear that if the companies
are able to maintain employee Branding then they will definitely earn profit through the most
important factor i.e. satisfaction of employees which is converted into customers satisfaction.
Key words: Employee Branding, Customer Satisfaction, Favorable Reputation, Employee
Satisfaction
Cite this Article: Dr. D.K. Ghosh and Shweta S. Kulshrestha, Comparison of Employee Branding
Through Discriminant Analysis. International Journal of Management, 7(7), 2016, pp. 395–405.
http://www.iaeme.com/IJM/issues.asp?JType=IJM&VType=7&IType=7
1. INTRODUCTION TO DISCRIMINANT ANALYSIS
The term discriminant analysis (Fisher; 1936; Cooley and Lohnes; 1971; Tatsuoka; 1971; Kshirsagar; 1972;
Lachenbruch; 1975, 1979; Gnanadesikan; 1977; Klecka; 1980; Hand; 1981, 1982; Silverman; 1986) refers
to several different types of analyses. Classificatory discriminant analysis is used to classify observations
into two or more known groups on the basis of one or more quantitative variables. Classification can be done
by either a parametric method or a nonparametric method in the DISCRIM procedure. A parametric method
is appropriate only for approximately normal within-class distributions. The method generates either a linear
discriminant function (the within-class covariance matrices are assumed to be equal) or a quadratic
discriminant function (the within-class covariance matrices are assumed to be unequal).
When the distribution within each group is not assumed to have any specific distribution or is assumed
to have a distribution different from the multivariate normal distribution, nonparametric methods can be used

Dr. D.K. Ghosh and Shweta S. Kulshrestha
http://www.iaeme.com/IJM/index.asp 396 editor@iaeme.com
to derive classification criteria. These methods include the kernel method and nearest-neighbor methods.
The kernel method uses uniform, normal, Epanechnikov, biweight, or triweight kernels in estimating the
group-specific density at each observation. The within-group covariance matrices or the pooled covariance
matrix can be used to scale the data.
The performance of a discriminant function can be evaluated by estimating error rates (probabilities of
misclassification). Error count estimates and posterior probability error rate estimates can be evaluated with
PROC DISCRIM. When the input data set is an ordinary SAS data set, the error rates can also be estimated
by cross validation.
In multivariate statistical applications, the data collected are largely from distributions different from the
normal distribution. Various forms of nonnormality can arise, such as qualitative variables or variables with
underlying continuous but nonnormal distributions. If the multivariate normality assumption is violated, the
use of parametric discriminant analysis might not be appropriate. When a parametric classification criterion
(linear or quadratic discriminant function) is derived from a nonnormal population, the resulting error rate
estimates might be biased.
If your quantitative variables are not normally distributed, or if you want to classify observations on the
basis of categorical variables, you should consider using the CATMOD or LOGISTIC procedure to fit a
categorical linear model with the classification variable as the dependent variable. Press and Wilson (1978)
compare logistic regression and parametric discriminant analysis and conclude that logistic regression is
preferable to parametric discriminant analysis in cases for which the variables do not have multivariate
normal distributions within classes. However, if you do have normal within-class distributions, logistic
regression is less efficient than parametric discriminant analysis. Efron (1975) shows that with two normal
populations having a common covariance matrix, logistic regression is between one-half and two-thirds as
effective as the linear discriminant function in achieving asymptotically the same error rate.
Do not confuse discriminant analysis with cluster analysis. All varieties of discriminant analysis require
prior knowledge of the classes, usually in the form of a sample from each class. In cluster analysis, the data
do not include information about class membership; the purpose is to construct a classification. See Chapter
11, Introduction to Clustering Procedures.
Canonical discriminant analysis is a dimension-reduction technique related to principal components and
canonical correlation, and it can be performed by both the CANDISC and DISCRIM procedures. A
discriminant criterion is always derived in PROC DISCRIM. If you want canonical discriminant analysis
without the use of a discriminant criterion, you should use PROC CANDISC. Stepwise discriminant analysis
is a variable-selection technique implemented by the STEPDISC procedure. After selecting a subset of
variables with PROC STEPDISC, use any of the other discriminant procedures to obtain more detailed
analyses. PROC CANDISC and PROC STEPDISC perform hypothesis tests that require the within-class
distributions to be approximately normal, but these procedures can be used descriptively with nonnormal
data.
Another alternative to discriminant analysis is to perform a series of univariate one-way ANOVAs. All
three discriminant procedures provide summaries of the univariate ANOVAs. The advantage of the
multivariate approach is that two or more classes that overlap considerably when each variable is viewed
separately might be more distinct when examined from a multivariate point of view.
Multiple linear regression method is used to predict an outcomes. However, multiple linear regression is
limited to cases where the dependent variable on the Y axis is an interval variable so that the combination of
predictors will, through the regression equation, produce estimated mean population numerical Y values for
given values of weighted combinations of X values. But many interesting variables are categorical.
For Eg. Marine/non-marine status, making a profit or not, holding a particular credit card, renting or
paying a mortgage for a house, employed/unemployed, satisfaction v/s dissatisfaction of employees, which
customers like to buy a product or not to buy and satisfaction or not satisfaction of employee branding.

Comparison of Employee Branding Through Discriminant Analysis
http://www.iaeme.com/IJM/index.asp 397 editor@iaeme.com
In such cases it is not advisable to use multiple linear regressions. Instead of multiple linear regressions
one must use another method for prediction. One of such method is discriminant analysis method. In other
words we can say that discriminant analysis can also be used for predicting an outcome considering the
above facts we can say that discriminant analysis is used for the following situations:
• The dependent variable is categorical at an interval level such as age, sex, income attributes, year of education,
and perception etc. It is also to be noted that as in the case of multiple linear regression, the dummy variable
also can be used as predictors in case of discriminant analysis. Moreover logistic discriminant analysis method
also can be used for any level of measurements.
• There are more than two dependent categorical unlike logistic regression method which is limited to a
dichotomous dependent variable.
In our investigation our problem is to find whether the employee branding is satisfying the organizational
brand and creates a competitive tool or not i.e. our dependent variables are of two categories (1) yes or (2)
no. Hence it will be more appreciable to apply discriminant analysis method for such problems.
Null hypothesis (H
0
): Organizational branding does not have a significant difference in the working
conditions of the employee in their respective organization.
Alternate Hypothesis (H
1
): Organizational branding have a significant difference in the working conditions
of the employee in their respective organization.
Next we will discuss the linear equation.
1.1. Discriminant Analysis Linear Equation
Discriminant analysis method, requires
the determination
of a linear equation like regression that will predict
which group the case belongs to. The methodical model of discriminant analysis linear equation is given by:
Where D = discriminate function
v = the discriminant coefficient or weight for that variable
X = respondent’s score for that variable
a = a constant
i = the number of predictor variables
From figure 1 it is obvious that discriminant analysis linear equation or function is similar to a linear
regression equation or function. In case of linear regression b is called regression co-efficient, where beta is
called unstandardised coefficient. This maximizes the distance between the means of the dependent
variables.
Standardized co-efficient can also be used like b wigs in regression. However it is remarkable to note
that good predictors tend to have large weights. Also number of discriminant function is always 1, less than
number of groups. Here in our problem we have two group discriminant analyses (yes or no) so there is only
1 discriminant function.
1.2. Assumptions of Discriminant Analysis
The major underlying assumptions of DA are:
• The observations are a random sample.
• Each predictor variable is normally distributed.
• Each of the allocations for the dependent categories in the initial classification are correctly classified.
• There must be at least two groups or categories, with each case belonging to only one group so that the groups
are mutually exclusive and collectively exhaustive (all cases can be placed in a group).

Dr. D.K. Ghosh and Shweta S. Kulshrestha
http://www.iaeme.com/IJM/index.asp 398 editor@iaeme.com
• Each group or category must be well defined, clearly differentiated from any other group(s) and natural.
Putting a median split on an attitude scale is not a natural way to form groups. Partitioning quantitative
variables is only justifiable if there are easily identifiable gaps at the points of division.
• For instance, three groups taking three available levels of amounts of housing loan.
• The groups or categories should be defined before collecting the data.
• The attribute(s) used to separate the groups should discriminate quite clearly between the groups so that group
or category overlap is clearly non-existent or minimal.
• Group sizes of the dependent should not be grossly different and should be at least five times the number of
independent variables.
1.3. Process of Discriminant Analysis
The main aim of this statistical using discriminant analysis is to combine the variable scores is someway so
that a single new composite variable is produce. This is also called discriminant score. At the end of the
discriminant analysis process the intention would be made that each group will have a normal distribution
of discriminant scores. The degree of overlap between the discriminant scores distribution can then be used
as the major of the success of techniques.
In our investigation we have two different types of groups, for e.g. let us assume that the two different
groups are poor and good. So its discriminant distribution is shown in fig. 1:
Figure 1 Discriminanat distribution
From the figure 1 it is clear that the top two distributions overlap too much and do not discriminate very
good compared to the bottom sets. Hence the misclassification would be minimal in the lower pair. While
many will be misclassified in the top pair.
By standardizing the variables we ensure that scale differences between the variables are eliminated. So
when all the variables are standardized, absolute weights can be used to rank variables in terms of their
discriminant powers. Hence the largest weights have been associated with the most powerful discriminative
variable. Variables with large weights are those which contribute mostly in differentiating the groups.
In a two group situation, predictive membership is calculative by first producing a score or discriminant
for each case using the discriminant function. Then the cases with discriminant values smaller than cut off
value are classified, as belonging to one group while those with values larger are classified into other group.
The groups centriod is the mean value of the discriminant scores for a given category of the dependent
variable.
There are as many centroids as there are groups or categories. The cut off is the mean of the two centroids.
If the discriminant scores of the function is less than or equal to the cut off the case is classified as zero while
if it is above then it is classified as one.
Comparison of Employee Branding Through Discriminant Analysis
http://www.iaeme.com/IJM/index.asp 399 editor@iaeme.com
1.4. Materials and Method
Our aim in this investigation is based on analysis of impact of employees branding on the organizational
image and we want to know whether employee branding provides a good image to the organization in the
market or not. Thus if the response is yes then the corporate have to give an immense importance to the
employee branding to maintain its position as well as ongoing growth.
To study the importance of employee branding and its impact on the regular working of the organization
we have conducted the research in ten different companies including Amul Industries, Balaji Store, Echjay
Industries, Falcon Pumps, Field Marshal, Jyoti CNC, Kadwani Forgien, Patel Brass Company, Saral
Industries and Thirth Agrotech Company. The main investigation in my research of these organizations
include the working environment been provided to the employees in their respective organization and the
support from the management which in turn decides the level of work integrity from the sides of employees.
For the further study of my research work we have considered the random sample of 30 employees from
each industry working at different functional levels so as to justify my research work. The details of each
organization including the various ages of employees and their educational levels are been mentioned below
as per the details of the organization.
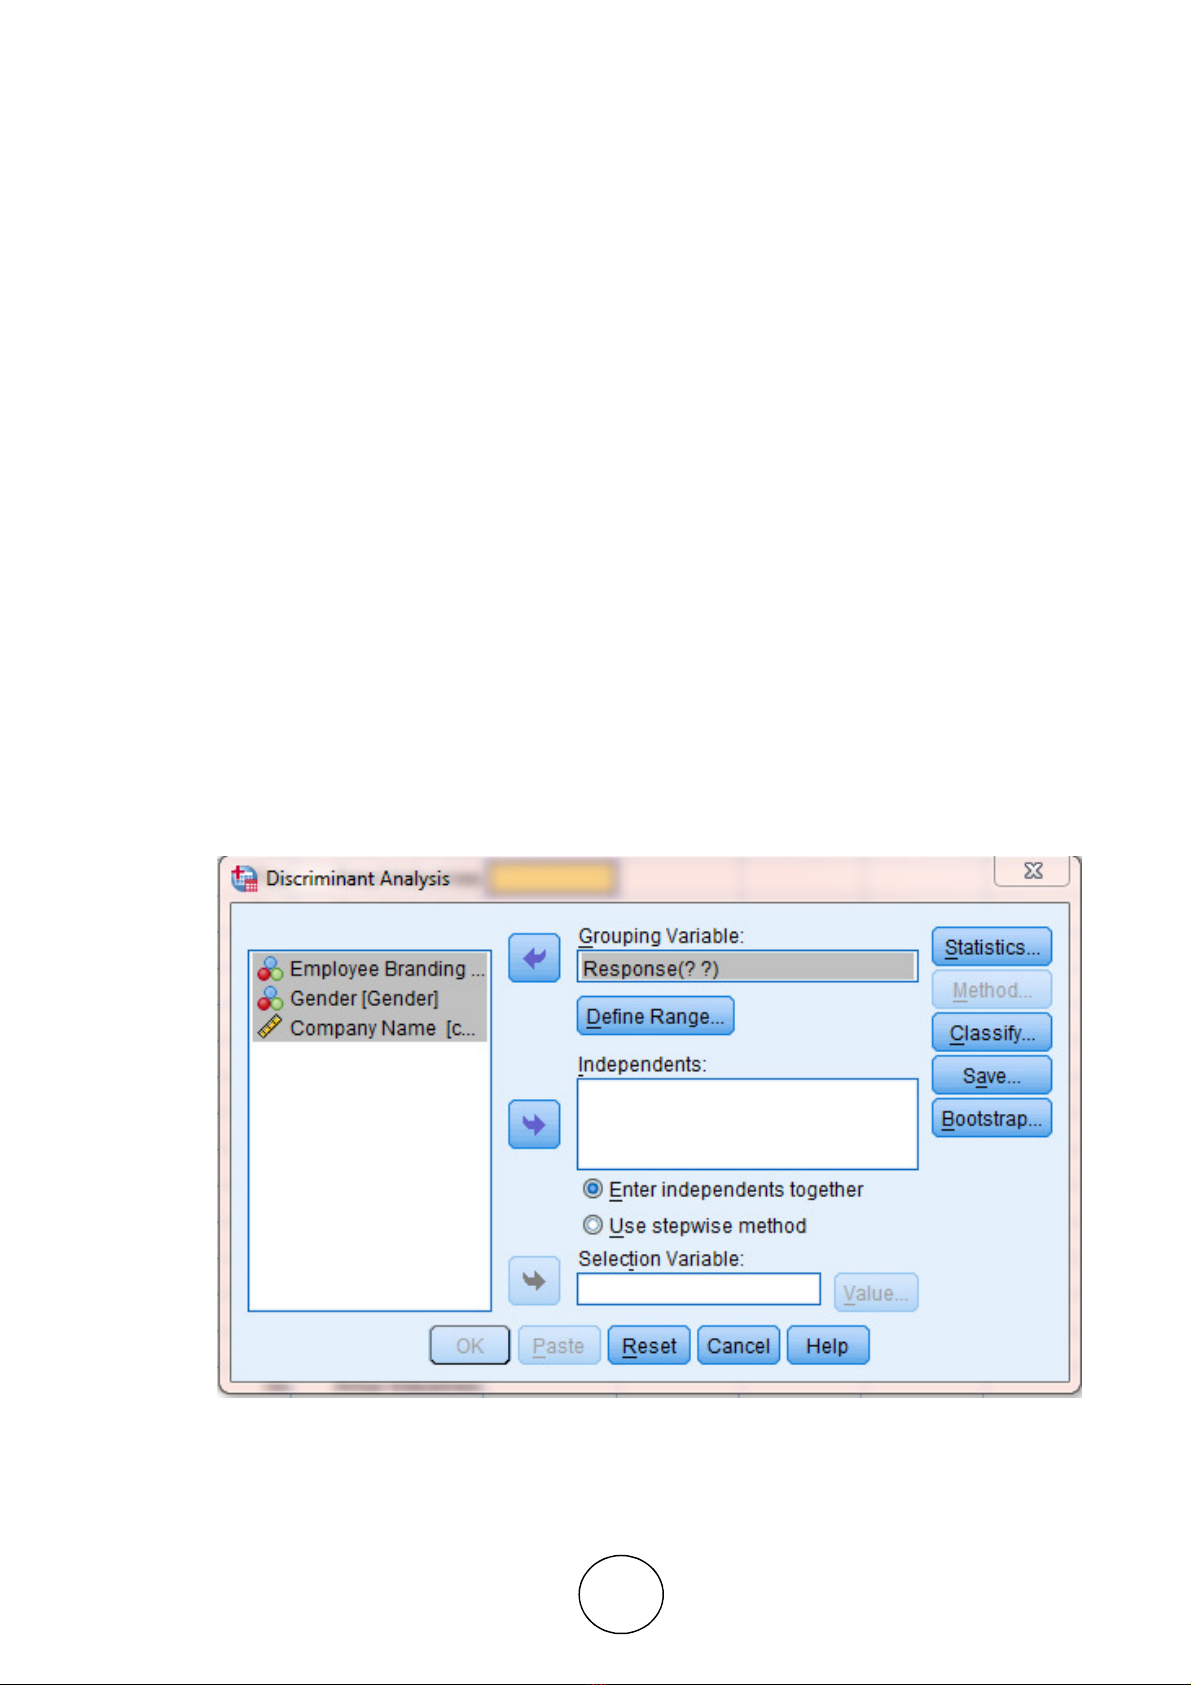
1.5. Conducting Discriminant Analysis
1.5.1. Discriminant analysis Dialogue Box:
• To find the significant result of the responses YES/NO for the employee branding of 10 companies for 19
categories we used SPSS technique where following steps are carried out:
• Analyze >> Classify >> Discriminant
• Select the employee response as our grouping variable is entered it into the grouping variable box. The below
given menu is displayed on the monitor.
Figure 2 Discriminant Analysis Dialogue Box: