
Engineering Solid Mechanics 3 (2015) 157-166
Contents lists available at GrowingScience
Engineering Solid Mechanics
homepage: www.GrowingScience.com/esm
Fatigue life prediction: A comparative study for a three layer EN45A parabolic leaf
spring
Krishan Kumar* and M. L. Aggarwal
Assistant Professor, Mechanical Deptt., YMCA University of Science & Technology, (A Haryana State Govt. University), Faridabad, Haryana, India
A R T I C L E I N F O A B S T R A C T
Article history:
Received 6 January, 2015
Accepted 10 May 2015
Available online
12 May 2015
There are literally several studies accomplished to predict the fatigue life of leaf springs but
estimation of fatigue life of a parabolic leaf spring by using CAE tools has not yet been
executed in the past. Parabolic spring is an important component in a vehicle suspension
system. It needs to have excellent fatigue life and in today’s scenario manufacturers rely on
constant loading fatigue analysis. The objective of this work is to perform the fatigue analysis
of parabolic leaf spring by three different methods where CAE analysis is performed to observe
the distribution of stress fatigue life and damage using Goodman approach. In this work, fatigue
life of the parabolic leaf spring is
determined as per SAE spring design manual and
experimentally by testing on full scale fatigue testing machine. ANSYS is used for CAE
solution for the prediction of leaf springs fatigue life considering stress theory. The fatigue life
estimated by all three modes is then compared for the purpose of validation. The methodology
used in this paper brings a practical approach to the professionals in the industries who are
engaged for design of mechanical components.
© 2015 Growing Science Ltd. All rights reserved.
Keywords:
Parabolic leaf spring
Fatigue life
CAE analysis
1. Introduction
A spring is an elastic devise used to store mechanical energy, usually made out of hardened steel.
Parabolic leaf spring is one of essential components in vehicle suspension system, which is commonly
used in many heavy vehicles. It requires to have an excellent static load bearing capacity as well as
fatigue life. Large vehicles require a good suspension system that can deliver a good ride and handling.
The leaf spring is required to absorb the vertical vibrations due to road irregularities based on variations
in the spring deflection to store the potential energy in spring as strain energy and to release slowly.
Fatigue failure is one of the major issues in automotive components because at fluctuating stresses the
vehicle structure may fail before achieving the failure stress of that material. That is why it is necessary
to withstand numerous numbers of cycles before failure or never fail at all during the service period.
This study is based on a numerical technique called the finite element method (FEM). Using FEA, the
* Corresponding author. Tel: +919896596710
E-mail addresses: er.krishanverma@yahoo.com (K. Kumar)
© 2015 Growing Science Ltd. All rights reserved.
doi: 10.5267/j.esm.2015.5.003

158
parabolic leaf spring as shown in Fig.1 is modeled using the discrete building blocks called elements.
Each element has some equations that describe how it responds to certain loads. The sum of the
response of all the elements in the model gives the total response of the design.
Fig.1: Parabolic Leaf Spring Assembly
Aggarwal and Chawla (2007) explained that fretting fatigue between leaves can be reduced by
careful control of shot peening parameters. The bending strength of EN45A parabolic leaf spring is
determined to be higher as compared with semi-elliptic leaf spring. Aggarwal et al. (2006 a) calculated
axial fatigue strength of EN45A spring steel specimen experimentally as a function of shot peening in
the conditions applied for full-scale leaf springs testing in industries. Optimum shot peening condition
for specimen has been determined to correlate with S/N curves of leaf springs. A mathematical model
has been developed to forecast the fatigue life of leaf springs for a given stress at varying shot peening
conditions. Predictions from this model are compared with experimental data. Aggarwal et al. (2006 b)
identified the effect of shot flowrate on surface roughness. Full-scale laboratory testing of EN45A
spring steel leaf springs was carried out to present improvement in fatigue life due to shot peening.
Double shot peening was performed on leaf springs and its effects on surface roughness, compressive
residual stress field, and fretting fatigue were noted. Aggarwal et al. (2005) evaluated axial fatigue
strength of EN45A spring steel, experimentally. The effect of almen intensity on compressive residual
stress has been discussed for fatigue life extension. Shot peening of leaf spring was illustrated to cause
improvement in fatigue strength, reduction in weight and reliability. Aggarwal (2012) reported that
residual stress field varies with shot peening intensity and affects weight of EN45A spring steel. A
stress approach model for weight reduction of leaf spring has been experimentally developed
simulating with industrial environment. Kanbolat et al. (2011) used a numerical approach to obtain the
fatigue life and the leaf geometry against the environmental condition on the base of material properties.
They presented a more precise method based on non-linear finite element solutions by evaluating the
effects of the production parameters, the geometrical tolerances and the variations in the characteristics
of the material. Scuracchio et al. (2013) described the role of shot peening in manufacturing leaf springs
for vehicles, through the analysis of residual stresses by X-ray diffraction and fatigue tests on a series
of samples that were subject to ten different peening schedules. Cerny and Mayer (2012) summarized
the most important results of selected experimental programs on static and fatigue strength of heavy
loaded components and joints made of glass reinforced plastic (GRP) composites, having been recently
performed in fatigue laboratory of the SVUM research and testing institute. Refngah et al. (2009a)
presented about fatigue life prediction based on finite element analysis and variable amplitude loading
(VAL). Service loading of parabolic spring has been collected using data acquisition system. Finite
element analysis (FEA) was performed on the spring model so stress and damage distribution can be
observed. Experimental works was done in order to validate the FEA result. In Refngah et al. (2009b)
finite element analysis was performed to analyze the stress distribution and behavior of both Multi-leaf
and parabolic spring. Time histories service loading data was analyzed and damage area was simulated
to predict the fatigue life of the components. Karthik et al. (2012) presented a fatigue life prediction
based on finite element analysis under non constant amplitude proportional loading. The fatigue life
simulation was performed using FEA and analyzed for different materials to observe the distribution

K. Kumar and M. L. Aggarwal / Engineering Solid Mechanics 3 (2015)
159
of stress and damage. Kumar et al. (2013) performed CAE simulation for static and dynamic analysis
of 65Si7 multi leaf spring and carried out a comparative study of CAE results with industrial
experimental output for validation of CAE simulation. Deflection, stress and fatigue life were the
parameters for this analysis. Kumar and Aggarwal (2013) carried out computer aided FEA simulation
of a three-layer EN45A parabolic leaf spring. The finite element analysis (FEA) of the leaf spring has
been carried out for deflection and stress and validated the work by performing the experiment with
industrial interaction. Kumar and Vijayarangan (2007) described static and fatigue analysis of steel and
composite multi leaf spring. The load carrying capacity, stiffness and weight of composite leaf spring
are compared with that of steel leaf spring analytically and experimentally. Fatigue life of steel and
composite leaf has also been predicted using life data analysis. Sustarsic et al. (2010) determined the
fatigue life of 51CrV4 spring steel in different loading modes for two different heat treatment conditions
using local stress gradient concept. Abdullah et al. (2008) simulated a parabolic leaf spring with
variable amplitude loading (VAL) for the fatigue life assessment. The fatigue life & damage using VAL
was predicted and the result was correlated with FEA. The objective of this work is to perform the
fatigue analysis of parabolic leaf spring by different methods. In this work fatigue life of the parabolic
leaf spring is determined as per SAE spring design manual and experimentally by testing on full scale
fatigue testing machine. ANSYS is used for CAE solution for the prediction of leaf springs fatigue life.
2. Fatigue life of leaf spring
Fatigue life is expressed by the number of deflection cycles, a leaf spring can withstand without
failure. The main factors contributing to fatigue life includes number of load cycles experienced, range
of stress and mean stress experienced in each load cycle. The best data are obtained by full-scale testing
of actual components under realistic conditions which is usually expensive, time consuming and gives
very specific results. In order to establish the fatigue life cycles which are acceptable in any spring
design, it is desirable to have road durability tests run over a prescribed course so that fatigue life test
data and actual road durability results may be correlated. It must be understood that the number of
estimated life cycles is a statistical average and that fatigue test results will show scatter even under
closely controlled test conditions. The extent of the scatter will depend on the consistency of surface
condition, fabrication and the general quality of the springs which are tested. A leaf spring used in
suspension will undergo a large number of cycles of small amplitude near the design load position
without failure. Under greater amplitude the number of cycles without failure will be reduced, since
the maximum stress as well as the stress range is increased, and both are determining factors in the
fatigue life of a spring. Fatigue failures are typically characterized as either low-cycle (<1,000 cycles)
or high-cycle (>1,000 cycles).Most of the metals have a characteristic response to cyclic stresses. These
materials have a threshold stress limit below which fatigue cracks will not initiate. This threshold stress
value is often referred to as the endurance limit. Endurance limit may be defined as the highest level of
alternating stress that a material can withstand without failure for infinite. The symbol for endurance
limit is 𝑆𝑆′𝑒𝑒. The endurance limit can be related to the tensile strength through the following relation
𝑆𝑆′𝑒𝑒= 0.5 × 𝑆𝑆𝑢𝑢𝑢𝑢
(1)
𝑆𝑆 𝑒𝑒 = ka × kb×𝑘𝑘𝑐𝑐×𝑆𝑆′𝑒𝑒
where ka is the surface factor, kb is the size factor (gradient factor), and kc is the load factor. Fatigue
life estimation using constant amplitude loading is a common practice to predict the fatigue life of leaf
springs. To get more accurate fatigue life prediction, the actual case condition also needs to be
considered. A fluctuating stress is a combination of static plus completely reversed stress. The
components of the stresses are Smin is minimum stress, Smax is the maximum stress, Sais the stress
amplitude or the alternating stress, Sm is the mean stress, ΔS is the stress range, and Ss is the steady or
static stress. The steady or static stress is not the same as the mean stress. It can have any value between
Smin and Smax. This steady stress exists because of a fixed load and is usually independent of the varying
160
portion of the load. The following relations between the stress components are useful and used to
describe the fluctuating stress as in Fig. 2.
Fig. 2. Alternating fluctuating stress curve
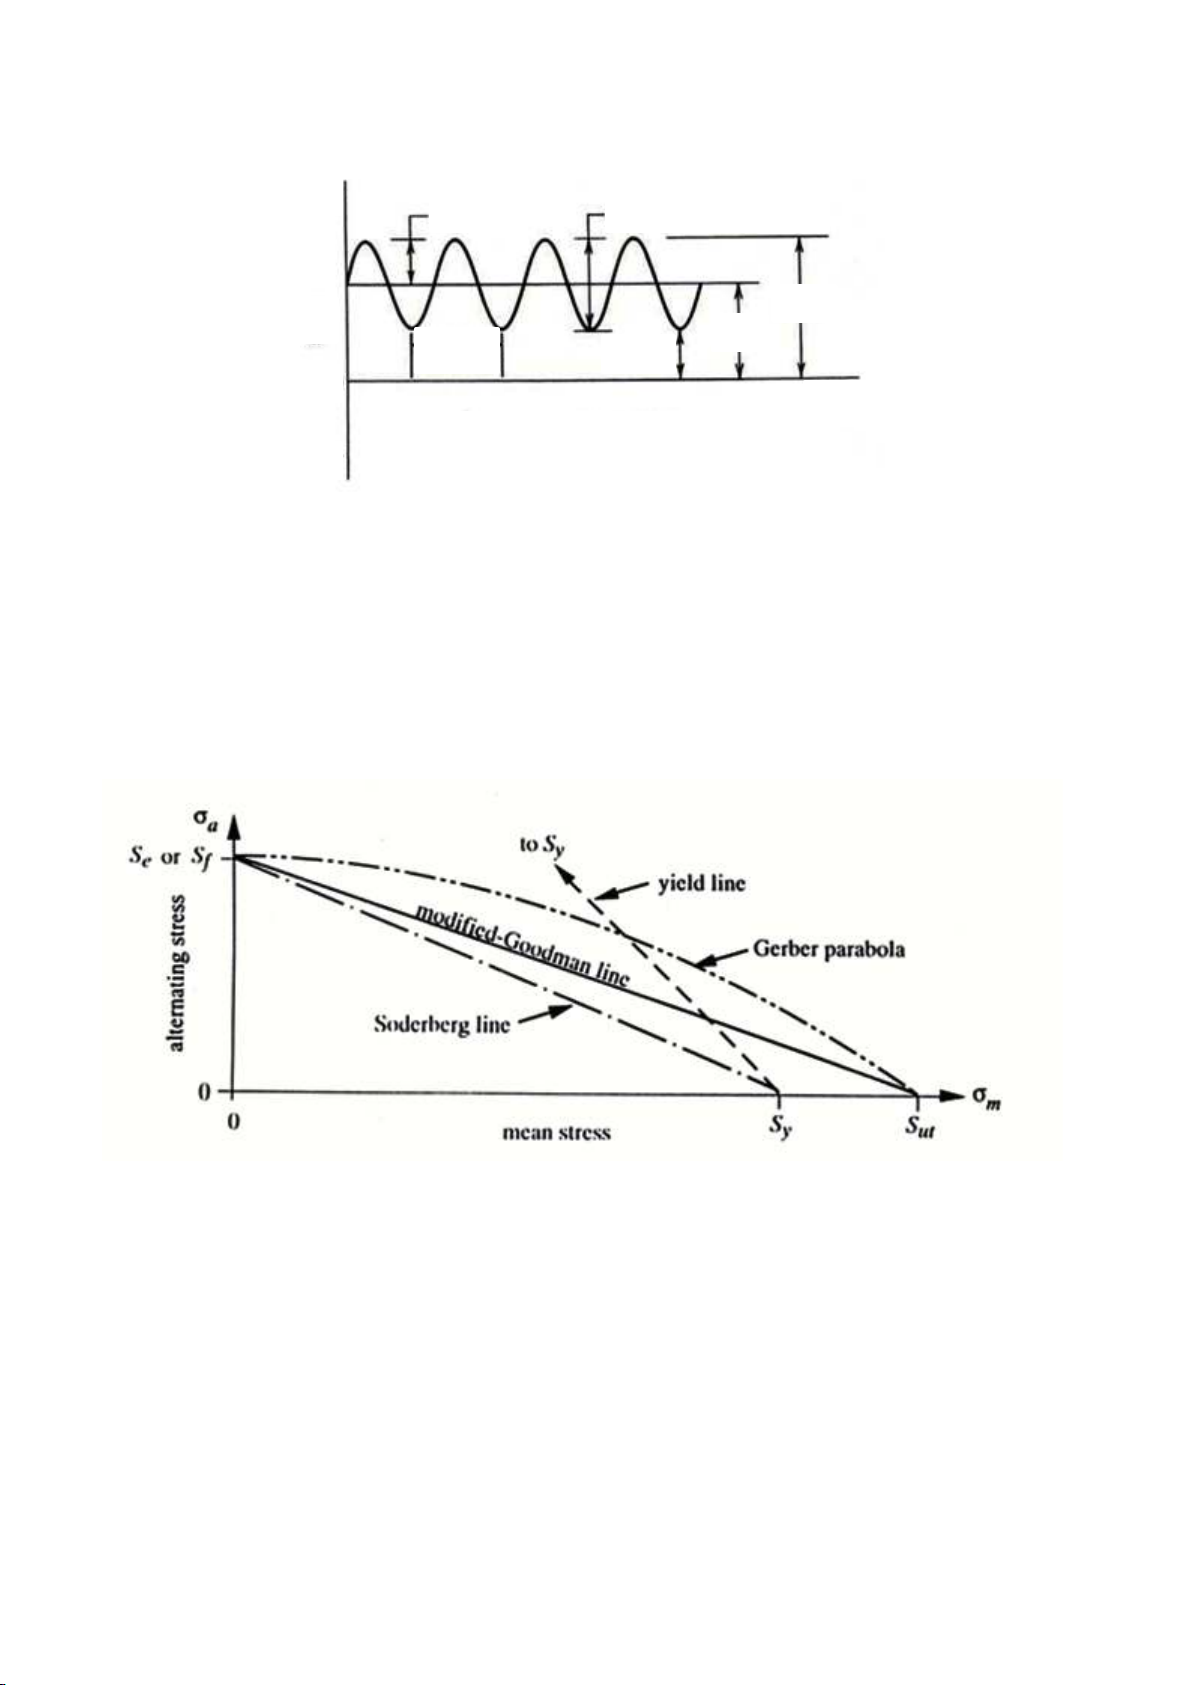
In predicting the life of a component, a more useful presentation of fatigue life test data is the
modified Goodman line diagram with relation of (Sa/Se+ Sm/ Sut =1). These diagrams, while still limited
by specimen geometry, surface condition, and material characteristics, afford the user to predict life at
any stress ratio. The most common format used in the spring industry has the minimum operating stress
along the x-axis while the maximum operating stress is along the y-axis as in Fig. 3. Sufficient test data
is generated to know the maximum and minimum stresses at various points that provide the same
known life. Each of these points is plotted on the diagram. A line is then drawn through these points.
Any combination of maximum and minimum stress that fall on the plotted line will be expected to have
the known life. Points below the line will have a longer life; points above the line represent shorter life.
Fig. 3. Different fatigue design criteria
The above discussion touched on the relationship between applied stress and expected life. For the
designer, it is critical that this relationship can be characterized so that fatigue life can be predicted.
One of the early methods for characterizing this relationship is the S-N curve. ‘S’ stands for the cyclic
stress range while ‘N’ represents the number of cycles to failure. To develop the curve, a series of
samples is tested to failure at various stress ranges. The resulting lives are plotted versus the
corresponding stress range. The S-N curve is the locus of these data points. In more thorough testing,
multiple samples are tested at each stress range. Common practice is to plot the S-N curve through the
mean value at each stress range. Using an S-N curve to predict real-world life when conditions do not
match the test conditions under which the curve was developed is dubious at best. This severely limits
the use of S-N curves in product design. On the other hand, the ease of construction makes the S-N
curve a simple and valuable tool in making relative comparisons between materials or process
Time
Stress
a
S
min
S -
max
Range = ∆S = S
min
S
m
S
max
S
Cycle
2 reversals
Stress ratios: {R=S
min
/S
max
A=S
n
/S
m
}
+
0
-
K. Kumar and M. L. Aggarwal / Engineering Solid Mechanics 3 (2015)
161
variations.
3. Fatigue life analysis
3.1. Experimental fatigue life
The experimental testing of EN45A parabolic leaf spring has been done in industrial laboratory.
The chemical composition of EN45A spring steel used is 0.61 C, 1.8 Si, 0.79 Mn, 0.02 S, 0.024 P, by
percent weight. The mechanical properties are yield strength of 1147 MPa, ultimate tensile strength of
1256 MPa and fatigue limit of 582 MPa. Full-scale testing of leaf spring was done for assessing the
fatigue performance of parabolic leaf spring experimentally. Minimum alternating stress of 420 MPa
corresponds to the weight of vehicle only and maximum alternating stress of 900 MPa corresponds to
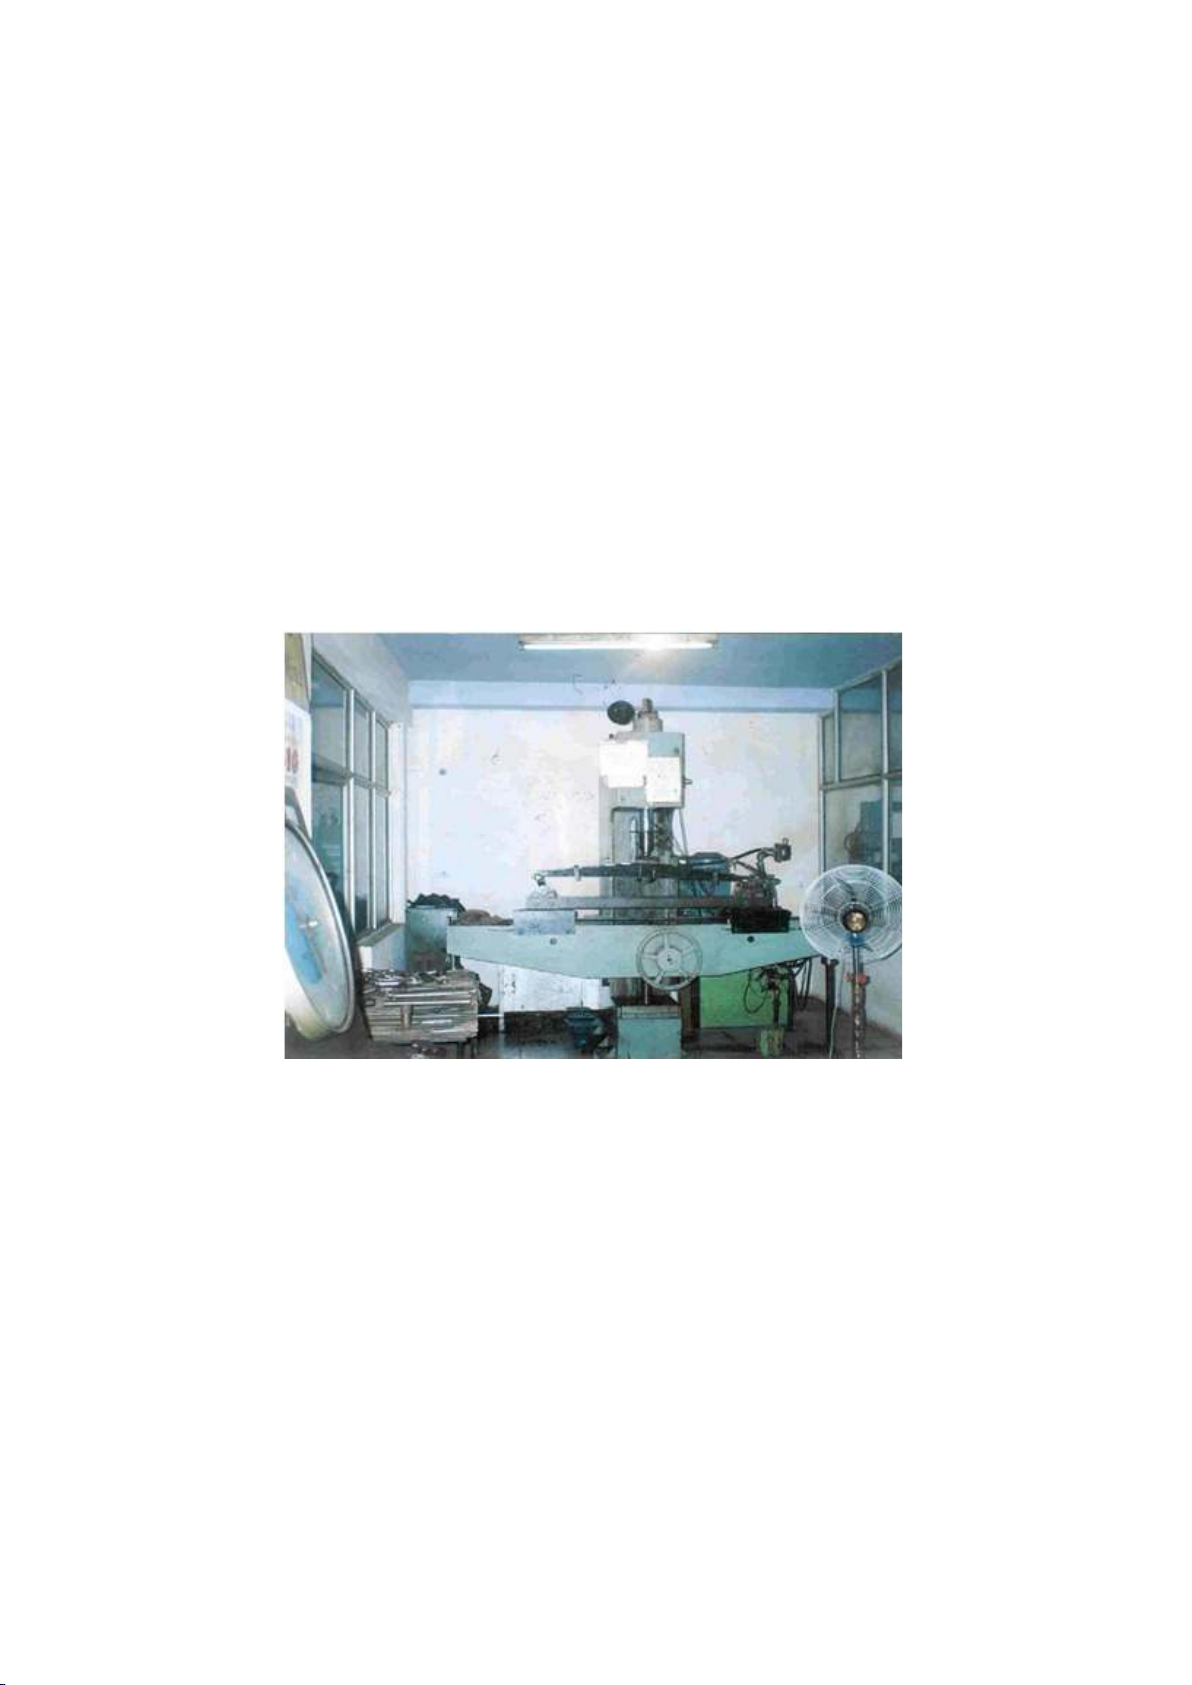
the load when leaf is near flat conditions. Full scale testing of leaf spring was carried out in an electro-
hydraulic fatigue component testing system (See Fig. 4). The leaf spring was placed in a fixture
simulating the conditions of vehicle. The system consists of a hydraulic power pack to give hydraulic
pressure and flow sent to a hydraulic actuator with a displacement specified by the alternating load.
During this laboratory testing a total of 86823 number of stress cycles has been completed before the
first deformation in the leaf spring assembly observed.
Fig. 4. Experimental testing on Full scale testing machine
3.2. Fatigue life prediction by SAE spring design manual
Fatigue life of leaf spring is expressed by the number of load cycles it will withstand without
failure. A leaf spring used in a suspension system will undergo a large number of cycles of small
amplitude near the design load without failure. Under the greater amplitude the number of cycles
without failure will reduced, since the maximum stresses as well as the stress range are increased and
both are determining factors in fatigue life of the spring. This criteria is frequently used for
determination of fatigue life of the spring, initial stress(horizontal scale) and maximum stress (vertical
scale) are intersected to estimate the number of cycles the spring will withstand for given loading
condition as shown in the Fig. 5.
As per requirement of concerned industrial manufacturer the maximum and minimum load should
be decided as per the criteria
𝑃𝑃𝑚𝑚𝑚𝑚𝑚𝑚/𝑚𝑚𝑚𝑚𝑚𝑚 = 1.5 ± 0.5𝑔𝑔,
(2)

![Bài tập tối ưu trong gia công cắt gọt [kèm lời giải chi tiết]](https://cdn.tailieu.vn/images/document/thumbnail/2025/20251129/dinhd8055/135x160/26351764558606.jpg)