
ACADEMIA JOURNAL OF BIOLOGY 2024, 46(3): 63–72
DOI: 10.15625/2615-9023/18604
63
THE GENETIC STRUCTURES OF THE CHURU, EDE AND GIARAI
UNRAVELLED BY COMPLETE MITOCHONDRIAL DNA
Dinh Huong Thao1,2, Tran Huu Dinh1, Nguyen Thuy Duong1,*
1Institute of Genome Research, Vietnam Academy of Science and Technology,
18 Hoang Quoc Viet, Ha Noi, Vietnam
2Graduate University of Science and Technology, Vietnam Academy of Science and
Technology, 18 Hoang Quoc Viet, Ha Noi, Vietnam
Received 19 May 2024; accepted 4 September 2024
ABSTRACT
Vietnam, a nation with a rich and complex history of migration and settlement, is home to 5
fundamental language families: Austroasiatic (AA), Tai-Kadai (TK), Austronesian (AN), Sino-
Tibetan (ST) and Hmong-Mien (HM). Among them is the Austronesian, a language family
substantial in island Southeast Asia (ISEA) but marginal in mainland counterpart (MSEA),
constituted five Vietnamese ethnolinguistic groups. Here, we analyzed the control region, and
the complete mitochondrial DNA (mtDNA) of 121 individuals from 3 AN-speaking
populations (Churu, Ede, and Giarai). To explore the molecular diversity, the sequences were
aligned against the Reconstructed Sapiens Reference Sequence (RSRS). The quantification and
distribution of nucleotide variations resulted in 6,369 variants in our dataset in which the
control region and coding region retained 1,707 and 4,662 variants, respectively. Churu
harbored the most diversity (54.6 ± 2.8 variants/person), followed by Giarai (52.2 ±
3.3 variants/person), and Ede (51.1 ± 5.3 variants/person). Both the control region and whole
mtDNA were input to Haplogrep3 to call haplogroups, resulting in 47.11% of our samples
having their haplogroup changed from 17 whole mtDNA lineages to 16 different control region
lineages. The haplogroup profile derived from whole mtDNA included 31 unique clades, in
which only B5a1d was shared among three groups, and 23/31 lineages were present
exclusively in a single population. The haplogroup component of each minority also revealed
that all 3 AN groups had the majority of their samples attributed to the macrohaplogroups M,
B, and F, with the disparity fixed in their underlying sublineages. This study increased the
knowledge wealth of the genetic characteristics of AN speakers in the region from a different
analysis approach, and highlighted the contribution of variants in different complete mtDNA,
providing insight to reconstruct a comprehensive genetic architecture of Vietnam.
Keywords: Churu, Ede, Giarai, mtDNA, Vietnam.
Citation: Dinh Huong Thao, Tran Huu Dinh, Nguyen Thuy Duong, 2024. The genetic structures of the Churu, Ede
and Giarai unravelled by complete mitochondrial DNA. Academia Journal of Biology, 46(3): 63–72.
https://doi.org/10.15625/2615-9023/18604
*Corresponding author email: tdnguyen@igr.ac.vn; https://orcid.org/0000-0001-8691-9138

Dinh Huong Thao et al.
64
INTRODUCTION
Vietnam is the homeland to 54 officially
recognized ethnic groups, belonging to 5
language families: Austroasiastic (AA), Sino-
Tibetan (ST), Thai-Kadai (TK), Hmong-Mien
(HM) and Austronesian (AN). The general
consensus reported that 85.32% of the
national population were the AA Kinh,
leaving the remaining 14.68% divided into 53
ethnolinguistic groups (General Statistics
Office, 2019). Many of these minorities either
resided in reclusive areas or/and had
diminished populations. As such, the
enormous diversity of Vietnamese people,
especially in the biological aspect, required
immediate measures to be preserved and
understood. Among these underrepresented
were the Austronesian speakers, whose traces
of arrival could be found prior to the
establishment of the Champa kingdom around
500 BCE (Vickery, 2011).
AN is a vast language family of more than
1200 dialects, stretching from Madagascar of
Eastern Africa, South East Asia (SEA), to
Eastern Island on the far east of the Pacific
(Eberhard et al., 2023). In Vietnam, they are
Cham, Churu, Ede, Giarai, and Raglay,
constituting 1.32% of the nation‟s
demography (General Statistics Office, 2019).
Modern Austronesian communities in
Vietnam (VN-AN) mostly occupied the
mountainous area of the Central Highland and
coastline of the South Central. Being the most
populous AN nation in MSEA, Vietnam had
Cham, Ede, and Giarai explored on various
degrees. The first VN-AN ethnic to be
examined was the Cham in a study of
mitochondrial DNA (mtDNA) hypervariable
segments (HVS) by Peng et al. (2010). Since
then, both the uniparental markers
(Y-chromosome and mtDNA) and the
genome-wide data of the Giarai-I and Ede-I
were unfolded (Duong et al., 2018; Liu et al.,
2020; Macholdt et al., 2020). So far, the
comprehensive picture of this ethnolinguistic
family stayed patchy, urging for more
evidences to fill in the missing pieces.
MtDNA has long been a preferred
uniparental marker to study evolution and
population genetics. Its structure could be
further divided into sub-regions: the coding
(range: 577–16,023) and the control (range:
1–576; 16,024–16,569). Packed with encoded
genes, the former is highly conservative,
while the latter retained fast mutational rate.
Embedded within control region are HVS -I
(range: 16,024–16,383), -II (range: 57–372)
and -III (range: 438–574), three particular
sites accounted for most variables. As such,
variants in the control region have been
routinely used to define many branches on the
phylogenetic tree. With the advancement of
next-generation sequencing (NGS),
sequencing whole mtDNA became less
resource-consuming, providing a more
accurate haplogroup profile and, therefore, a
finer phylogenetic resolution. In this study, we
analyzed the genetic characteristics of 121
males from 3 VN-AN indigenous tribes
(Churu, Ede, and Giarai). Nucleotide variants
were used for the first time to assess the
diversity on the molecular level. To determine
the importance of different mtDNA regions,
sequences of the control region and complete
mtDNA were implemented to extract
haplogroup information. The dataset present
here would provide details on the maternal
genetic structures of individual minorities as
well as the AN family in VN.
MATERIALS AND METHODS
Sample information
Whole blood samples were obtained from
121 males of 3 VN-AN populations (Churu,
Ede, and Giarai). All participants consenting
to donate blood were unrelated and self-
identified to have at least three generations of
the same ethnicity. The sampling locations
were Lam Dong (Churu), Dak Lak (Ede), and
Kontum (Giarai). This study received ethical
approval from the Institutional Review Board
of the Institute of Genome Research, Vietnam
Academy of Science and Technology (No: 2-
2019/NCHG-HĐĐĐ).
To distinguish between different sets of
samples from the same ethnicity, the Ede and
Giarai in this study were labeled with -II, and
the ones in Duong et al., 2018 were labeled
The genetic structures of the Churu, Ede
65
with -I. Furthermore, the Cham and Giarai in
Cambodia were referred to as CB-Cham and
CB-Giarai (Kloss-Brandstätter et al., 2021;
Zhang et al., 2013), and the Cham in Vietnam
was named VN-Cham (Peng et al., 2010).
mtDNA sequencing
Genomic DNAs were extracted by
GeneJET Whole Blood Genomic DNA
Purification Mini Kit (ThermoFisher
Scientific, USA) following the manufacturer‟s
protocol. Construction of genomic libraries
and capture-enrichment for mtDNA were
performed using the method by Maricic et al.
(2010). The libraries were sequenced on
Illumina platform. The reads generated by
sequencing were undergone quality control
and processed as described previously, then
were aligned to the Reconstructed Sapiens
References Sequence (RSRS) (Behar et al.,
2012), using an in-house alignment program.
Multiple sequence alignment was performed
using MAFFT (Katoh & Standley, 2013). The
mitogenome sequences of 121 samples were
available in GenBank (Thao et al., 2024).
Genetic analyses
To locate the nucleotide variants on multiple
mtDNA segments (coding and control region),
reads were aligned against RSRS using an in-
house algorithm. Positions with missing
nucleotide (Ns) and other 8 sites were excluded:
poly-C stretch of hypervariable segment 2
(HVS-II; nucleotide positions (np) 303–317);
CA-repeat (np 514–523); C-stretch 1 (np 568–
573); 12S rRNA (np 956–965); historical site
(np 3,107); C-stretch 2 (np 5,895–5,899); 9 bp
deletion/insertion (np 8,272–8,289); and poly-C
stretch of hypervariable segment 1 (HVS-I; np
16,180–16,195). The distribution of variants
across three populations was visualized by the R
package “ggplot2”. The control region (1–576
bp; 16,024–16,569 bp) and entire mtDNA
sequences were implemented to classify
haplogroups via HaploGrep3 (Weissensteiner et
al., 2016) with PhyloTree mtDNA tree Build 17
(van Oven & Kayser, 2009). The
correspondence analysis (CA) was computed
based on haplogroup frequencies in R via
libraries “vegan v2.6-4” (Oksanen et al, 2022)
and “ca v0.71.1” (Nenadic & Greenacre, 2007).
RESULTS
Variants distribution
We screened 6369 variants in our sample
set, in which the control and the coding region
took a portion of 73.2% and 26.8%,
respectively. In term of population group, Churu
had the highest number of variants per
individual (54.6 ± 2.8 variants/person). Giarai-II
was the second, with 52.2 ± 3.3 variants/person.
Ede-II had the least variants, only 51.1 ±
5.3 variants/person.
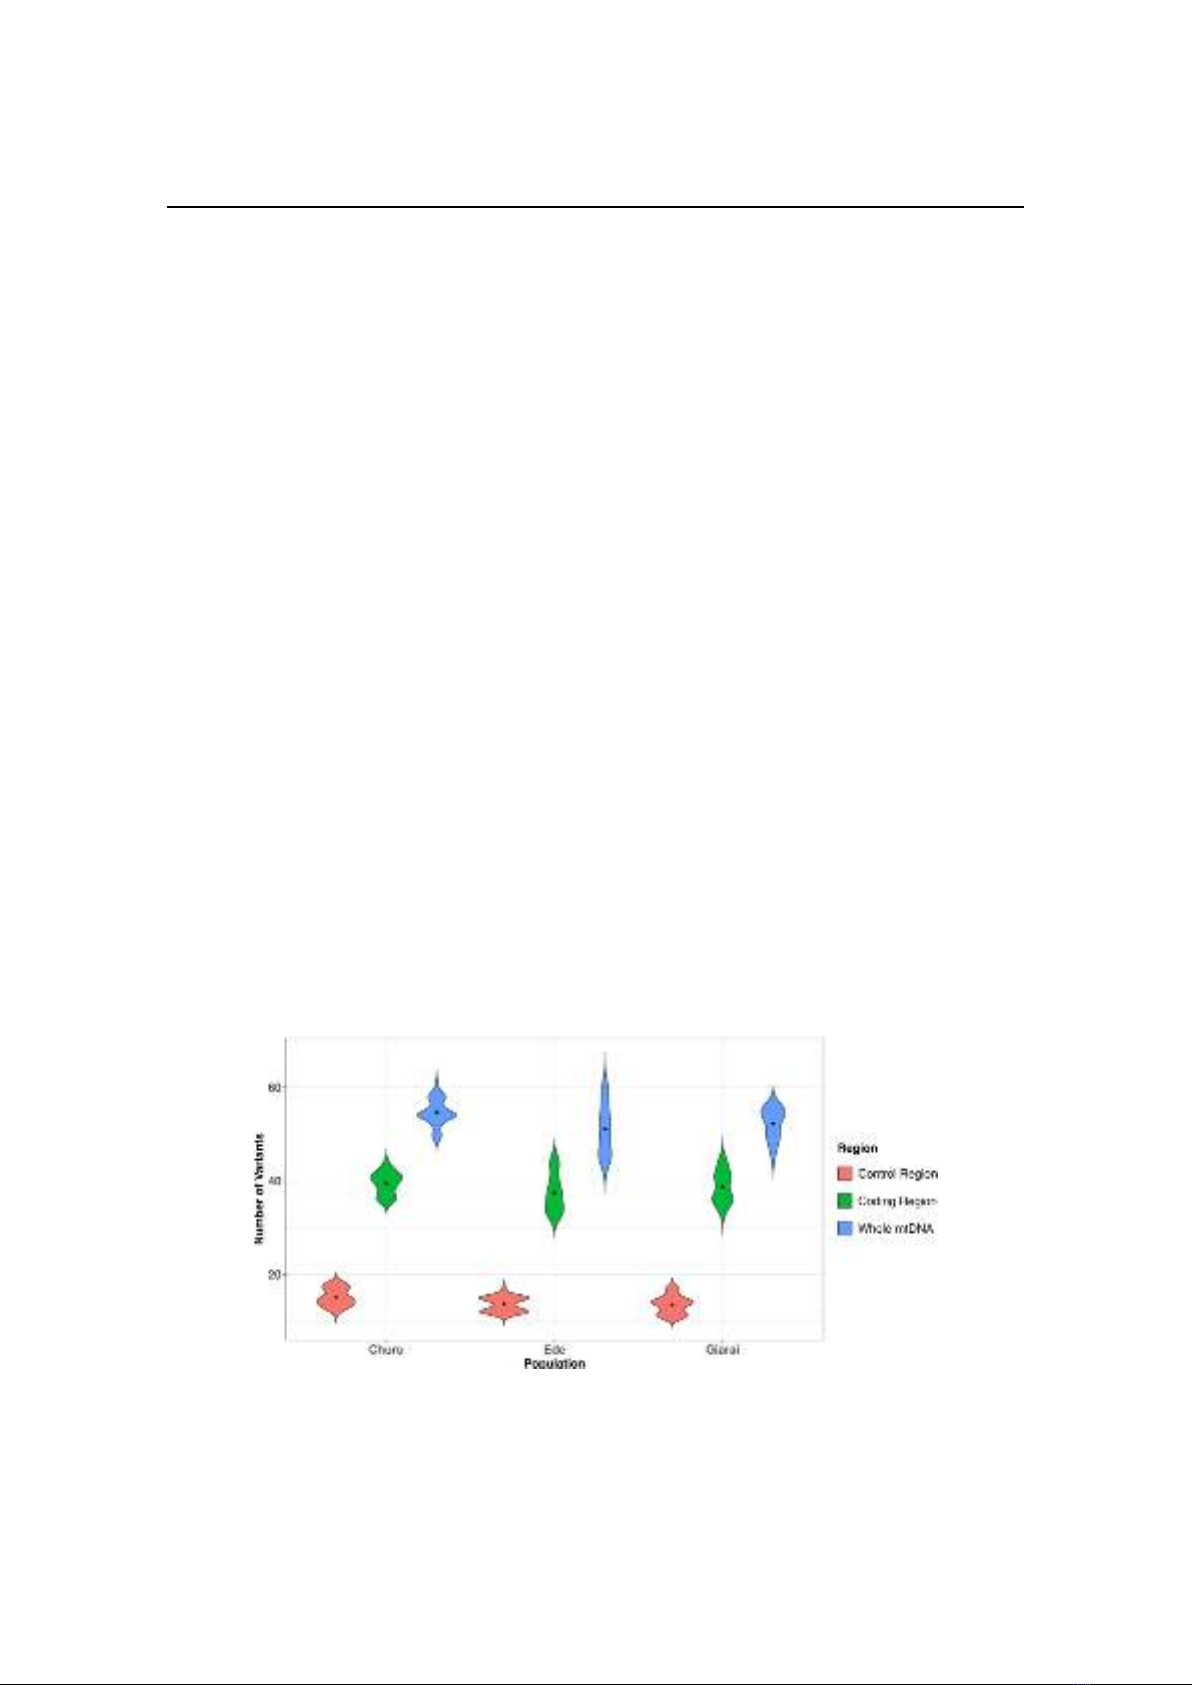
Figure 1. Variant distribution across the complete mitochondrial sequences of Churu, Ede-II, and
Giarai-II. Different mitochondrial DNA regions were color-labeled: red is the control region,
green is the coding region, blue is the entire mitogenome. Black dot denoted the median values.
Dinh Huong Thao et al.
66
The distribution of variants in different
mitogenomes was visualized on the violin plot
(Figure 1). In the control region, the
distribution curve of Churu was broader from
the median to the lower portion. In Ede-II it
was skewed at the median point, dividing the
curve into two noticeable parts. The curve in
Giarai-II was the opposite of that in Churu: it
was wider from the median point to the upper
portion. In the coding region, the median was
highest among the Churu (Figure 1), followed
by the Giarai-II and Ede-II. Churu had the
broadest area around the median value; Ede-II
and Giarai-II had thinner and more prolonged
tips. When comparing the whole mtDNA,
Ede-II had the most elongated distribution. In
Giarai-II, the upper portion was wider and
shorter than the lower portion. In Churu, the
most extended part was centralized around the
median point, with more outliers on the top.
Haplogroup classification
To evaluate the significance of variants in
coding and control regions, the sequences of
the later were aligned to RSRS to call
haplogroups. Details of the differentiation
between using whole mtDNA and control
region sequences to classify haplogroups were
listed in Table 1 below. Overall, 43.8% of our
samples had their haplogroups changed, from
17 whole mtDNA to 16 control region
haplogroups. The number of unique
polymorphic sites were 98 in the control
regions and 441 in the entire mitogenomes of
121 individuals. Notably, 14 out of 15 M71 +
151T (assigned using whole mtDNA) switched
to D6a1 (assigned using control region
sequences). All F1a1a1 samples defined by
variants in whole mtDNA were corresponded
to F1a1a defined by those in the control region.
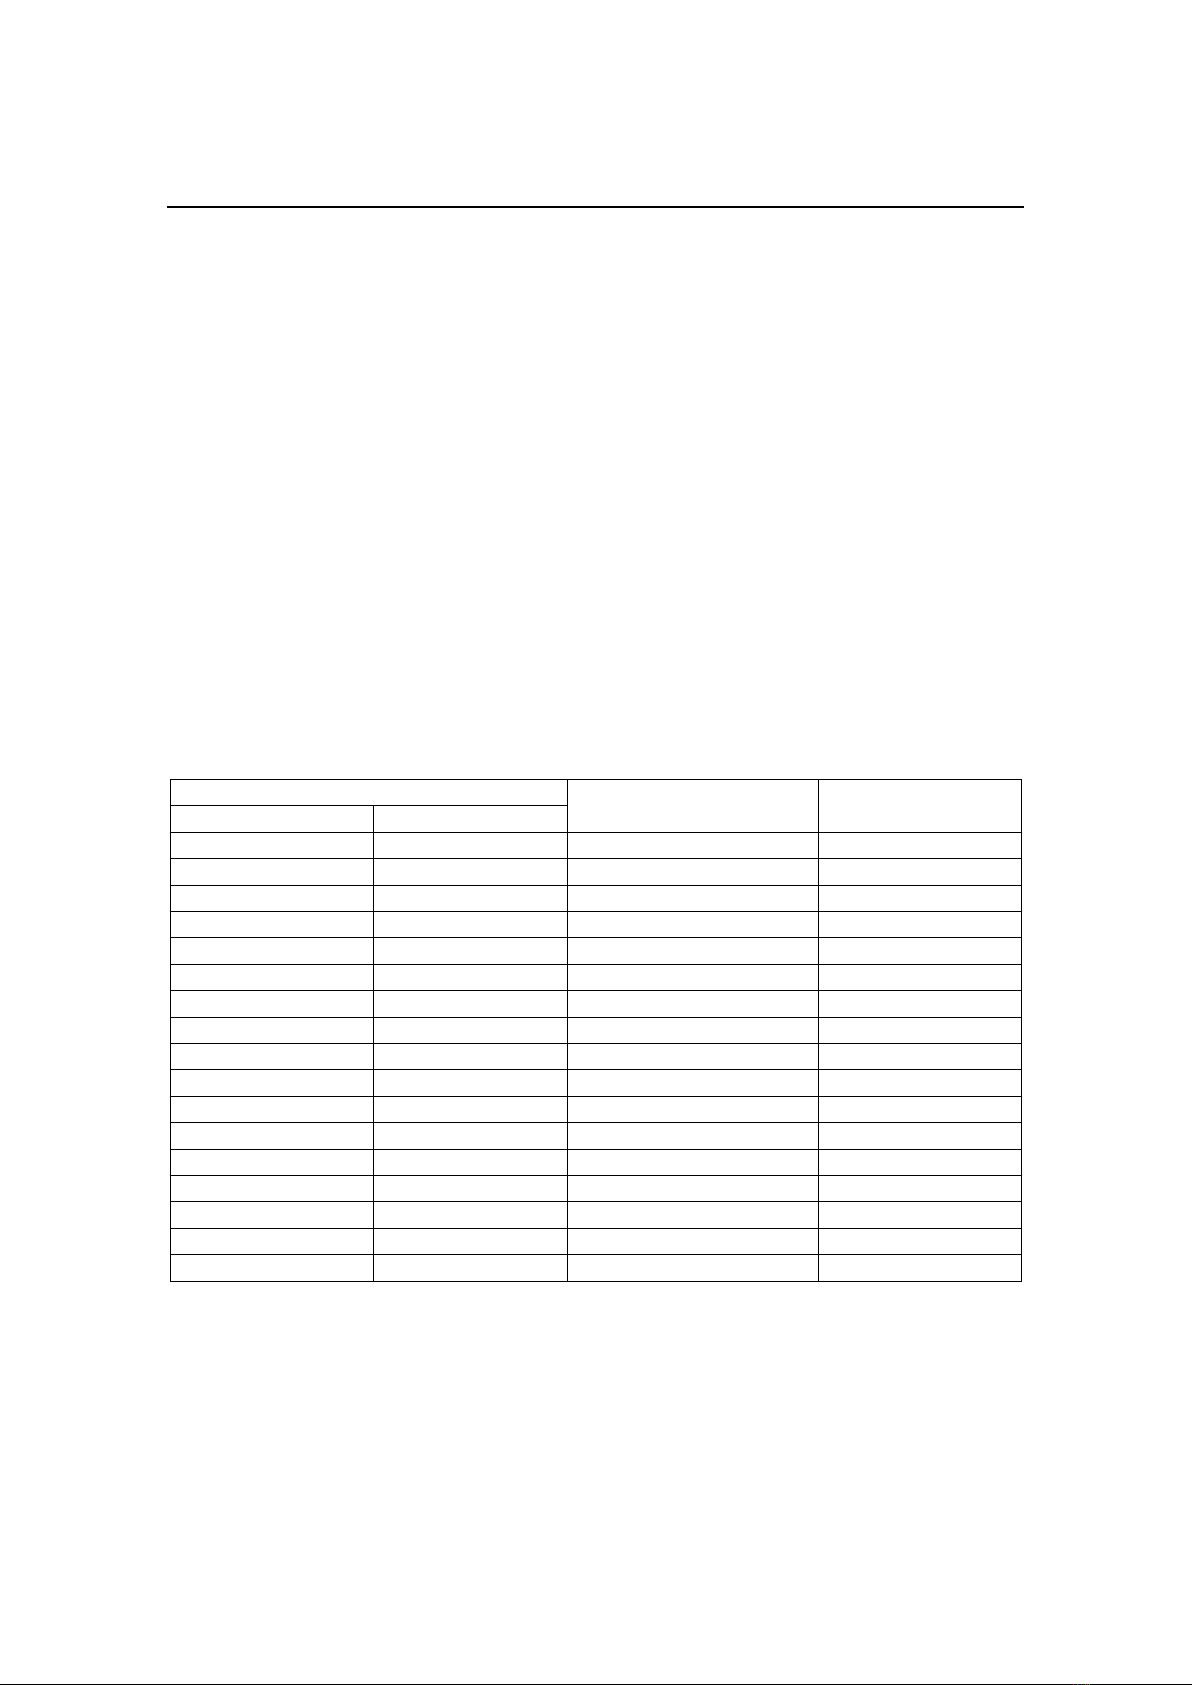
Table 1. Whole mtDNA and control region haplogroup differentiation
Haplogroups
Number of samples
Percentage (%)
Whole mtDNA
Control region
B5a1a
B5a
4
3.31
B5a1b1
B5a
2
1.65
B5a1c
B5a1d
1
0.83
C7
C4c1b
1
0.83
F1a1a1
F1a1a
8
6.61
M7c1a
M7c1a1b
1
0.83
M21b
M7c
6
4.96
M71+151T
D6a1
14
11.57
M73b
M73‟79
5
4.13
M74
D4h4a
1
0.83
M74
D4p
1
0.83
M74b2
M43a1
3
2.48
M7b1a1b
M7b1a1
1
0.83
M7b1a1f
M7b1a1a
1
0.83
M9a‟b
D4l1a
1
0.83
N21a
N21
2
1.65
N7b
M5
1
0.83
From the complete mitochondrial genomes
of 121 VN-AN individuals, 31 haplogroups
were stratified into seven macro-haplogroups:
B (15.70%), C (0.83%), D (1.65%), F
(16.53%), M (52.89%), N (6.61%), R (5.79%)
(Table 2). Macro-haplogroups B, F and M and
their sub-branches were predominant,
accounting for 85.12% of our dataset. A total
of 23 assigned lineages appearred in a single
ethnic group only, including 10 singletons. A
total of 14 haplogroups were assigned to the
Churu, of which 4 were singleton. The most
The genetic structures of the Churu, Ede
67
frequent were M12b1a2 and R22 (16.67%
each), F1a1a, and M76 (14.29% each). There
were 12 haplogroups arising in the Ede-II;
three of those lineages were singleton. The
most common were M71+151 (34.88%),
F1a1a1 (16.28%) and B5a1d (13.95%). In the
Giarai-II, 3 out of 14 lineages were singleton.
The most widely distributed were M21 and
M73b (13.89% each), B5a1d, and F1a1d
(11.11% each). The distribution was further
visualized on the haplogroup frequency-based
CA plot (Figure 2) indicating B5a1d as the
only lineage shared among all three
populations. Striking outliers were separated by
M73b (Giarai-II), M7c1a (Churu), B5a1b1
(Giarai-II) and M12a1b (Churu).
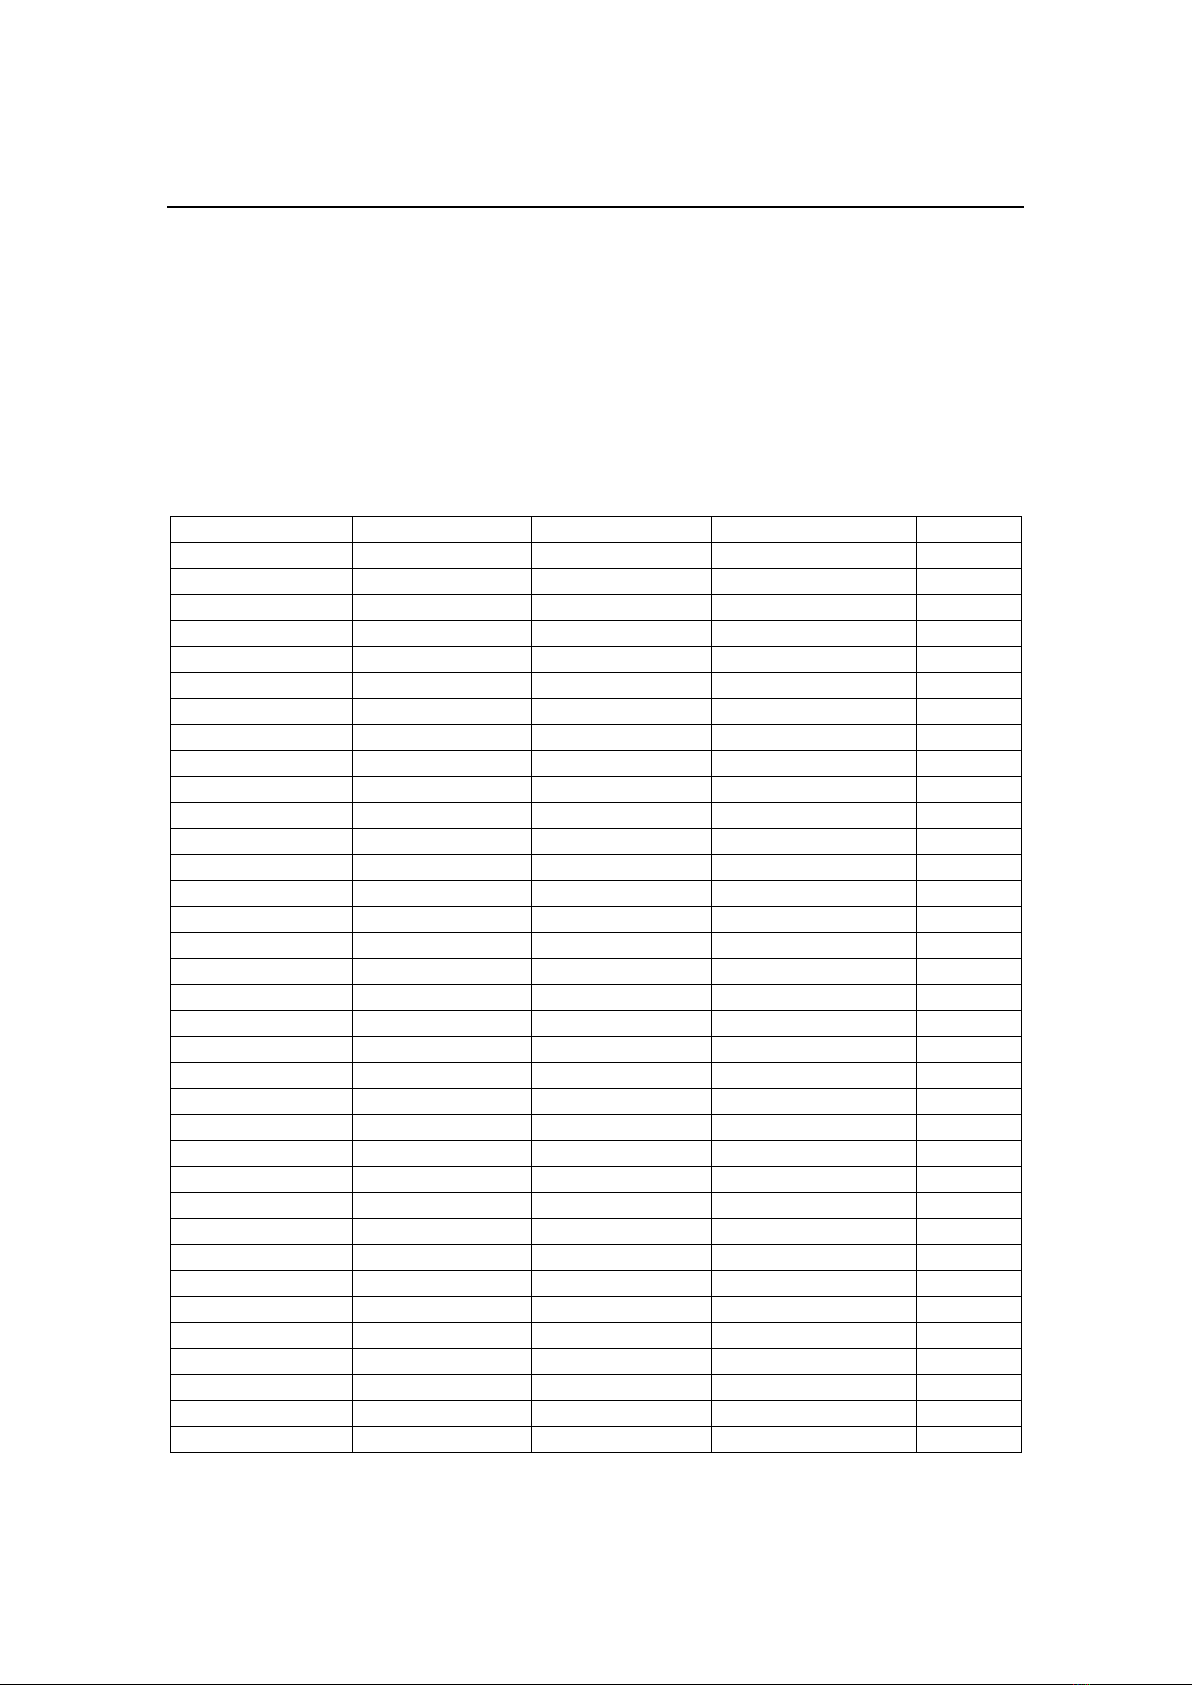
Table 2. Haplogroup composition and distribution in Churu, Ede, and Giarai. Haplogroup
denoted with * was the only representative of its macrohaplogroup in this dataset
Haplogroup (s)
Churu (n = 42)
Ede-II (n = 43)
Giarai-II (n = 36)
Total
B
14.29%
16.28%
16.67%
15.70%
B5a1a
7.14%
2.33%
-
3.31%
B5a1b1
-
-
5.56%
1.65%
B5a1c
2.38%
-
-
0.83%
B5a1d
4.76%
13.95%
11.11%
9.92%
C7*
-
-
2.78%
0.83%
D5a2a1*
-
-
5.56%
1.65%
F
16.67%
20.93%
11.11%
16.53%
F1a1a
14.29%
4.65%
-
6.61%
F1a1a1
2.38%
16.28%
-
6.61%
F1a1d
-
-
11.11%
3.31%
M
42.86%
58.14%
58.33%
52.89%
M12a1b
2.38%
-
-
0.83%
M12b1a2
16.67%
-
-
5.79%
M20
2.38%
-
8.33%
3.31%
M21b
-
2.33%
13.89%
4.96%
M21b2
4.76%
2.33%
-
2.48%
M71+151T
-
34.88%
-
12.40%
M71a2
-
2.33%
-
0.83%
M73b
-
-
13.89%
4.13%
M74
-
-
5.56%
1.65%
M74b1
-
11.63%
-
4.13%
M74b2
-
-
8.33%
2.48%
M76
14.29%
-
2.78%
5.79%
M7b1a1a
-
-
2.78%
0.83%
M7b1a1b
-
2.33%
-
0.83%
M7b1a1f
-
2.33%
-
0.83%
M7c1a
2.38%
-
-
0.83%
M9a'b
-
-
2.78%
0.83%
N
9.52%
4.65%
5.56%
6.61%
N21a
-
-
5.56%
1.65%
N22
7.14%
-
-
2.48%
N7b
2.38%
-
-
0.83%
N8
-
4.65%
-
1.65%
R22*
16.67%
-
-
5.79%


![Vector chuyển gen cosmid là gì? [Hướng dẫn chi tiết]](https://cdn.tailieu.vn/images/document/thumbnail/2013/20130923/butmaulam/135x160/8441379933033.jpg)
![Sản xuất thuốc và DNA vaccine [mới nhất]](https://cdn.tailieu.vn/images/document/thumbnail/2013/20130923/butmaulam/135x160/6681379933048.jpg)


%20--%3e%3cdefs%3e%3cstyle%3e%20.st0%20{%20fill:%20%23fff;%20}%20.st1%20{%20fill:%20%237800fa;%20}%20%3c/style%3e%3c/defs%3e%3cpath%20class='st1'%20d='M117.78,12.18H43.11c2.9,3.47,4.65,7.94,4.65,12.82,0,5.6-2.3,10.66-6.01,14.29h76.02l7.22-13.56-7.22-13.56Z'/%3e%3cg%3e%3cpath%20class='st0'%20d='M53.58,26.17h-.59v-1.46h.59v-4.96h2.83c1.78,0,2.67.94,2.67,2.82v5.76c0,1.87-.89,2.81-2.67,2.81h-2.83v-4.96ZM55.36,21.37v3.34h1.1v1.46h-1.1v3.34h1.01c.61,0,.91-.37.91-1.1v-5.93c0-.74-.3-1.1-.91-1.1h-1.01Z'/%3e%3cpath%20class='st0'%20d='M65.99,31.14h-1.8l-.31-2.07h-2.19l-.31,2.07h-1.64l1.82-11.39h2.62l1.82,11.39ZM65.28,18.04c-.25.46-.51.77-.75.94-.21.15-.47.22-.79.22-.26,0-.57-.07-.92-.22l-.38-.15c-.14-.05-.26-.07-.37-.07-.3,0-.53.18-.71.54l-.91-.68c.25-.46.51-.77.75-.94.21-.14.48-.21.79-.21.26,0,.57.07.92.21l.38.15c.14.05.26.07.37.07.3,0,.53-.18.71-.54l.91.68ZM61.91,27.52h1.73l-.87-5.76-.87,5.76Z'/%3e%3cpath%20class='st0'%20d='M74.53,26.89v1.52c0,1.91-.89,2.86-2.67,2.86s-2.67-.95-2.67-2.86v-5.93c0-1.91.89-2.86,2.67-2.86s2.67.95,2.67,2.86v1.11h-1.69v-1.22c0-.75-.31-1.12-.93-1.12s-.93.37-.93,1.12v6.15c0,.74.31,1.11.93,1.11s.93-.37.93-1.11v-1.63h1.69Z'/%3e%3cpath%20class='st0'%20d='M81.4,31.14h-1.8l-.31-2.07h-2.19l-.31,2.07h-1.64l1.82-11.39h2.62l1.82,11.39ZM75.9,19.2l1.52-1.91h1.71l1.51,1.91h-1.61l-.76-.95-.75.95h-1.61ZM77.32,27.52h1.73l-.87-5.76-.87,5.76ZM83.1,15.99l-1.76,1.91h-1.26l1.17-1.91h1.86Z'/%3e%3cpath%20class='st0'%20d='M84.86,19.75c1.78,0,2.67.94,2.67,2.82v1.48c0,1.87-.89,2.81-2.67,2.81h-.85v4.28h-1.79v-11.39h2.64ZM84.01,21.37v3.86h.85c.58,0,.87-.36.87-1.08v-1.71c0-.71-.29-1.07-.87-1.07h-.85Z'/%3e%3cpath%20class='st0'%20d='M93.51,19.75c1.78,0,2.67.94,2.67,2.82v1.48c0,1.87-.89,2.81-2.67,2.81h-.85v4.28h-1.79v-11.39h2.64ZM92.66,21.37v3.86h.85c.58,0,.87-.36.87-1.08v-1.71c0-.71-.29-1.07-.87-1.07h-.85Z'/%3e%3cpath%20class='st0'%20d='M98.8,31.14h-1.79v-11.39h1.79v4.88h2.03v-4.88h1.83v11.39h-1.83v-4.88h-2.03v4.88Z'/%3e%3cpath%20class='st0'%20d='M105.36,24.55h2.46v1.62h-2.46v3.34h3.09v1.63h-4.88v-11.39h4.88v1.63h-3.09v3.18ZM108.17,17.29l-1.76,1.91h-1.26l1.17-1.91h1.86Z'/%3e%3cpath%20class='st0'%20d='M112.2,19.75c1.78,0,2.67.94,2.67,2.82v1.48c0,1.87-.89,2.81-2.67,2.81h-.85v4.28h-1.79v-11.39h2.64ZM111.35,21.37v3.86h.85c.58,0,.87-.36.87-1.08v-1.71c0-.71-.29-1.07-.87-1.07h-.85Z'/%3e%3c/g%3e%3ccircle%20class='st1'%20cx='25'%20cy='25'%20r='20'/%3e%3cpath%20class='st0'%20d='M32.78,19.27c2.92,0,4.43,2.55,5.28,5.33l.71,2.17c.14.38-.33.75-.71.75h-5.61c.19-.33.24-.71.09-1.08l-.75-2.45c-.43-1.32-.99-2.64-1.79-3.77.75-.57,1.65-.94,2.78-.94h0ZM25,18.38c3.25,0,4.9,2.78,5.89,5.89l.76,2.45c.14.42-.33.8-.8.8h-11.69c-.42,0-.94-.38-.8-.8l.75-2.45c.99-3.11,2.64-5.89,5.89-5.89h0ZM25,11.35c1.74,0,3.11,1.37,3.11,3.11s-1.37,3.11-3.11,3.11-3.11-1.41-3.11-3.11,1.41-3.11,3.11-3.11h0ZM17.27,19.27c1.08,0,1.98.38,2.73.94-.8,1.13-1.37,2.45-1.74,3.77l-.8,2.45c-.14.38-.05.75.09,1.08h-5.56c-.42,0-.9-.38-.75-.75l.71-2.17c.9-2.78,2.41-5.33,5.33-5.33h0ZM17.27,12.91c1.51,0,2.78,1.27,2.78,2.83s-1.27,2.83-2.78,2.83-2.83-1.27-2.83-2.83,1.27-2.83,2.83-2.83h0ZM32.78,12.91c1.56,0,2.78,1.27,2.78,2.83s-1.23,2.83-2.78,2.83-2.83-1.27-2.83-2.83,1.27-2.83,2.83-2.83h0ZM27.07,28.56v.09c0,.57-.24,1.08-.61,1.46h0v.05c-.38.33-.9.57-1.46.57s-1.08-.24-1.46-.61h0c-.38-.38-.61-.9-.61-1.46v-.09h1.41v.09c0,.19.05.38.19.47v.05c.09.09.28.19.47.19s.38-.09.47-.19v-.05c.14-.09.24-.28.24-.47t-.05-.09h1.41ZM30.99,28.56v.09c0,1.65-.66,3.16-1.74,4.24-1.08,1.08-2.59,1.79-4.24,1.79s-3.16-.71-4.24-1.79l-.05-.05c-1.04-1.08-1.7-2.55-1.7-4.2v-.09h1.41v.09c0,1.27.47,2.4,1.27,3.25h.05c.85.85,1.98,1.37,3.25,1.37s2.4-.52,3.25-1.37c.85-.8,1.37-1.98,1.37-3.25v-.09h1.37ZM34.99,28.56v.09c0,2.78-1.13,5.28-2.92,7.07-1.79,1.79-4.29,2.92-7.07,2.92s-5.23-1.13-7.07-2.92c-1.79-1.79-2.92-4.29-2.92-7.07v-.09h1.41v.09c0,2.4.94,4.53,2.5,6.08,1.56,1.56,3.72,2.5,6.08,2.5s4.52-.94,6.08-2.5c1.56-1.56,2.5-3.68,2.5-6.08v-.09h1.41Z'/%3e%3c/svg%3e)