
Transport and Communications Science Journal, Vol. 76, Issue 01 (01/2025), 79-88
79
Transport and Communications Science Journal
MACROSCOPIC EVALUATION OF ROAD TRAFFIC SAFETY
USING QGIS: A CASE STUDY OF TUYEN QUANG PROVINCE
Vuong Xuan Can1*, Bui Duy Hien1,2, Tran Trung Hieu1,3
1University of Transport and Communications, No 3 Cau Giay Street, Hanoi, Vietnam
2DOT of Tuyen Quang, Tuyen Quang city, Tuyen Quang Province, Vietnam
3Dong Thai people's committee, An Duong, Hai Phong, Vietnam
ARTICLE INFO
TYPE: Research Article
Received: 31/07/2024
Revised: 19/11/2024
Accepted: 10/01/2025
Published online: 15/01/2025
https://doi.org/10.47869/tcsj.76.1.7
* Corresponding author
Email: vuongcan@utc.edu.vn; Tel: +84915660966
Abstract. Road traffic safety in Vietnam is one of the top social concerns due to the
complicated situation of traffic accidents, requiring in-depth research to find appropriate
solutions. Macroscopic evaluation of traffic safety is one of the effective ways to prevent and
reduce road traffic accidents. The paper presents a new method based on an Equivalent
Severity Score (ESS) to evaluate road traffic safety in an area using a geographic information
system (GIS) tool, namely QGIS. The road traffic accident (RTA) data from 2021 to 2023 in
Tuyen Quang province, Vietnam, was used to analyze and test this method. First, the RTA
data was divided by the administrative units of Tuyen Quang, using several evaluation
indicators, including the number of traffic accidents, fatalities, serious injuries, and slight
injuries. Then, the ESS was determined based on these evaluation indicators to measure the
seriousness of RTA across the administrative units. Finally, the ranking of road traffic safety
of administrative units is presented by using QGIS software. From there, the traffic
authorities can easily understand areas where RTA occurs more seriously and provide
reasonable solutions. The results of the paper will help traffic authorities have more basis in
making decisions related to solutions to solve traffic problems not only in Tuyen Quang
province of Vietnam but also in other localities.
Keywords: road traffic accidents, QGIS, macroscopic evaluation, road traffic safety
@ 2025 University of Transport and Communications

Transport and Communications Science Journal, Vol. 76, Issue 01 (01/2025), 79-88
80
1. INTRODUCTION
Road traffic safety (RTS) is an indispensable part of the sustainable development of a city,
a region, a country, and even all humanity. RTS is the happiness for every family, so it always
receives the top concern of the whole population. In general, the problem of RTS is very
complex and is affected by many factors, including road factors, vehicle factors, human factors,
and environmental factors. However, it is usually measured directly based on road traffic
accidents (RTA) and their consequences.
The increase in registered vehicles and road mileage has led to a rise in road traffic
accidents (RTAs) worldwide. According to World Health Organization (WHO) reports in 2023,
there were approximately 1.19 million road traffic deaths in 2021, equating to a rate of 15 deaths
per 100,000 population. Around 92% of these fatalities occurred in upper-middle, lower-
middle, and low-income countries, with road traffic deaths comprising 44% in lower-middle
income, 35% in upper-middle-income, and 13% in low-income countries, respectively [1].
These accidents cost about 3% of annual gross domestic product in these nations. In Vietnam,
according to the reports of the National Traffic Safety Committee in 2023, there were over 6.3
million automobiles of all types with an annual growth rate of about 10%; and over 74.3 million
motorcycles with an annual growth rate of about 5%. The total length of the road traffic network
was 595,201 km in 2022, which includes expressways, national roads, provincial roads, urban
roads, and others. Regarding RTA, there were 20,067 traffic crashes, 11,628 deaths, and 15,292
injuries on Vietnam’s road networks in 2023, i.e., at least 31 road fatalities and 41 injuries per
day. According to the estimates of the World Bank, the economic cost of road fatalities and
serious injuries in Vietnam is approximately USD 18.02 billion [2]. To decrease RTA
significantly as well as decrease its devastating effect on the lives of people, it is crucial to
understand where and when traffic accidents happen frequently throughout the safety
evaluation.
Evaluation of traffic safety is one of the important ways to prevent effectively and reduce
road traffic accidents because it directly impacts on the decision-making related to road safety.
Generally, the evaluation of traffic safety is an examination related to the potential safety issues
and the performance of road traffic systems to identify and estimate the effects of the factors
on frequencies and severity of RTA considering all road users and opportunities for safety
improvements [3]. Hence, many scholars have dedicated themselves to establishing new
evaluation methods of traffic safety. In general, evaluation methods using data from RTA can
be divided into macroscopic and microscopic approaches [4, 5]. The former refers to evaluating
the RTS in certain geographic areas or regions through road traffic accidents and their
characteristics, such as socio-economic conditions, demographics, factors of road
infrastructure, land use, and so on [5], therefore, several areas with serious accidents can be
identified and given priority for the policy and mechanism of safer road treatments. The latter
conducts RTA on specific facilities or sections, such as intersections, roadway segments,
pedestrian crossings, ramps, etc. Microscopic approaches consider variables aggregated at
specific locations (i.e. roadway segments or intersections), including road geometrics, traffic
volume, traffic components, etc. This study focuses on the discussion related to macroscopic
evaluation approaches and proposes a new method for macroscopic evaluation of RTS based
on an Equivalent Severity Score (ESS) and GIS software, namely QGIS. The main objective is
to rank the safety of the areas so that decision-makers have a solid basis for setting priorities in
ensuring traffic safety.

Transport and Communications Science Journal, Vol. 76, Issue 01 (01/2025), 79-88
81
2. LITERATURE REVIEW
Generally, macroscopic evaluation approaches include both single criteria and multi-
criteria methods. Single-criteria methods are based on either absolute indicators (like the
number of accidents, fatalities, or injuries) or relative indicators (for example, the number of
accidents, fatalities, or injuries per 1,000 people). For instance, authors in [6] used fatality rates
per 100,000 vehicles and personal fatality risk per 10 million trips to evaluate the fatality risks
of road users in six mid-sized cities in India. They found that fatality rates per 100,000 vehicles
for motorized two-wheelers and three-wheeled scooter taxis were 2-3 and 3-5 times higher than
that for cars, however, motorized two-wheelers and cars posed a similar risk to society, with
three-wheeled scooter taxis representing a slightly smaller risk. The main advantage of these
methods is their simplicity, however, the biggest limitation is that they reflect only one specific
aspect related to RTA and even a self-contradiction conclusion could have occurred. To
overcome the limitations of single-criteria methods, multi-criteria methods have been interested
and developed recently. These methods are based on the integration of absolute indicators
and/or relative indicators mentioned above, such as the clustering analysis method, grey
evaluation method [7-11], fuzzy comprehensive evaluation (FCE) [12, 13], data envelopment
analysis (DEA) [14], principle component analysis (PCA) [15], and so on [5]. In [15], the
authors used PCA with six relative indicators to rank the traffic safety level of 30 provincial
capitals in China from 1990 to 2006. They found that the differences in road safety among cities
were comparatively distinct in 2006; the fatalities per number of accidents and mortality were
the crucial evaluation indicators for the cities in China. The researchers in [16] utilized the Grey
system theory and neural network by integrating three indicators to evaluate RTS for seven
cities in China. They revealed that their proposed method was more advantageous than
traditional methods with a relative indicator solely. The researchers in [13] used FCE with grey
relational analysis through nine indicators to assess and rank the comprehensive risk of traffic
accidents in 31 provinces in China. They concluded that their result had great significance for
traffic safety measurement and management of an area. The authors in [14] applied DEA to
estimate road safety performances of 31 provinces of Iran. Their DEA method used six
indicators, including passenger kilometers, number of automobiles, ton-kilometers, population,
free/highway length, and speed camera as input variables to obtain three outputs road facilities,
injuries, and crashes. They found that the number of fatalities was the most important indicator
while population and speed cameras were the less important ones. The majority of these
methods are created for distinct purposes, each method has contributed to the development of
safety evaluation methods. Besides, the advantages, these methods have certain limitations that
restrict their applications. For example, there are factors of subjective experiences and
preferences of the researchers in the implementation process. Furthermore, most of these
methods have not been integrated with geographic information systems (GIS) to visualize
research results. GIS analysis will support traditional time-based analysis, making it easier for
engineers and managers to visualize and identify areas of serious accidents on spatial maps.
Therefore, it is also necessary to conduct studies related to GIS integration in macroprudential
assessment to fill in the gaps of the above methods.
So far, in Vietnam, the main evaluation methods of traffic safety are still based on three
indicators, including the number of RTA, fatalities, and injuries. For example, in Circular No.
26/2012/TT-BGTVT of Vietnam Transport Ministry dated July 20, 2012, three absolute
indicators including the number of RTA, fatalities, and injuries in 12 months of the year are
utilized to identify potential accident points and black spots of accidents; In Circular

Transport and Communications Science Journal, Vol. 76, Issue 01 (01/2025), 79-88
82
No.26/2024/TT-BCA of Vietnam Ministry of Public Security dated June 21, 2024, some
relative indicators (e.g., number of RTA per hundred thousand people, number of RTA per ten
thousand vehicles, number of RTA per kilometer, etc.) have been added in traffic accident
statistical reports to consider as safety coefficients. However, due to the new issuance, there
have been no full reports using these indicators to assess safety, nor is there a specific method
to integrate these indicators. Absolute indicators make it difficult for us to compare and rank
traffic safety among areas [9], leading to difficulties in developing priority plans for ensuring
traffic safety. Only a few scholars have been interested in developing macroscopic evaluation
methods using new methods. Typically, authors in [17] used a severity index to investigate
accident hotspots in Hanoi using the mapping of GIS. However, they did not consider traffic
accident ratings in Hanoi areas. In [9], the authors compared and ranked traffic accidents in
some Vietnamese urban areas through Gray Relational Analysis. However, their results have
not been visualized with graphs and maps like GIS.
3. METHODOLOGY
3.1. Equivalent Severity Scores (ESS)
The absolute indicators including the number of RTA, fatalities, and injuries are commonly
used to analyze and evaluate RTS in Vietnam. These absolute and discrete indicators make it
difficult to reflect the status of RTS in an area. At the same time, it is also difficult to make
rankings and comparisons of RTS between areas. To address these limitations, we often use
relative indicators such as the ratio of deaths to accidents, the number of accidents per thousand
people, etc.[9]. However, integrating indicators into a comprehensive index to facilitate ranking
and comparison of RTS is still a challenge. In this study, a new evaluation index, called
Equivalent Severity Score (ESS) is proposed based on the absolute and relative indicators to
serve as a basis for ranking and comparing the safety status of areas. ESS is calculated as the
following equation.
𝐸𝑆𝑆 = 𝑆𝐼
𝑃×103 (1)
Where, 𝐸𝑆𝑆 is the equivalent severity score of an area or a region; 𝑃 is the area population
(people); 𝑆𝐼 is the severity index of the area and it is determined by the following equation.
𝑆𝐼 =𝐿+3𝑆+5𝐷
𝑁 (2)
Where, 𝑁 is the number of years of RTA statistics; 𝐿, 𝑆, 𝐷 are slight, serious, and fatal
accidents in terms of the period, respectively; “1, 3 and 5” are equivalent weights provided for
slight, serious, and fatal accidents, respectively [18]. A fatal accident is equivalent to five slight
injuries and a serious injury is equivalent to three slight injuries. The larger the equivalent
severity score of an area, the higher the severity of RTA in the area.
3.2. Integration of ESS and QGIS
Quantum GIS, also known as QGIS, is a free open-source GIS software that enables users
to create maps with the help of core functions and free open-source plugins. QGIS can be run
on many distinct types of operating systems (Windows, iOS, and Linux) and supports numerous
vector, raster, and database formats [19]. GIS in general and QGIS in particular enable us to
collect, store, manipulate, query, analyze, and visualize spatial data which plays an important
Transport and Communications Science Journal, Vol. 76, Issue 01 (01/2025), 79-88
83
role in the analysis and evaluation of road traffic safety. Hence, QGIS is a very powerful tool
for conducting spatial-temporal analysis, including road traffic safety.
In general, the steps of QGIS consist of determining the project objectives, collecting and
converting data, data storage, data analysis, and result visualization. In this study, the
administrative boundaries as objects assessed for safety are downloaded from GADM [20] and
adjusted to suit reality through digitization skills and OpenStreetMap integrated into QGIS.
Accident data and ESS index are imported into QGIS at the data storage step to serve as a basis
for analysis and result visualization.
4. CASE STUDY OF TUYEN QUANG
4.1. Study data
In this study, Tuyen Quang province is selected to evaluate the traffic safety of its districts.
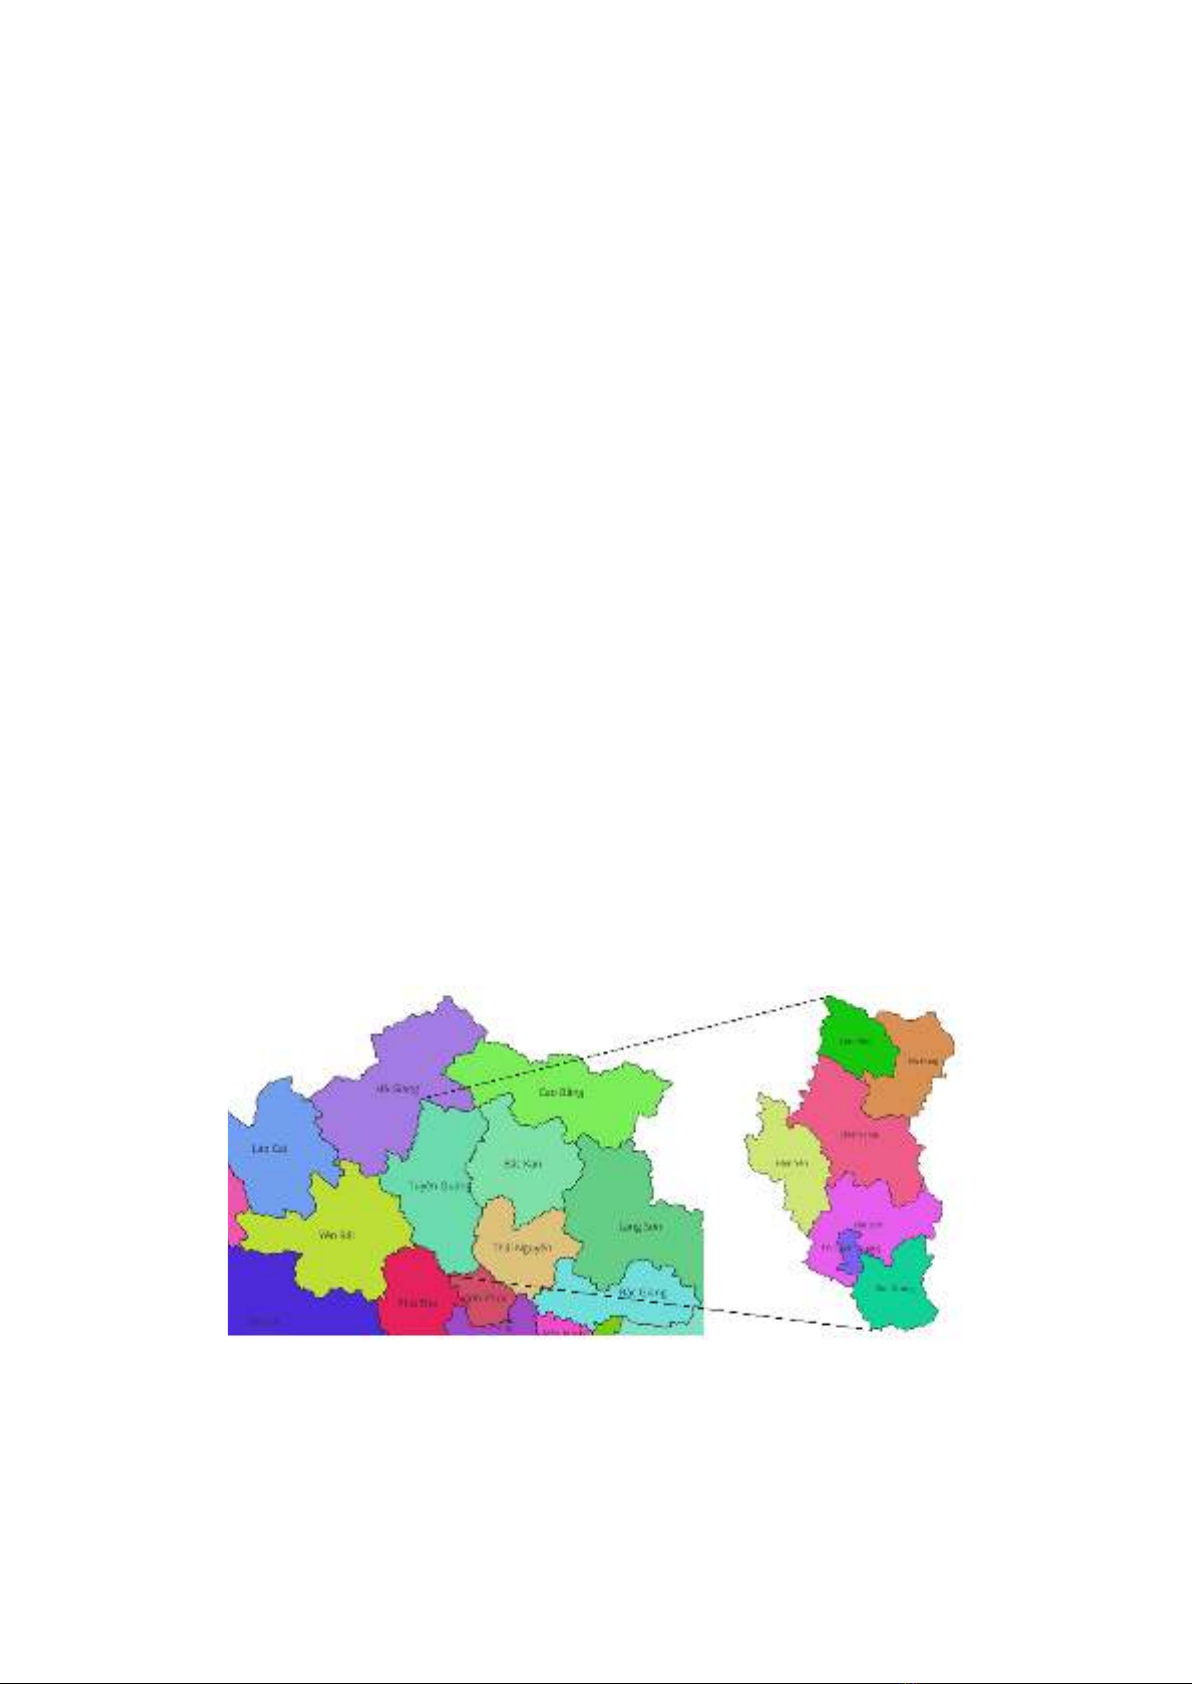
Located in the northeastern part of Vietnam to the northwest of Hanoi (Figure 1), Tuyen Quang
is a mountainous province that spans 5,867.3 square kilometers. The population of Tuyen
Quang reached 805,780 in 2022 with 13.88% of its population living in urban areas and the
remainder residing in rural areas. Tuyen Quang province is also known for its diverse
community with different ethnic groups, such as Kinh, Tay, Dao, San Chay, H’ Mong, etc. The
road traffic network of Tuyen Quang province has a total of 6,138 km of roads, including
national roads (563km), provincial roads (451km), urban roads (304km), countryside roads
(1,141km), and others (3,678km).
To assess the RTS of administrative units (or districts) in Tuyen Quang, this study uses
three different databases. First, the borders of the administrative units are provided in a shapefile
format. The seven administrative units in Tuyen Quang are Lam Binh, Na Hang, Chiem Hoa,
Ham Yen, Yen Son, Tuyen Quang City, and Son Duong (Figure 1). Second, a database of RTA
for the years 2021 to 2023 is supplied by the Tuyen Quang Department of Transport Police.
Third, data on the population in these administrative units is included to analyze the RTS as
well.
Source: Authors extracted from QGIS
Figure 1. Administrative map of Tuyen Quang province.
There were 209 cases of RTAs recorded on the road network of Tuyen Quang from 2021


![Bài giảng Quản lý vận hành và bảo trì công trình xây dựng [chuẩn nhất]](https://cdn.tailieu.vn/images/document/thumbnail/2025/20251006/agonars97/135x160/30881759736164.jpg)


![Ngân hàng câu hỏi trắc nghiệm Sức bền vật liệu 1: [Mô tả/Định tính Thêm để Tăng CTR]](https://cdn.tailieu.vn/images/document/thumbnail/2025/20250920/kimphuong1001/135x160/6851758357416.jpg)


![Trắc nghiệm Kinh tế xây dựng [chuẩn nhất]](https://cdn.tailieu.vn/images/document/thumbnail/2025/20250920/kimphuong1001/135x160/32781758338877.jpg)