RESEA R C H Open Access
Effects of pegylated G-CSF on immune cell
number and function in patients with
gynecological malignancies
Giuseppina Bonanno
1
, Annabella Procoli
1
, Andrea Mariotti
1
, Maria Corallo
1
, Alessandro Perillo
1
, Silvio Danese
2
,
Raimondo De Cristofaro
3
, Giovanni Scambia
1
, Sergio Rutella
4,5*
Abstract
Background: Pegylated granulocyte colony-stimulating factor (G-CSF; pegfilgrastim) is a longer-acting form of
G-CSF, whose effects on dendritic cell (DC) and regulatory T cell (Treg) mobilization, and on the in vivo and ex vivo
release of immune modulating cytokines remain unexplored.
Methods: Twelve patients with gynecological cancers received carboplatin/paclitaxel chemotherapy and single-
dose pegfilgrastim as prophylaxis of febrile neutropenia. Peripheral blood was collected prior to pegfilgrastim
administration (day 0) and on days +7, +11 and +21, to quantify immunoregulatory cytokines and to assess type 1
DC (DC1), type 2 DC (DC2) and Treg cell mobilization. In vitro-differentiated, monocyte-derived DC were used to
investigate endocytic activity, expression of DC maturation antigens and ability to activate allogeneic T-cell
proliferation.
Results: Pegfilgrastim increased the frequency of circulating DC1 and DC2 precursors. In contrast, CD4
+
FoxP3
+
bona fide Treg cells were unchanged compared with baseline. Serum levels of hepatocyte growth factor and
interleukin (IL)-12p40, but not transforming growth factor-b1 or immune suppressive kynurenines, significantly
increased after pegfilgrastim administration. Interestingly, pegfilgrastim fostered in vitro monocytic secretion of IL-
12p40 and IL-12p70 when compared with unconjugated G-CSF. Finally, DC populations differentiated in vitro after
clinical provision of pegfilgrastim were phenotypically mature, possessed low endocytic activity, and incited a
robust T-cell proliferative response.
Conclusions: Pegfilgrastim induced significant changes in immune cell number and function. The enhancement of
monocytic IL-12 secretion portends favorable implications for pegfilgrastim administration to patients with cancer,
a clinical context where the induction of immune deviation would be highly undesirable.
Background
Granulocyte colony-stimulating factor (G-CSF) can be
administered to healthy individuals donating hemato-
poietic stem cells (HSC) for transplantation and to can-
cer patients with the aim to prevent and/or treat
chemotherapy-induced neutropenia. Currently, primary
prophylaxis with G-CSF is recommended in patients at
high risk for febrile neutropenia based on age, medical
history, disease characteristics and myelotoxicity of the
chemotherapy regimen.
Filgrastim is a recombinant human G-CSF derived
from Escherichia coli. Filgrastim has a short elimination
half-life and requires daily subcutaneous injections for
each chemotherapy cycle. The inconvenience associated
with filgrastim administration has prompted the devel-
opment of its covalent conjugation with monomethoxy-
polyethylene glycol (PEG) to obtain a longer-acting form
(pegfilgrastim). The covalent attachment of PEG to the
N-terminal amine group of the parent molecule
increases its size, so that neutrophil-mediated clearance
predominates over renal clearance in elimination of the
drug, extending the median serum half-life of pegfilgras-
tim to 42 hours, compared with 3.5-3.8 hours for
* Correspondence: srutella@rm.unicatt.it
4
Department of Hematology, Catholic University Med. School, Rome, Italy
Full list of author information is available at the end of the article
Bonanno et al.Journal of Translational Medicine 2010, 8:114
http://www.translational-medicine.com/content/8/1/114
© 2010 Bonanno et al; licensee BioMed Central Ltd. This is an Open Access article distributed under the terms of the Creative
Commons Attribution License (http://creativecommons.org/licenses/by/2.0), which permits unrestricted use, distribution, and
reproduction in any medium, provided the original work is properly cited.

filgrastim [1]. However, the half-life is variable, depend-
ing on the absolute neutrophil count (ANC), which in
turn reflects the ability of pegfilgrastim to sustain neu-
trophil production. The PEG group in the pegfilgrastim
molecule is a relatively inert adduct and is expected not
to alter granulocyte function significantly compared
with filgrastim. In line with this assumption, pegfilgras-
tim retains the same biological activity as filgrastim, and
binds to the same G-CSF receptor, stimulating neutro-
phil proliferation, differentiation and activation.
The long-term effects of long-acting growth factors
such as pegfilgrastim are unknown. Because an increas-
ing number of healthy donors and cancer patients are
exposed to pharmacologic doses of G-CSF, a thorough
understanding of G-CSF effects is imperative to safe-
guard donor and patient safety. In this respect, there is
accumulating evidence that the biological activities of
G-CSF are not limited to the myeloid lineage but extend
to cell types and cytokine networks implicated in
inflammation, immunity and angiogenesis [2]. Initial
studiesinmicesupportedaroleforG-CSFinimmune
deviation towards T helper type 2 (Th2) cytokine pro-
duction [3]. In humans, G-CSF increases interleukin
(IL)-4 release and decreases interferon (IFN)-gproduc-
tion [4], induces immune modulatory genes in T cells,
including the Th2 master transcription factor GATA-3
[5], and promotes the differentiation of type 1 regulatory
T cells (Treg), endowed with the ability to release IL-10
and transforming growth factor (TGF)-b1, and to sup-
press T-cell proliferation in a cytokine-dependent man-
ner [6]. Furthermore, G-CSF induces the release of
hepatocyte growth factor (HGF) [7], a pleiotropic cyto-
kine that inhibits dendritic cell (DC) maturation [8] and
down-regulates immune responses in vivo [9]. Finally,
G-CSF mobilizes human type 2 DC (DC2) [10] and pro-
motes the in vitro differentiation of regulatory DC
through the stimulation of IL-10 and IFN-aproduction
[11]. On a molecular level, G-CSF may determine mito-
chondrial dysfunction and proliferation arrest in T cells
[12]. G-CSF-mobilized monocytes acquire the ability to
release large quantities of immunosuppressive IL-10 and
impair the induction of CD28-responsive complex in
CD4
+
T cells [13]. Similar to filgrastim, pegylated G-
CSF enhances the lipopolysaccharide (LPS)-stimulated
production of immune suppressive IL-10 and favorably
affects the clinical course of graft-versus-host disease
(GVHD) in mice [14].
It is presently unknown whether pegylated G-CSF
modulates human T-cell and DC function to a similar
extent as unconjugated G-CSF. The hypothesis that the
two formulations of G-CSF may target distinct cell
populations in vivo and that, in spite of structural simi-
larities, the spectrum of their biological activities may
diverge is supported by investigations with human
pegfilgrastim-mobilized HSC, which display unique fea-
tures compared with HSC mobilized by filgrastim [15].
The present study provides evidence that pegylated G-
CSF mobilizes both DC1 and DC2 precursors and, at
variance with filgrastim, promotes monocytic IL-12
release. These findings portend favorable implications
for pegfilgrastim administration to cancer patients.
Methods
Patient eligibility and treatment plan
The study population was comprised of 12 patients with
gynecological malignancies (7 ovarian, 4 endometrial, 1
cervical cancer) ranging in age from 38 to 78 years
(median age = 68 years). All patients received a conven-
tional chemotherapeutic regimen, consisting of carbo-
platin (AUC5) and paclitaxel (175 mg/square meter).
The patients’clinical characteristics are summarized in
Table 1. After the completion of chemotherapy, patients
were given a single dose (6 mg) of subcutaneous pegfil-
grastim (Neulasta®; Amgen Dompè, Milan, Italy), as pro-
phylaxis of febrile neutropenia. The investigations were
approved by the Institutional Review Board. A retro-
spective analysis of 7 registrational clinical trials that
examined the safety and efficacy of pegfilgrastim indi-
cated that serum pegfilgrastim concentrations are con-
sistently sub-therapeutic (< 2 ng/ml) by day +12 from
the commencement of treatment [16]. Taking advantage
of this knowledge, we collected blood samples from
each consented patient on day 0 (the day before che-
motherapy), and on days +7, +11 and +21.
A control group of 7 patients with gynecological
malignancies received the same carboplatin/paclitaxel
chemotherapy regimen, followed by daily filgrastim (5
μg/kg of body weight) from day +2 to day +10. Blood
samples for ex vivo studiesweredrawnonday0(the
day before chemotherapy) and on days +7, +11 (24
hours after the last filgrastim administration) and +21.
For both groups of patients, serum was obtained by cen-
trifugation at 4,000 rpm for 15 minutes shortly after
blood collection, was divided into aliquots and stored at
-80°C until used. Peripheral blood mononuclear cells
(PBMC) were separated by Ficoll-Hypaque density gra-
dient centrifugation, as previously reported [11], and
were used as detailed below.
Generation of monocyte-derived DC (Mo-DC) and
evaluation of DC endocytic activity
CD14
+
monocytes were purified by negative selection
(Monocyte Isolation Kit II, Miltenyi Biotec, Bergisch
Gladbach, Germany) and were cultured in RPMI-1640
medium for 6 days at 37°C under serum-free conditions
(10% BIT-9500; StemCell Technologies, Vancouver, BC)
but in the presence of 500 IU/ml recombinant human
GM-CSF and 25 ng/ml IL-4 (both cytokines were from
Bonanno et al.Journal of Translational Medicine 2010, 8:114
http://www.translational-medicine.com/content/8/1/114
Page 2 of 15

R&D Systems, Oxon, Cambridge, UK). When indicated,
the DC preparations were matured with 500 IU/ml
tumour necrosis factor-a(TNF-a; R&D Systems) for 48
hours. Patient serum obtained before (pre-G) or after G-
CSF administration (post-G) was supplemented to
freshly isolated monocytes at 20% (v/v). In selected
experiments, monocytes were stimulated in vitro with
LPS (1 μg/ml) for 24 hours, prior to the measurement
of secreted IL-12p40/IL-12p70 and IL-10 by ELISA.
To evaluate DC endocytic activity [17], monocyte-
derived DC populations were suspended in culture med-
ium supplemented with 10% fetal calf serum (FCS) in
the presence of 100 μg/ml FITC-dextran (Sigma Chemi-
cal Co., St. Louis, MO) for 1 hour at 37°C. Control DC
cultures were pulsed with FITC-dextran at 4°C, as pre-
viously detailed [8]. The extent of FITC-dextran incor-
poration was expressed as the ratio between the mean
fluorescence intensity (MFI)ofsampleskeptat37°C
and the MFI of samples cultured at 4°C, as detailed in
the Figure legends.
T-cell isolation and primary MLR
CD4
+
T cells were isolated from the peripheral blood
with an indirect magnetic labeling system (CD4
+
TCell
Isolation Kit II; Miltenyi Biotec). Briefly, PBMC were
labeled with a cocktail of biotin-conjugated antibodies
against CD8, CD14, CD16, CD19, CD36, CD56, CD123,
TCR g/δand CD235a. Anti-biotin microbeads were used
for depletion, yielding a population of highly pure,
untouched CD4
+
T cells. CD25 microbeads II (Miltenyi
Biotec) were subsequently used for positive selection or
depletion of CD25
+
cells, following the manufacturer’s
instructions.
CD4
+
CD25
-
T cells were re-suspended in RPMI-1640
containing carboxyfluorescein-diacetate succinimidyl-
ester (CFDA-SE, 2.5 μM; Molecular Probes, Eugene,
OR) for 10 minutes at 37°C. To quench the labeling
process, an equal volume of FCS was added. After wash-
ings in RPMI-1640 medium supplemented with 10%
FCS, CD4
+
CD25
-
T cells were activated with the mixed
leukocyte reaction (MLR), as reported elsewhere [6].
Briefly, 5 × 10
4
allogeneic CD4
+
CD25
-
T cells were cul-
tured with fixed numbers of irradiated (25 Gy) DC or
monocytes for 7 days, in RPMI-1640 medium supple-
mented with 20% BIT serum substitute. In selected
experiments, serum from patients given either pegfil-
grastim or filgrastim was supplemented at 20% (v/v) to
the allogeneic MLR containing T cells and monocytes/
DC from third-party healthy donors, as previously
detailed [18].
Immunological markers, four-color flow cytometry and
data analysis
Mo-DC and monocytes were incubated for 20 minutes
at 4°C with the following FITC-, PE-, PerCP- or PE-
Cy7-conjugated monoclonal antibodies (mAb): CD1a,
CD11c, CD14, CD80, CD86, CD83 (Caltag Laboratories,
Burlingame, CA), HLA-DR, CD11c and IL-3 receptor a-
chain or CD123 (BD Biosciences, Mountain View, CA),
immunoglobulin-like transcript 3 (ILT3), DC-SIGN
(DC-specific ICAM-3 grabbing non-integrin; CD209;
Immunotech, Marseille, France), or with the appropriate
fluorochrome-conjugated, isotype-matched irrelevant
mAb to establish background fluorescence.
To monitor DC mobilization, peripheral blood sam-
ples were stained with a cocktail of FITC-conjugated
mAb directed against lineage-specific antigens (CD4,
CD14, CD16, CD19, CD20, CD56; Lineage Cocktail 1,
BD Biosciences), and with anti-CD123, anti-HLA-DR
and anti-CD11c mAb (BD), in order to discriminate
Table 1 Patients’characteristics
Patient Tumor (histotype) FIGO Stage Tumor grade Number of previous chemotherapy cycles
UPN #1 Endometrial carcinoma (endometrioid) Ic G3 4
UPN #2 Endometrial carcinoma (serous) IV G3 5
UPN #3 Ovarian carcinoma (serous) IIIb G3 4
UPN #4 Cervical carcinoma (squamous) Ib2 G2 2
UPN #5 Ovarian carcinoma (serous) IIIc G3 3
UPN #6 Endometrial carcinoma (mixed) Ic G2 1
UPN #7 Ovarian carcinoma (serous) Ic G3 4
UPN #8 Ovarian carcinoma IIIc G3 4
UPN #9 Ovarian carcinoma (serous) IIIc G3 4
UPN #10 Endometrial carcinoma (endometrioid) Ic G3 4
UPN #11 Ovarian carcinoma (endometrioid) IIIc G3 3
UPN #12 Ovarian carcinoma (endometrioid) IIIb G2 4
The demographic characteristics of the 12 patients enrolled in this study are shown. Patients had not received any chemotherapy in the 21 days preceding the
commencement of the carboplatin/paclitaxel regimen (see Materials and Methods for further details). FIGO = International Federation of Gynecologyand
Obstetrics. UPN = Unique Patient Number.
Bonanno et al.Journal of Translational Medicine 2010, 8:114
http://www.translational-medicine.com/content/8/1/114
Page 3 of 15

type 1 DC (DC1) from DC2. Cells were then incubated
with ammonium chloride lysis buffer for 5 minutes to
remove residual red blood cells. Unfractionated whole
blood samples were gated on the basis of forward and
side scatter characteristics. After gating on lineage
-
HLA-
DR
+
events, two populations of DC were identified, cor-
responding to HLA-DR
+
CD11c
+
DC (DC1) and HLA-
DR
+
CD123
+
DC (DC2), as previously published [10].
The proportion of DC1 and DC2 within lineage
-/dim
cells was enumerated and expressed as a percentage of
total leukocytes.
The analysis of CFDA-SE fluorescence in cell prolif-
eration tracking assays was performed with the prolif-
eration wizard of the ModFit™LT 2.0 software (Verity
Software House Inc., Topsham, ME). Replication data
were expressed in terms of proliferation index (PI),
which was calculated as previously detailed [12].
The frequency of CD4
+
FoxP3
+
Treg cells in the per-
ipheral blood of G-CSF-treated patients and in MLR
cultures was estimated with an anti-FoxP3 mAb
(PCH101 clone; eBioscience, San Diego, CA). Cells were
initially stained with fluorochrome-conjugated anti-CD4
and anti-CD25 mAb (BD Biosciences), followed by
sequential cell fixation and permeabilization and by
labeling with the Alexa-Fluor® 488-conjugated anti-
human FoxP3 mAb.
All samples were run through a FACS Canto® flow
cytometer (BD Biosciences) with standard equipment.
Analysis of cytokine production
IL-12p40, IL-12p70, IL-10, TGF-b1 and HGF levels in
patient serum and in culture supernatants were quanti-
fied by ELISA, using commercially available reagents
(R&D Systems). The limits of detection were < 15 pg/ml
IL-12p40, 0.625 pg/ml IL-12p70, 7.8 pg/ml IL-10, 7 pg/
ml TGF-b1 and <40 pg/ml HGF.
HPLC measurement of tryptophan (Trp) and kynurenine
(Kyn)
Quantification of serum Trp and Kyn was obtained using
reverse-phase (RP)-HPLC. The chromatographic proce-
dure was similar to a method previously described, with
minor modifications [19]. In brief, sample aliquots (100
μL) were deproteinized with HClO
4
(0.3 M final concen-
tration). After centrifugation (14,000 rpm for 15 min-
utes), the supernatants were spiked with 50 μM3-L-
nitrotyrosine and analyzed using a ReproSil-Pur C18-AQ
(4 × 250 mm, 5 μM granulometry) RP-HPLC column
(Dr. Maisch GmbH, Ammerbuch-Entringen, Germany),
using a double-pump HPLC apparatus from Jasco
(Tokyo, Japan) equipped with a mod. 2070 UV spectro-
photometric detector and a FP-2020 fluorescence detec-
tor. Both detectors were connected in series to allow
simultaneous measurements. The chromatographic peaks
were detected by recording UV absorbance at 360 nm
and emission fluorescence at 366 nm, after excitation at
286 nm. The elution solvent was: 2.7% CH
3
CN in 15 mM
acetate buffer, pH 4.00 (both HPLC-grade from Fluka,
Milan, Italy). To control the set-up and for peak quantifi-
cation, Borwin 1.5 and MS Excel software were used. The
concentrations of components were calculated according
to peak heights and were compared both with 3-nitro-L-
tyrosine as the internal standard and with the reference
curves constructed with Kyn and L-Trp, both purchased
from Sigma-Aldrich.
Statistical analysis
The approximation of data distribution to normality was
tested preliminarily using statistics for kurtosis and sym-
metry. Data were presented as median and interquartile
range, and comparisons were performed with the Mann-
Whitney test for paired or unpaired data, or with the
Kruskal-Wallis test with Dunn’s correction for multiple
comparisons, as appropriate. The criterion for statistical
significance was defined as p≤0.05.
Results
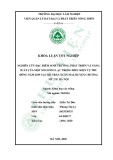
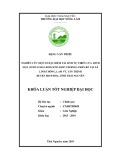
Effects of pegylated G-CSF on leukocyte subsets
Patients were initially evaluated for their white blood
cell (WBC) and absolute neutrophil count (ANC) in
response to pegfilgrastim. As depicted in Figure 1, both
the WBC count and the ANC significantly increased on
day +11 compared with pre-treatment values (p=
0.0002 and p= 0.033, respectively) and returned to
baseline on day +21. Notably, filgrastim promoted a
greater increase of WBC and neutrophils compared with
pegfilgrastim, peaking on day +11 after the commence-
ment of cytokine treatment (p= 0.0085 and p= 0.028
compared with baseline, respectively). Specifically, a
median of 16.5 × 10
3
WBC/μlofblood(range7.74-
36.82) were counted in day +11 samples from filgras-
tim-treated patients compared with 11.64 × 10
3
WBC/μl
of blood (range 6.88-15.78) in patients given pegfilgras-
tim (p< 0.05). Similarly, the ANC was significantly
higher on day +11 after filgrastim administration (13.6 ×
10
3
/μl, range 5.54-31.81) compared with the pegfilgras-
tim group (7.91 × 10
3
/μl, range 3.39-13.6; p< 0.05).
It has been previously shown that unconjugated G-
CSF increases the number of lymphoid progenitors,
mature lymphocytes and monocytes when administered
to healthy HSC donors [20]. In our cohort of cancer
patients, both pegfilgrastim and filgrastim significantly
enhanced lymphocyte (p= 0.0002 and p= 0.0093,
respectively) and monocyte counts (p< 0.0001 and p=
0.013, respectively) compared with baseline, peaking on
day +11 from the commencement of cytokine treatment
(Figure 1). Again, monocyte counts were significantly
higher in patients treated with daily filgrastim (0.8 × 10
3
Bonanno et al.Journal of Translational Medicine 2010, 8:114
http://www.translational-medicine.com/content/8/1/114
Page 4 of 15
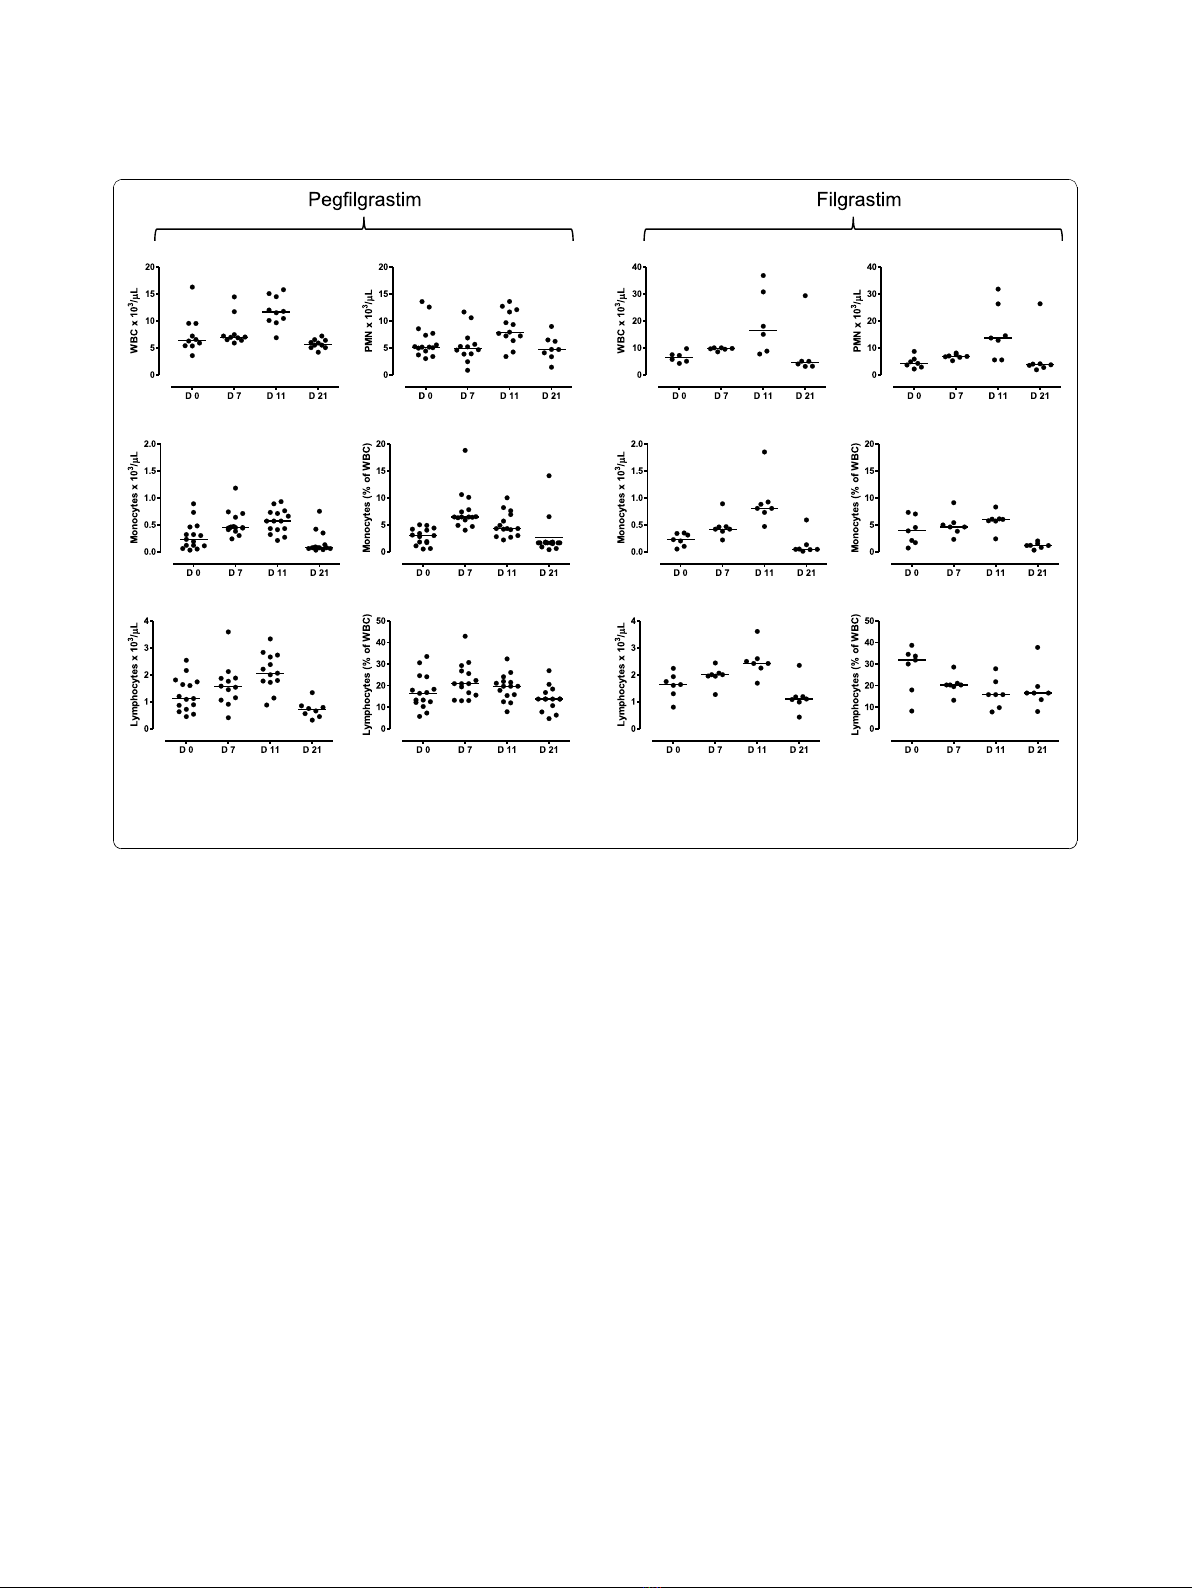
cells/μl, range 0.47-1.85, on day +11) compared with
patients given pegfilgrastim (0.57 × 10
3
cells/μl, range
0.21-0.93; p= 0.04). Neither lymphocyte nor monocyte
count at baseline differed significantly in the two patient
cohorts (lymphocyte count = 1.69 × 10
3
cells/μl, range
0.8-2.24; and 1.21 × 10
3
cells/μl, range 0.45-2.54, in the
filgrastim and pegfilgrastim group, respectively; mono-
cyte count = 0.25 × 10
3
cells/μl, range 0.05-0.35; and
0.23 ± 0.06 × 10
3
cells/μl, range 0.03-0.89, in the filgras-
tim and pegfilgrastim group, respectively), suggesting
that the sharper elevation of monocyte counts likely
reflected an intrinsic ability of filgrastim to mobilize
cells of the monocytic lineage. The observed changes in
leukocyte subsets were transient, as indicated by the
recovery of pre-treatment values by day +21 (Figure 1).
Importantly, both the absolute number and the fre-
quency of lymphocytes and monocytes increased as a
result of pegfilgrastim administration (Figure 1), indicat-
ing the occurrence of mobilization and/or recruitment
from peripheral sites into the circulation. However, the
relative distribution of CD4
+
T cells, CD8
+
T cells,
CD19
+
B cells and NK cells (defined as CD3
-
CD16
+
CD56
+
cells) within the lymphocyte population was
unaffected by pegfilgrastim administration (data not
shown). In sharp contrast to pegfilgrastim, filgrastim
was unable to affect the frequency of lymphocytic and
monocytic cells, as shown in Figure 1. The percentage
of lymphocytes within total leukocytes was even lower
on days +7 and +11 after filgrastim administration com-
pared with baseline. Not unexpectedly, treatment with
pegfilgrastim was associated with the mobilization of
CD34-expressing HSC, which peaked on day +11 from
cytokine treatment (4.2 cells/μl, range 2-23.1, compared
with 0.9 cells/μl, range 0.5-10.4, at baseline; p<0.05)
and declined to pre-treatment values by day +21 (0.8
cells/μl, range 0.25-2).
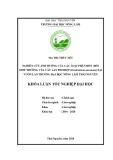
Mobilization of DC subsets and Treg cells
We next investigated whether pegfilgrastim induced
changes in the frequency of circulating DC precursors.
Cells were initially gated based on lack of expression of
surface antigens associated with lineage differentiation,
as detailed in Materials and Methods. A representative
flow cytometry profile is shown in Figure 2A. Lineage
-
cells were then analyzed for their expression of HLA-
DR in association with CD11c (DC1) or CD123 (DC2),
recognizing the IL-3 receptor achain. Figure 2B depicts
the cumulative frequency of DC1 and DC2 cells within
Figure 1 Changes in leukocyte subsets in patients receiving growth factor support. Leukocytes, neutrophils, monocytes and lymphocytes
were enumerated with automated hematology analyzers before chemotherapy (day 0) and on days +7, +11 and +21 from G-CSF administration.
Bars depict median values. The results of statistical comparisons among baseline and post-treatment samples and between the two study
groups have been detailed in the main text.
Bonanno et al.Journal of Translational Medicine 2010, 8:114
http://www.translational-medicine.com/content/8/1/114
Page 5 of 15


%20--%3e%3cdefs%3e%3cstyle%3e%20.st0%20{%20fill:%20%23fff;%20}%20.st1%20{%20fill:%20%237800fa;%20}%20%3c/style%3e%3c/defs%3e%3cpath%20class='st1'%20d='M117.78,12.18H43.11c2.9,3.47,4.65,7.94,4.65,12.82,0,5.6-2.3,10.66-6.01,14.29h76.02l7.22-13.56-7.22-13.56Z'/%3e%3cg%3e%3cpath%20class='st0'%20d='M53.58,26.17h-.59v-1.46h.59v-4.96h2.83c1.78,0,2.67.94,2.67,2.82v5.76c0,1.87-.89,2.81-2.67,2.81h-2.83v-4.96ZM55.36,21.37v3.34h1.1v1.46h-1.1v3.34h1.01c.61,0,.91-.37.91-1.1v-5.93c0-.74-.3-1.1-.91-1.1h-1.01Z'/%3e%3cpath%20class='st0'%20d='M65.99,31.14h-1.8l-.31-2.07h-2.19l-.31,2.07h-1.64l1.82-11.39h2.62l1.82,11.39ZM65.28,18.04c-.25.46-.51.77-.75.94-.21.15-.47.22-.79.22-.26,0-.57-.07-.92-.22l-.38-.15c-.14-.05-.26-.07-.37-.07-.3,0-.53.18-.71.54l-.91-.68c.25-.46.51-.77.75-.94.21-.14.48-.21.79-.21.26,0,.57.07.92.21l.38.15c.14.05.26.07.37.07.3,0,.53-.18.71-.54l.91.68ZM61.91,27.52h1.73l-.87-5.76-.87,5.76Z'/%3e%3cpath%20class='st0'%20d='M74.53,26.89v1.52c0,1.91-.89,2.86-2.67,2.86s-2.67-.95-2.67-2.86v-5.93c0-1.91.89-2.86,2.67-2.86s2.67.95,2.67,2.86v1.11h-1.69v-1.22c0-.75-.31-1.12-.93-1.12s-.93.37-.93,1.12v6.15c0,.74.31,1.11.93,1.11s.93-.37.93-1.11v-1.63h1.69Z'/%3e%3cpath%20class='st0'%20d='M81.4,31.14h-1.8l-.31-2.07h-2.19l-.31,2.07h-1.64l1.82-11.39h2.62l1.82,11.39ZM75.9,19.2l1.52-1.91h1.71l1.51,1.91h-1.61l-.76-.95-.75.95h-1.61ZM77.32,27.52h1.73l-.87-5.76-.87,5.76ZM83.1,15.99l-1.76,1.91h-1.26l1.17-1.91h1.86Z'/%3e%3cpath%20class='st0'%20d='M84.86,19.75c1.78,0,2.67.94,2.67,2.82v1.48c0,1.87-.89,2.81-2.67,2.81h-.85v4.28h-1.79v-11.39h2.64ZM84.01,21.37v3.86h.85c.58,0,.87-.36.87-1.08v-1.71c0-.71-.29-1.07-.87-1.07h-.85Z'/%3e%3cpath%20class='st0'%20d='M93.51,19.75c1.78,0,2.67.94,2.67,2.82v1.48c0,1.87-.89,2.81-2.67,2.81h-.85v4.28h-1.79v-11.39h2.64ZM92.66,21.37v3.86h.85c.58,0,.87-.36.87-1.08v-1.71c0-.71-.29-1.07-.87-1.07h-.85Z'/%3e%3cpath%20class='st0'%20d='M98.8,31.14h-1.79v-11.39h1.79v4.88h2.03v-4.88h1.83v11.39h-1.83v-4.88h-2.03v4.88Z'/%3e%3cpath%20class='st0'%20d='M105.36,24.55h2.46v1.62h-2.46v3.34h3.09v1.63h-4.88v-11.39h4.88v1.63h-3.09v3.18ZM108.17,17.29l-1.76,1.91h-1.26l1.17-1.91h1.86Z'/%3e%3cpath%20class='st0'%20d='M112.2,19.75c1.78,0,2.67.94,2.67,2.82v1.48c0,1.87-.89,2.81-2.67,2.81h-.85v4.28h-1.79v-11.39h2.64ZM111.35,21.37v3.86h.85c.58,0,.87-.36.87-1.08v-1.71c0-.71-.29-1.07-.87-1.07h-.85Z'/%3e%3c/g%3e%3ccircle%20class='st1'%20cx='25'%20cy='25'%20r='20'/%3e%3cpath%20class='st0'%20d='M32.78,19.27c2.92,0,4.43,2.55,5.28,5.33l.71,2.17c.14.38-.33.75-.71.75h-5.61c.19-.33.24-.71.09-1.08l-.75-2.45c-.43-1.32-.99-2.64-1.79-3.77.75-.57,1.65-.94,2.78-.94h0ZM25,18.38c3.25,0,4.9,2.78,5.89,5.89l.76,2.45c.14.42-.33.8-.8.8h-11.69c-.42,0-.94-.38-.8-.8l.75-2.45c.99-3.11,2.64-5.89,5.89-5.89h0ZM25,11.35c1.74,0,3.11,1.37,3.11,3.11s-1.37,3.11-3.11,3.11-3.11-1.41-3.11-3.11,1.41-3.11,3.11-3.11h0ZM17.27,19.27c1.08,0,1.98.38,2.73.94-.8,1.13-1.37,2.45-1.74,3.77l-.8,2.45c-.14.38-.05.75.09,1.08h-5.56c-.42,0-.9-.38-.75-.75l.71-2.17c.9-2.78,2.41-5.33,5.33-5.33h0ZM17.27,12.91c1.51,0,2.78,1.27,2.78,2.83s-1.27,2.83-2.78,2.83-2.83-1.27-2.83-2.83,1.27-2.83,2.83-2.83h0ZM32.78,12.91c1.56,0,2.78,1.27,2.78,2.83s-1.23,2.83-2.78,2.83-2.83-1.27-2.83-2.83,1.27-2.83,2.83-2.83h0ZM27.07,28.56v.09c0,.57-.24,1.08-.61,1.46h0v.05c-.38.33-.9.57-1.46.57s-1.08-.24-1.46-.61h0c-.38-.38-.61-.9-.61-1.46v-.09h1.41v.09c0,.19.05.38.19.47v.05c.09.09.28.19.47.19s.38-.09.47-.19v-.05c.14-.09.24-.28.24-.47t-.05-.09h1.41ZM30.99,28.56v.09c0,1.65-.66,3.16-1.74,4.24-1.08,1.08-2.59,1.79-4.24,1.79s-3.16-.71-4.24-1.79l-.05-.05c-1.04-1.08-1.7-2.55-1.7-4.2v-.09h1.41v.09c0,1.27.47,2.4,1.27,3.25h.05c.85.85,1.98,1.37,3.25,1.37s2.4-.52,3.25-1.37c.85-.8,1.37-1.98,1.37-3.25v-.09h1.37ZM34.99,28.56v.09c0,2.78-1.13,5.28-2.92,7.07-1.79,1.79-4.29,2.92-7.07,2.92s-5.23-1.13-7.07-2.92c-1.79-1.79-2.92-4.29-2.92-7.07v-.09h1.41v.09c0,2.4.94,4.53,2.5,6.08,1.56,1.56,3.72,2.5,6.08,2.5s4.52-.94,6.08-2.5c1.56-1.56,2.5-3.68,2.5-6.08v-.09h1.41Z'/%3e%3c/svg%3e)