RESEARC H Open Access
Food assistance is associated with improved
body mass index, food security and attendance
at clinic in an HIV program in central Haiti:
a prospective observational cohort study
Louise C Ivers
1,2,3,4*†
, Yuchiao Chang
3,4†
, J Gregory Jerome
5†
, Kenneth A Freedberg
3,4†
Abstract
Background: Few data are available to guide programmatic solutions to the overlapping problems of
undernutrition and HIV infection. We evaluated the impact of food assistance on patient outcomes in a
comprehensive HIV program in central Haiti in a prospective observational cohort study.
Methods: Adults with HIV infection were eligible for monthly food rations if they had any one of: tuberculosis,
body mass index (BMI) <18.5kg/m
2
, CD4 cell count <350/mm
3
(in the prior 3 months) or severe socio-economic
conditions. A total of 600 individuals (300 eligible and 300 ineligible for food assistance) were interviewed before
rations were distributed, at 6 months and at 12 months. Data collected included demographics, BMI and food
insecurity score (range 0 - 20).
Results: At 6- and 12-month time-points, 488 and 340 subjects were eligible for analysis. Multivariable analysis
demonstrated that at 6 months, food security significantly improved in those who received food assistance versus
who did not (-3.55 vs -0.16; P < 0.0001); BMI decreased significantly less in the food assistance group than in the
non-food group (-0.20 vs -0.66; P = 0.020). At 12 months, food assistance was associated with improved food
security (-3.49 vs -1.89, P = 0.011) and BMI (0.22 vs -0.67, P = 0.036). Food assistance was associated with improved
adherence to monthly clinic visits at both 6 (P < 0.001) and 12 months (P = 0.033).
Conclusions: Food assistance was associated with improved food security, increased BMI, and improved adherence
to clinic visits at 6 and 12 months among people living with HIV in Haiti and should be part of routine care where
HIV and food insecurity overlap.
Introduction
Food insecurity and undernutrition are increasingly
recognized as factors that are important in the health and
livelihoods of individuals living with HIV infection in
poor settings [1,2]. HIV infection has long been asso-
ciated with wasting syndrome and being underweight
with HIV is predictive of a poor prognosis, even in people
receiving antiretroviral therapy (ART) [1,3-5]. Food inse-
curity–meaning lack of access to food of sufficient quality
and quantity to perform usual daily activities–contributes
to a negative cycle of events that often worsens the effect
of HIV infection on ability to work, attend school, contri-
bute to family livelihoods and adhere to medications
[6-8]. International organizations have called for food
assistance to be integrated into HIV treatment and pre-
vention programs, but evidence-based guidance on how
exactly to implement such programs, on what benefici-
aries to target, and on what the optimal components or
duration of food assistance should be is limited [9-14].
A recent study showed that food rations were associated
with improved adherence to ART, but these data did not
show any quantitative clinical benefit [15].
Attention to adequate nutrition during HIV care has the
potential to contribute to improved clinical HIV-related
* Correspondence: livers@pih.org
†Contributed equally
1
Division of Global Health Equity, Brigham and Women’s Hospital, Boston,
Massachusetts, USA
Full list of author information is available at the end of the article
Ivers et al.AIDS Research and Therapy 2010, 7:33
http://www.aidsrestherapy.com/content/7/1/33
© 2010 Ivers et al; licensee BioMed Central Ltd. This is an Open Access article distributed under the terms of the Creative Commons
Attribution License (http://creativecommons.org/licenses/by/2.0), which permits unrestricted use, distribution, and reproduction in
any medium, provided the original work is properly cited.

outcomes, improved nutritional outcomes for the indivi-
dual, as well as improved coping strategies and ability of
individuals to contribute to livelihoods at the household
level. Although the qualitative effect of food on relieving
hunger is not in doubt, the quantitative benefits of food
assistance on individuals or on families has rarely been
studied in the context of HIV [16]. As a result of political
instability, environmental degradation, poverty and recur-
rent natural disasters, Haiti is extremely vulnerable to food
insecurity. The aim of this study was to determine the
impact of targeted food assistance on the body mass index
(BMI), quality of life and household food security of peo-
ple living with HIV in a comprehensive health program in
central Haiti.
Methods
The study was a prospective observational cohort study
of 600 people living with HIV enrolled in HIV care in
Partners In Health (PIH) programs in rural Haiti. PIH is
a non-profit organization working in conjunction with
the Ministry of Health of Haiti to provide comprehen-
sive primary healthcare services, including HIV care, in
two departments in rural Haiti. In May 2006, PIH
enteredintocollaborationwiththeWorldFoodPro-
gramme (WFP) to provide food rations for beneficiaries
living with HIV. Because available rations were limited,
beneficiaries of the program were determined by a set of
criteria agreed upon in advance by WFP and PIH pro-
gram staff, including clinicians, social workers, and ethi-
cists. Adults received twelve months of food assistance
if they had HIV and any one of: co-infection with active
TB, CD4 count less than 350 cells/mm
3
in the prior
three months, BMI less than 18.5 or severe socioeco-
nomic circumstances (based on social worker assess-
ment and clinical team consensus). A standard
pre-determined WFP family ration was provided by pre-
scription monthly. The ration contained 50 gm of cereal,
50 gm of dried legumes, 25 gm of vegetable oil, 100 gm
of corn-soya blend and 5 gm of iodized salt for each of
3 family members (approximately 949 kilocalories) per
person per day.
Three PIH clinic sites were included in the study (one
rural, one urban, one semi-urban). At each site the first
100 individuals eligible for food assistance and first 100
ineligible for food assistance by the criteria defined
above were invited to participate in the study. Indivi-
duals were eligible for interview if they were living with
HIV, were being assessed by the clinical team for elig-
ibility for the food program, were over the age of 18
years and were not pregnant at the time of interview.
Combination ART is offered to those with HIV infec-
tion and CD4 counts less than 350 cells/mm
3
or with
World Health Organization clinical criteria to begin
treatment. Pregnant women are offered ART for their
own health when CD4 count is less than 350 cells/mm
3
or at 28 weeks of gestation for prevention of mother-to-
child transmission. Weight is measured routinely during
patient monthly visits to clinic. Height was measured
for adults at the beginning of the WFP collaboration
using a clinic-installed stadiometer to allow calculation
of BMI by clinic staff. In addition to medical care,
attention is paid to the socioeconomic causes and con-
tributors to disease and ill-health, and social assistance
programs make small grants for commerce or housing
repair available. All care is provided free of charge to
patients [17].
Surveys
Individuals were interviewed before rations were distrib-
uted and at 6 months and 12 months after food assis-
tance began. Data collected in surveys included
demographics, education level, BMI, food insecurity
score and quality of life. Additional information was
abstracted from the respondent’s electronic medical
record including CD4 count, timely attendance at pre-
scribed monthly clinic visits, weight, BMI and pick up of
prescribed food rations. Food insecurity score was mea-
sured using the Household Food Insecurity Access Scale
(HFIAS) [18]. In this scale (ranging from 0 for best food
security to 20 for worst), points are attributed for items
that relate to the availability of food in the household.
The authors had previously refined and adapted this
questionnaire for use in rural Haiti using the methods
recommended by Coates et al [18,19]. Quality of life
was measured using role-functioning and performance-
functioning domains adapted from the AIDS Clinical
Trials Group SF-2, with scores ranging from 0 to 100
[20]. Instruments were translated into Haitian Creole
and back-translated to English for accuracy. Interviews
were performed by native Haitian Creole speakers. Data
were double-punch entered into MS Access database.
Ethics committee approval was received for the study
from the Zanmi Lasante (Partners In Health) Ethics
Committee in Haiti and by the Institutional Review
Board at Brigham and Women’s Hospital, Boston, MA,
USA.
Analysis
Duration on ART was determined for each respondent
at the time of entry into the study and the respondent
analyzed in this category throughout the study: ‘never
on ART’,‘on ART < 12 months, ‘on ART ≥12 months’.
Active TB infection was an absolute indication for
receiving food assistance in the PIH program. Since no
active TB patient would be found in the ‘non-interven-
tion’group, and because TB contributes to weight loss
independently of HIV infection, subjects that had active
TBduringtheperiodofthestudywereexcludedfrom
Ivers et al.AIDS Research and Therapy 2010, 7:33
http://www.aidsrestherapy.com/content/7/1/33
Page 2 of 8

the final analysis. Subjects that were either enrolled in
or discontinued from food rations by the clinical team
during the period of the study were also excluded from
the final analysis (’as-treated analysis’). Individuals were
also excluded from analysis if they became pregnant
during the study. BMI analysis was limited to those with
weight available (N = 4). We also performed a sensitivity
analysis using an ‘intention to treat’approach, including
all subjects based on their enrollment status at the time
of baseline evaluation. For those with missing food
security items, the response was replaced by the median
value from all respondents in the same phase of the
study (i.e. baseline, 6 months or 12 months). We also
performed a sensitivity analysis using the E-M algorithm
to impute missing food security items at 6 and 12
months.
Baseline data were summarized using mean/standard
deviation (SD) or percentage and compared between the
‘no food assistance’group and the ‘food assistance’
group using two-sample t-tests or Chi-square tests.
Continuous outcomes of change from baseline were
summarized using mean/standard error (SE). In the uni-
variate analysis, Wilcoxon rank sum tests were used to
compare continuous outcomes while repeated measures
logistic regression with Generalized Estimating Equa-
tions (GEEs) were used to compare dichotomized out-
comes. In the multivariable analysis, linear regression
and repeated measures logistic regression analysis were
used to compare the change from baseline between the
two groups controlling for other factors. All analyses
were performed using SAS version 9.2 (SAS Institute,
Cary, NC).
Results
Between May and July 2006, 600 adults were enrolled
across the three clinical sites. At 6- and 12-month fol-
low ups, 488 and 340 individuals were eligible for the
analysis (Figure 1).
Baseline Characteristics
The488adultsinthestudywhowereeligiblefor
6-month follow up had mean (SD) age of 36 years (10);
60% were female (Table 1). The majority of participants
(71.7%) spent all or most of their monthly income on
food. At baseline, 148 (30.3%) were not on antiretroviral
therapy (ART), 279 (57.2%) had been on ART for ≥12
months, and 61 (12.5%) had been on ART for <12
months. At baseline, compared to the group that did
receive food assistance, the group receiving no food
assistance contained fewer individuals on ART [N = 145
(57.8%) vs. N = 195 (82.3%), P < 0.0001], had better
food security (13.9 vs. 15.4, P < 0.0001), had higher BMI
(22.4 vs. 20.4, P < 0.0001) and had more individuals
sharing household meals on average (6.7 vs.6.1,
P = 0.035). Similar patterns persisted in the assessment
of the 340 subjects eligible for 12-month follow up.
Food Insecurity and Body Mass Index
In univariate analysis at 6 and 12 months, food security
was improved in the group that received food compared
to the non-food group (Table 2). On a scale of 0 (best)
to 20 (worst), mean change (SD) in food insecurity
score in the food assistance group was -3.55 compared
to -0.16 in the non-food group at 6 months (P < 0.0001)
and -3.49 compared to -1.89 at 12 months (P = 0.011).
At 6 months, BMI decreased in both groups, but fell
less in the food assistance group compared to the non-
food group (-0.20 vs. -0.66, P = 0.012). At 12 months,
BMI increased in the food group and decreased in the
non-food group (+0.22 vs. -0.67, P = 0.002).
Adherence to clinic visits and medications
At both 6 and 12 months, timely attendance at monthly
clinic visits was better in the food assistance group than
in the non-food group. The mean number of scheduled
visits attended at 6 months (out of 6 visits) was 5.49 vs.
2.82 (P < 0.0001) for the food assistance vs. the non-
food group, and at 12 months (out of 12 visits) was 9.73
vs. 8.34 (P = 0.007).
Quality of life
There was no statistical difference in role-functioning
qualityoflife(QOL)betweenthegroupsat6months.
At 12 months, mean role-functioning QOL score
increased in the food assistance group (3.72) and
decreased in the non-food group (-3.80), however the
difference did not reach significance level (P = 0.13).
Performance-functioning QOL had a slightly greater
increase at 6 months in the food assistance group com-
pared to the non-food group (mean change 10.69 vs.
5.31, P = 0.055). There was no difference at 12 months
between the two groups (8.76 vs.9.47, P = 0.48).
Among those on ART, at 6 months, those receiving
food assistance reported fewer difficulties taking their
medications compared to those who did not receive
food (14.4% vs. 28.1%, P = 0.001). At 12 months,
although a difference remained between the groups
(11.0% vs. 18.8%), it did not reach statistical significance
level (P = 0.068). There were no significant differences
between groups at either 6 or 12 months in terms of
ability to save money in case of disaster, spending on
agriculture or education, or spending on livestock.
There was also no statistical difference in outcomes of
died or abandoned care at 6 or 12 months.
There were 129 individuals who changed from the
non-food group to the food assistance group during the
course of the study. Most (N = 121) of these changes
occurred during the second half of the study in the
Ivers et al.AIDS Research and Therapy 2010, 7:33
http://www.aidsrestherapy.com/content/7/1/33
Page 3 of 8
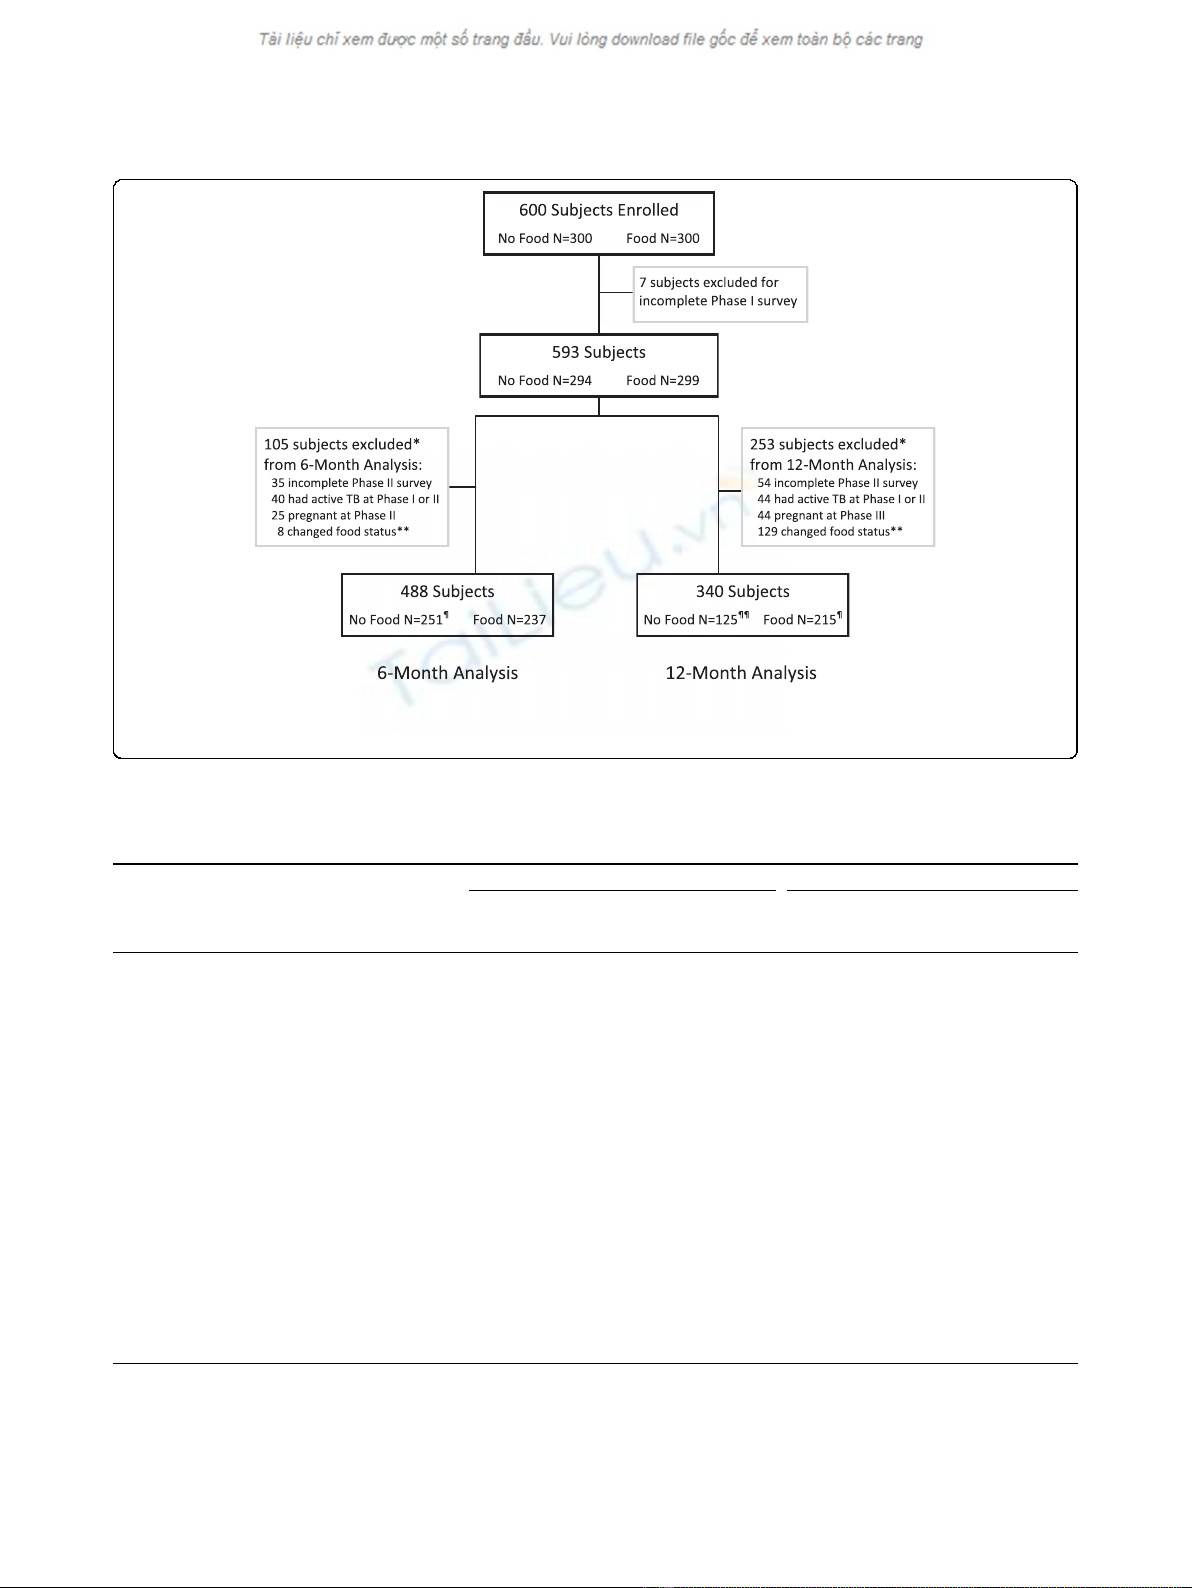
Figure 1 Distribution of subjects with HIV enrolled in observational cohort study in central Haiti. TB = tuberculosis. BMI = body mass
index. * not mutually exclusive. ** all changes in food status were from “No Food”to “Food Assistance”status. ¶ 1 subject did not have BMI
data and was not included in BMI analysis. ¶¶ 3 subjects did not have BMI data and were not included in BMI analysis
Table 1 Baseline characteristics at 6 and 12 months of a cohort of people with HIV in central Haiti
Subjects with 6-month follow-up Subjects with 12-month follow-up
No Food
group
(N = 251)
Food Assistance
group
(N = 237)
P value No Food
group
(N = 125)
Food Assistance
group
(N = 215)
P value
Age, mean yrs (SD) 35 (9) 37 (10) 0.12 36 (10) 37 (10) 0.26
Female, N (%) 149 59.4% 144 60.8% 0.75 74 59.2% 126 58.6% 0.91
Proportion of monthly income spent on food*, N (%) 0.80 0.68
None 22 8.8% 28 11.8% _ 10 8.0% 25 11.6% _
Small amount 13 5.2% 10 4.2% _ 7 5.6% 8 3.7% _
Half 28 11.2% 29 12.2% _ 13 10.4% 27 12.6% _
Most 72 28.7% 65 27.4% _ 38 30.4% 58 27.0% _
All 112 44.6% 101 42.6% _ 55 44.0% 94 43.7% _
ART group, N (%) <0.0001 <0.0001
No ART 106 42.2% 42 17.7% _ 47 37.6% 40 18.6% _
On ART ≥1 yr 134 53.4% 145 61.2% _ 69 55.2% 130 60.5% _
On ART < 1 yr 11 4.4% 50 21.1% _ 9 7.2% 45 20.9% _
Female-headed household*, N (%) 123 49.0% 112 47.3% 0.67 63 50.4% 102 47.4% 0.58
Literate*, N (%) 148 59.0% 127 53.6% 0.25 75 60.0% 119 55.3% 0.43
Number sharing household meals, mean (SD) 6.7 (2.9) 6.1 (2.9) 0.035 6.8 (2.9) 6.3 (2.9) 0.18
Food insecurity score**, mean (SD) 13.9 (3.9) 15.4 (3.9) <0.0001 14.0 (4.1) 15.3 (3.9) 0.003
Body mass index†, mean kg/m
2
(SD) 22.4 (2.7) 20.4 (3.2) <0.0001 22.5 (3.0) 20.2 (3.0) <0.0001
SD = standard deviation
ART = antiretroviral therapy
* sample size varies due to missing survey responses
** range 0 (best food security) to 20 (worst food insecurity
†Body mass index range: ≤18.5 = underweight; 18.5-24.9 = normal; ≥25.0 = overweight
Ivers et al.AIDS Research and Therapy 2010, 7:33
http://www.aidsrestherapy.com/content/7/1/33
Page 4 of 8

6-to-12-month period that coincided with the ‘lean sea-
son’in Haiti. It is possible that individual’s socioeco-
nomic status worsened during this time, prompting the
team to enroll individuals in food assistance based on
these criteria. In addition, as the program timeline pro-
gressed, rations that had not yet been assigned within
the total number of program rations available may have
prompted an informal relaxation of the socioeconomic
criteria for eligibility. Of the 129 individuals that
switched status from ‘no food assistance’to ‘food assis-
tance’, seven had BMI < 18.5 and eight had CD4 count
< 350 cells/mm
3
at the 6-month evaluation; one had TB
and 12 were pregnant at the 12-month survey. When
compared to the 125 individuals that did not change
status from ‘no food’to ‘food assistance’,theyhad
slightly less improvement in food security (-0.10 vs.
-0.20) and slightly worse BMI (-0.72 vs. -0.61) at 6
months, but neither was significant (P = 0.81, P = 0.97).
These individuals were excluded from the final analysis
(Figure 1).
Multivariable analysis
In establishing the multiple regression analysis model we
used existing literature, including the conceptual frame-
work of Egge et al [1,2,8,21] to establish factors of
importance a priori. We also accounted for the baseline
differences between the two groups. The final model
compared the two groups controlling for gender, lit-
eracy, ART group and number of people sharing meals
in the household. At both 6 and 12 months, food assis-
tance was associated with better food security
(P < 0.0001 and P = 0.011), improved BMI (P = 0.020,
P = 0.036), better adherence to monthly clinic visits
(P < 0.0001, P = 0.033) compared to no food assistance.
A sensitivity analysis including all patients with tubercu-
losis did not change the outcome of the study.
Discussion
This study finds that providing food assistance to indivi-
duals with HIV and food insecurity in central Haiti
improves BMI, food security and adherence to clinic
Table 2 6-month and 12-month outcomes among a cohort of people living with HIV in Haiti who did and did not
receive food assistance
6-month outcomes 12-month outcomes
No food
group
(N = 251)
Food
Assistance
group
(N = 237)
Univariate
P value
Multivariable
P value*
No food
group
(N = 125)
Food
Assistance
group
(N = 122)
Univariate
P value
Multivariable
P value*
Change in Food Insecurity
Score, mean (SE)
-0.16 (0.28) -3.55 (0.33) <0.0001 <0.0001 -1.89 (0.47) -3.49 (0.33) 0.011 0.011
Change in body mass index**,
mean (SE)
-0.66 (0.13) -0.20 (0.13) 0.012 0.020 -0.67 (0.22) 0.22 (0.17) 0.002 0.036
Adherence to scheduled
monthly clinic visits, mean
number attended (SE)
2.82 (0.20) 5.49 (0.17) <0.0001 <0.0001 8.34 (0.44) 9.73 (0.32) 0.007 0.033
Change in QOL (role-
functioning), mean (SE)
-5.08 (3.01) -1.90 (2.98) 0.28 0.84 -3.80 (4.03) 3.72 (3.46) 0.13 0.11
Change in QOL (performance-
functioning), mean (SE)
5.31 (1.77) 10.69 (1.99) 0.055 0.009 9.47 (2.67) 8.76 (2.17) 0.48 0.69
Reports problem taking ART
†
,N
(%)
41 28.1% 26 14.4% 0.001 0.001 15 18.8% 18 11.0% 0.068 0.075
Was able to save money in
case of disaster**, N (%)
66 26.5% 45 19.1% 0.63 0.35 41 33.3% 52 24.9% 0.59 0.42
Spent less money on
agriculture to buy food**, N (%)
75 38.1% 57 31.7% 0.58 0.57 37 39.8% 48 25.9% 0.11 0.082
Spent less on education to buy
food**, N (%)
84 36.5% 75 33.9% 0.75 0.63 34 30.6% 68 33.7% 0.28 0.25
Sold livestock to buy food
‡
,N
(%)
43 41.3% 25 24.5% 0.092 0.082 20 38.5% 25 25.0% 0.097 0.11
SE = standard error
ART = antiretroviral therapy
QOL = quality of life
* Controlling for gender, literacy, ART group, number of people sharing meals in the household
** Sample size varied due to missing survey responses
†
Limited to those who were on ART
‡
Limited to those who owned livestock
Ivers et al.AIDS Research and Therapy 2010, 7:33
http://www.aidsrestherapy.com/content/7/1/33
Page 5 of 8