MINISTRY OF EDUCATION AND TRAINING MINISTRY OF DEFENCE 108 INSTITUTE OF CLINICAL MEDICAL AND PHARMACEUTICAL SCIENCE =======***=======
NGUYEN DINH CHUC
RESEARCH ON MYOCARDIAL DEFPRMATION
BY SPECKLE TRACKING ECHOCARDIOGRAPHY IN PATIENTS
WITH CHRONIC KIDNEY DISEASE Spe ciality: Cardiology
Code : 62.72.01.41
ABSTRAC TS O F MEDICAL PHD THESIS HA NO I - 2021
This Thesis was done in
108 Institute of Clinical Me dical and Pharmaceutical Sciences
Supe rvisor:
1. Ass. Prof. PhD. Pham T hai Giang
2. Ass. Prof. PhD. Pham Nguyen Son
Re viewe r:
1. …………………………..
2. ……………………………
3. ……………………………
This thesis will be presented at institute council at institute of clinical
medical and pharmaceutical sciences. Day Month Year
The thesis can be found at:
1. Nat ional Library of Vietnam
2. Library of Institute of Clinical Medical and Pharmaceutical Sciences
3. Central Institute for Medical Sciences Information and T echnology
1
INTRO DUCTIO N
Chronic kidney disease (CKD) is a disease with many
complications involving many different organ systems, depending on
the stage of chronic kidney disease, the complications encountered can
vary in number as well as level severity of the disease. Anemia, bone
and mineral metabolism disorders, peripheral vascular disease,
neurological disease, mental disorders, especially cardiovascular
complications are common complications in patients with CKD. In the
world, there are many authors using speckle tracking
echocardiography to assess heart function in patients with
hypertension, diabetes and other diseases and are used in patients.
Chronic kidney disease with and without dialysis, of particular
significance in patients with normal left ventricular ejection fraction.
In Vietnam, there are no works using speckle tracking
echocardiography in patients with chronic kidney disease. From the
above reasons, we carried out the project "Research on Myocardial
deformation by spe ckle tracking e chocardiography in patients
with chronic kidney disease" with two objects:
1- Survey on the clinical, subclinical and myocardial
deformation in chronic kidney patients with a normal left ventricular
ejection fraction.
2- Investigate the relationship between the parameters of
speckle tracking echocardiographic with some clinical and subclinical
features in patients with chronic kidney disease with a normal left
ventricular ejection fraction.
2
TH E N EW CONTRIBU TIO NS O F TH E TH ESIS
function along longitudinal, the
This is the first study in Vietnam with a large number of study subject s, using speckle t racking echocardiography to evaluate in detail left ventricular radial and circumference direction as well as left ventricular rotation, twist, and untwist in chronic kidney disease with normal left ventricular ejection fraction.
Myocardial deformation: GLS decreased 37.9%, MSP decreased: 16.3%, GLSRe decreased: 13.7%, MDP decreased: 11.1%. The rotation and twist of left ventricular increased more than the control group without any difference. The systolic and diastolic parameters decrease with the grade of disease, positively correlated with the GFR. CKD with increased blood pressure, diabetes with decreased deformation index, the rate of impaired systolic function, diastolic increased more in the group of chronic kidney disease without diabetes, increased blood pressure. CKD with left ventricular hypertrophy: Myocardial deformation index decreases, the rate of systolic and diastolic dysfunct ion increases. Multivariable analysise: Hypertension is an independent predictor of decreased systolic and diastolic function in the stages of CKD.
Research results show that in chronic kidney patients with a normal left ventricular ejection fraction, there is a decrease in both systolic and diastolic function. Although the rate of reduction is not high, it is an early change. This is the meaningful contribution of the topic to the major.
TH E LAYO UT O F TH E TH ESIS
The thesis with 136 pages including: Introduction (2 pages),
literature review (34 pages), material and methods (27 pages), results
(36 pages), discussion (34 pages), conclusion (2 pages), request (1
3
page). T he thesis has 41 tables, 8 charts, 12 pictures, 3 diagrams.
Using 174 references including 20 documents in Vietnamese, 154
documents in English.
Chapte r 1
LITERA TUR E R EVIEW
1.1. Chronic kidney disease
1.1.1. Conce pts and te rminology
Chronic Kidney Disease (CKD): In 2002, the American
Nat ional Nephrology Association and the Kidney Disease
Consequence Assessment Council (NKF / KDOQI) released the first
practical guidance on chronic kidney disease. By 2012, the
International Nephrology Associat ion (ISN) issued guidance from the
Global Kidney Disease Consequence Improvement Group (KDIGO)
that complements the 2002 Renal Disease Practice Guidelines. is
defined as having one of the following 2 standards:
(1) Renal damage lasting for ≥ 3 months leads to changes in
kidney structure and function. These disorders may or may not reduce
glomerular filtration rate (GFR), manifest in histopathological lesions,
changes in blood chemistry, urine or renal morphology through
diagnostic imaging.
(2) Glomerular Filtration Rate (GFR) decreased by <60 ml / min / 1.73 m2 continuously for more than 3 months, with or without accompanying renal structural damage.
Chronic Renal Failure (CRF): A condition of chronic
irreversible impairment of kidney function, over a period of months
and years, due to irreversible damage to the number and function of
4
nephrons. Chronic renal failure is defined as GFR <60 ml / min lasting
3 months or more.
End Stage Renal Disease (ESRD): is defined as an irreversible
impairment of kidney function, severe enough to cause death in the
absence of dialysis or a kidney t ransplant. End-stage chronic kidney
disease corresponding to stage 5 chronic kidney disease as classified
by NKF / KDOQI 2002, patients with glomerular filtration rate <15 ml / min / 1.73m2, or people in need of kidney replacement therapy regardless of glomerular filtration rate.
1.1.2. Stages of chronic kidney díease
Table 1.1. Stages of chronic kidney disease (According to NFK-
KDOQI 2002)
Stage
Description
GFR (ml / min / 1,73m2)
Kidney damage with normal or GFR
≥ 90
1
Kidney damage with mild GFR
60 - 90
2
3 Moderate GFR
30 - 59
Severe GFR
15 - 29
4
Kidney Failure
<15 or dialysis
5
1.2. Spe ckle tracking echocardiography
Strain: Strain represents a measure that evaluates the degree of
deformation of the analyzed segment in relation to its initial
dimensions. It is expressed as a percentage. The strain equation (ε) is as follows: ε = (L - L0)/L0, where L is the length of the object after deformation, and L0 is the basal length of the object. By convention, depending on the direction, a lengthening or thickening deformation is
given a positive value, whereas a shortening or thinning deformation
is given a negative one.
5
Strain Rate : The strain rate (ε’) represents the myocardial deformation rate. It is expressed as s-1; in other words, if the same strain value is reached in half the time, the strain rate value will be
doubled. Experimental studies have shown t hat the strain rate is less
dependent on LV load variations than strain. However, because the
strain rate signal is noisier and less reproducible, most clinical studies
still use strain measurements.
Longitudinal Strain: represents myocardial deformation
directed from the base to the apex. During systole, ventricular
myocardial fibers shorten with a translational movement from the base
to the apex; the consequent reduction of the distance between single
kernels is represented by negative t rend curves. Through longitudinal
strain analyses in 4-chamber, 2-chamber, and apical long-axis views,
both regional and global strain values (global longitudinal strain) can
be obtained. Global longitudinal strain recently has been validated as a
quantitative index for global LV function.
Radial Strain: represents radially directed myocardial
deformation, ie, toward the center of the LV cavity, and thus indicat es
the LV thickening and thinning motion during the cardiac cycle.
Consequently, during systole, given the progressive radial propulsion
of single kernels, radial strain values are represented by positive
curves. Radial strain values are obtained by speckle-tracking
echocardiographic analysis of both basal and apical LV short-axis
views.
Circumferential Strain: represents LV myocardial fiber
shortening along the circular perimeter observed on a short-axis view.
Consequently, during systole, for circumferential speckle-to-speckle
reduction, circumferential strain measurements are
distance
6
represented by negative curves. As for longitudinal strain, it is
possible to obtain a global circumferential strain value.
Twisting and Torsion: Until recently, the evaluation of LV
twisting has been possible only through MRI, but currently, speckle-
tracking echocardiography has emerged as a new promising tool for
LV twisting analysis. Left ventricular twisting is a component of the
normal LV systolic contraction that arises from the reciprocal rotation
of the LV apex and base during systole and constitutes an important
aspect of cardiac biomechanics. Intrinsic to its physiologic
characteristics, the quantification of LV twisting by speckle-tracking
echocardiography is made possible by analyzing the reciprocal
rotation of the LV apex and base during systole. Left ventricular
twisting is then calculated as the net difference in mean rotation
between the apical and basal levels. Left ventricular torsion is defined
as LV t wisting normalized with the base-to-apex distance.
Untwisting: Growing attention has been also recently given to
the role of untwisting in diastolic LV filling mechanics. Untwisting
velocity is thought to be a critical initial manifestation of active
relaxation, which makes this measurement relevant for investigating
diastole and, mainly, isovolumic relaxation because it seems to be less
dependent on load compared to other diastolic parameters.
7
Charte r 2 MATERIAL AND METHO DS
2.1. Study population
Study on 300 subject s, divided into 2 groups:
- CKD group: Including 190 patients diagnosed with chronic
kidney disease from stage 1 to stage 5, without dialysis.
- Control group: Including 110 normal people.
2.1.1. The inclusion crite ria
* CKD group
- CKD with stage 1 to 5 without dialysis.
- Age ≥ 18 years.
- Causes of chronic kidney disease: chronic glomenulonephritis,
chronic pylonephritis, hypertension, diabetes millitus, primary kidney
disease.
- Patient was first diagnosed or diagnosed with CKD.
- A left ventricular ejection fraction EF ≥ 50%
- Agree to participate in research
* Control group
- People who come for medical examination at the Hospital.
- Including both men and women.
- Age from 18 and over and age equivalent to the group of diseases.
- No history of cardiovascular disease.
- History and current no kidney disease
- Conventional Echocardiography, normal electrocardiogram.
- Subject s to cooperate, voluntarily participate in research
2.1.2. The exclusion crite ria
* CKD group
- Patients with cardiovascular disease before kidney disease
8
- Suffering from acute diseases such as pneumonia, viral
infection
during the study period. Severe chronic kidney disease requires
emergency treatment.
- Suspect ed of having a surgical condition at the time of research
- Patients with malignancies accompanied by kidney disease
- Have a cognitive or psychiatric disorder.
- No research cooperation.
- T he quality of conventional echocardiography is not guaranteed
* Control group
- Have had treatment for cardiovascular disease
- Have kidney disease, cardiovascular disease, diabetes mellitus,
hypertension, pulmonary disease
- People who are pregnant or have had a baby within the previous 6 months
- Have a cognitive or psychiatric disorder
- Refuse to participate in the study
- T he quality of conventional echocardiography is not guaranteed
2.2. Methods
2.2.1.Me thod: Descriptive cross-sectional study, comparing disease-
control groups with analysis.
2.2.2. Sample size: n = 138
2.2.3. Time and place:
- T ime: From January 2015 to November 2018.
- Location: At Phu Tho Provincial General Hospital.
2.2.4. Ste ps to study
2.2.2.1. The control
9
* Ask medical history: history of kidney disease, urinary disease,
hypertension, gastroduodenal disease ... History of blood loss, trauma,
surgery ... History of blood donation, blood transfusion.
* Clinical examination: Whole body: edema, skin and mucosa,
measuring blood pressure, heart rate, height, weight, determine BMI
of the subject . See the specialists.
* The laboratory tests
2.2.2.2. CKD group
* Questioning: Exploiting a history of some diseases such as urinary
kidney disease, blood disease and other chronic diseases (chronic
hepatitis, tuberculosis, chronic heart disease ...). History of alcohol,
tobacco, and drug addiction. History of chronic kidney disease
conservation therapy, anemia treatment, iron supplementation
* Examination: Subject s are comprehensively examined by doctors
including: Perception, height, weight determine the patient's BMI.
Symptoms: edema, anemia, ... Pay special attention to some
manifestations such as: acute infections, skin diseases, digestive
organs, cardiovascular system, respiratory system, thyroid, peripheral
lymph nodes , spleen ... Signs or symptoms of acute blood loss such as
black stools, vomiting blood, coughing up blood, nosebleeds,
bleeding, hematuria ... Blood pressure measurement, status
determination patient's blood pressure
* Do subclinical t ests
2.2.5. Echocardiography
* Timing of echocardiography: The patients are done in t he first 2
days of hospital admission. The control group received ultrasound
after being selected for the study.
10
* Echocardiography e quipment: GE's Vivid E9 ultrasound system
(General Electric), manufactured in 2013, with probe M4S (frequency:
1,5 - 4, 0 MHz). Software EchoPAC version 113 of GE.
* Spe ckle tracking echocardiography
for
Image Acquisition Images are obtained and recorded by using conventional 2- dimensional gray scale echocardiography during breath holding with stable electrocardiographic t racing. Care must be taken to obtain t rue apical and short-axis images using standard anatomic landmarks in each view and to avoid foreshortening of the analyzed myocardial structure, thus allowing a more reliable delineation of the endocardial border. T he optimal frame rate for the 2-dimensional image acquisition is set between 40 - 90 frames per second. It is to begin with speckle-tracking echocardiographic recommended analysis of an apical long-axis chamber view to select the frame corresponding to the aortic valve closure, which is a useful reference for the subsequent analysis. Apical 4- and 2- chamber view acquisitions are necessary longitudinal strain. Short-axis recordings, useful for radial strain, circumferential strain, and rotation analysis, T o standardize acquisitions, the basal plane is identified as the plane including the tips of the mitral leaflets, whereas the apical plane is identified distally to the papillary muscles as the plane just proximal to the level at which LV cavity end-systolic obliteration occurs. Particular attention should be paid to making the LV cross section as circular as possible.
Calculate deformation parameters Dat a are extracted to Excel 2010 to calculate:
Longitudinal strain and strain rate : Global left ventricular systolic longitudinal strain (GLS) is the mean value of the longitudinal
11
strain of 17 segments in all 3 views from the apex (3 chambers, 4 chambers, 2 chambers), are calculated automatically according to the bull's eye map and have negative values, the unit of measure is (%). The Global left ventricular longitudinal early diastolic strain rate (GLSRe), the Global left ventricular longitudinal late diastolic strain rate (GLSRa) is t he mean value of the corresponding strain rate of the myocardial segment (18 segments) in all 3 views from the tip (3 chambers, 4 chambers, 2 chambers). GLSRe, GLSRa are positive, the unit of measure is (s-1). Circumference strain and strain rate : The Global Left ventricular systolic circumferencial strain (GCS), the Global left ventricular early diastolic circumferencial strain rate (GCSRe), the Global left ventricular late diastolic circumferencial strain (GCSRa) is the mean value of strain and strain rate of the 6 myocardial segments at the short axis cross sect ion in the papillary muscle. The GCS index is negative, the unit of measure is (%), the GCSRe, GCSRa index is positive, and the unit of measure is (s-1). Radial strain and strain rate : The Global left ventricular systolic radial strain (GRS), the Global left ventricular early diastolic radial strain rate (GRSRe), the Global left ventricular late diastolic radial strain rate (GRSRa) is t he mean value of the strain and the strain rate of the 6 myocardial segments in the short axis views in the papillary muscle. T he GRS index is positive, the unit of measure is (%), the GRSRe, GRSRa is negative, and the unit of measure is (s-1). Myocardial function pe rformance: - Myocardial systolic performance (MSP): MSP = GRS - ( GLR + GCS) / 3, positive value, calculation unit is (%). - Myocardial systolic performance (MDP): MDP = (GLSRe + GCSRe) - GRSRe / 3, positive values, unit (s-1).
12
Rotation and Twist: Measured at the short-axis views - Apical rotation (Apical - R): Is counter-clockwise maximum systolic rotation at the apex on the short axis views when viewed from the apex. According to the anti-clockwise crown of the heart the rotation convention has a positive value, the unit of measure is (o). - Basal rotation (Basal - R): is the maximum clockwise systolic rotation of t he base of t he heart on t he short axis views when viewed from the t ip of the heart According to the convention that the base of the heart rotates clockwise. negative value, unit of measure is (o) - Left ventricular twisting (LV Twist): Left ventricular twist = Peak systolic maximum rotation angle - the bottom maximum systolic rotation angle, positive values, unit of measurement is (o). - Time to peak of twist (TTP - T): is the time period from the starting Q wave on the ECG to the maximum systolic twisting on the left ventricular twisting curve. (Measured from Q wave origin to left ventricular maximum twisting), in (ms). - LV Torsion (LV tor): A normalized left ventricular twist along the end diastolic left ventricle length from the center of t he plane across the mitral valve ring to the farthest endocardial layer at the apex of the left ventricle. Left ventricular torsion = (Maximum systolic rotation at the apex - maximum base systolic rotation) / length of the end diastolic left ventricle, unit of measurement (o / cm). - Untwisting rate (URT): Left ventricular maximum untwisting rate is the first negative wave after closing the aortic valve on t he diastolic twisting curve. The left ventricular Untwisting rate = Maximum rotation rate at the apex - maximum rotation rate at the base, diastolic, negative values, in units (o / s). - Time to peak untwisting (TTPU): T he time to peak untwisting speed is measured by t he time from the origin of the R wave on the ECG t o
13
left ventricular peak untwisting rate on the diastolic twisting velocity curve, is measured in (ms). 2.2.6. Statistical analysis: Using SPSS 20.0 software
Charte r 3. RERULTS
3.1. Baseline characteristics
The control with 110 subject s, 59 males (53,6%), 51 females
(46,4%), and was 50,7 ± 12,45. The CKD: 190 patients with CKD
without dialysis, 112 males (58,9%), 78 females (41,1%), average age:
51,2 ± 13,29. There was no age difference between the control and the
CKD group.
3.2. Clinical, subclinical signes and myocardial de formation in
patients with CKD with a normal eje ction fraction.
3.2.1. Clinical and subclinical signes: GFR: 21,02 ml / min. Diabetes
mellitus: 23,7%, hypertension: 55,3%, anemia: 87,4%, dyslipidemia:
67,4%, increase NT-proBNP is 61,6%. LVH: 65,8%, LV diastolic
dysfunct ion 62,6%, pulmonary hypertension 43,7%.
3.2.2. The myocardial de rformation
Table 3.13. Strain for LV systolic function in CKD and controls
Index
Control (n=110)
CKD (n=190)
p
-21,3 -(22,52-18,77)
-17,25 -(20,92-14,1)
< 0,001
GLS (%)
-18,22 -(21,35-15,57)
-16,35 -(19,58-13,54)
< 0,001
GCS (%)
46,06 (35,72 – 58,25)
36,59 (28,07 – 49,98)
< 0,001
GRS (%)
29,21 ± 6,53
24,58 ± 7,22
< 0,001
-5,41 -(8,25-3,78)
-6,88 -(9,83-4,47)
< 0,05
7,3 (4,93 – 10,48)
8,08 (4,93 – 11,9)
> 0,05
14,28 ± 5,03
15,93 ± 6,41
< 0,05
MSP (%) Basal - R (o) Apical - R (o) LV T wist (o)
344 (313 – 360)
329 (298 – 361)
> 0,05
TTP - T (ms) LV -Tor (o/cm)
1,84 (1,44 – 2,42)
2,06 (1,58 – 2,51)
< 0,05
14
Comment: T he average value of left ventricular systolic function
Strain in the CKD is mostly different from the control.
Table 3.15. Strain rate for LV diastolic function in CKD and control
Control (n=110)
CKD (n=190)
p
1,75 ± 0,43
1,43 ± 0,52
< 0,001
1,17 (0,93 – 1,49)
1,21 (0,92 – 1,61)
> 0,05
1,77 ± 0,4
1,61 ± 0,48
< 0,01
0,96 (0,67 – 1,3)
1,01 (0,71 – 1,41)
> 0,05
-3,1 -(3,84-2,24)
-2,36 -(3,3-1,78)
< 0,001
-1,93 -(3-1,39)
-2,06 -(2,85-1,39)
> 0,05
2,22 ± 0,52
1,88 ± 0,62
< 0,001
Index GLSR - e (s-1) GLSR - a (s-1) GCSR - e (s-1) GCSR - a (s-1) GRSR - e (s-1) GRSR - a (s-1) MDP (s-1) UTR (o/s)
-108,18 -(134,8-83,67)
-110,08 -(145,64-79,56)
> 0,05
TTPU (ms)
407 (369,25 – 438)
423 (391,75 – 454)
< 0,01
Comment:
- Most of the strain rate of LV diastolic function in CKD were
different from the control.
- T he time to peak untwisting GLSR - e, GCSR - e, GRSR - e, and
MDP in the CKD group were significantly lower than the control
group, p <0.01. In contrast, the TTPU index of the CKD group was
significantly higher than the control group, p <0.01.
15
3.3. The relationship be tween the myocardial de formation with
clinical, subclinical characte ristics of CKD with EF ≥ 50 %
3.3.1. Relationship be tween the myocardial de formation with
some clinical features
Table 3.19. LV Strain according to stage of CKD
Index
p ANOVA
Mean
< 0,001
GLS (%)
Reduce (n,%)
< 0,001
Mean
> 0,05
GCS (%)
Reduce (n,%)
> 0,05
Mean
< 0,05
GRS (%)
G rade 3 (n=39) -17,8 –(21- 14) 14 (35,9) -17,07 - (20,1-14) 5 (12,8) 36,26 (29,4- 44) 3 (7,7)
G rade 4 (n=46) -17,15 -(19,8- 14) 20 (43,5) -16,57 -(19,4- 12) 9 (19,6) 34,49 (28,8-50) 6 (13)
24,79 ± 7,14 24,56 ± 8,13
MSP (%)
Reduce (n,%) Mean Reduce (n,%)
< 0,05 < 0,01 < 0,05
Mean
> 0,05
Basal - R (o)
Reduce (n,%)
G rade 1+2(n=37) -21,3 – (22,55-18) 2 (5,4) -18,34 – (20,4-14) 1 (2,7) 45,17 (34,3-53) 1 (2,7) 27,72 ± 5,36 0 (0) -7,05 – (9,7-4,55) 3 (8,1)
6 (15,4) -6,19 – (9,1-4,47) 4 (10,3)
> 0,05
Mean
> 0,05
8,25 (5,58 - 12,85)
7,56 (5,67 – 11,5)
Apica l - R (o)
LVTwist (o)
Reduce (n,%) Mean Reduce (n,%)
> 0,05 > 0,05 > 0,05
Mean
> 0,05
TTP - T (m s)
Reduce (n,%)
> 0,05
Mean
> 0,05
LV-Tor (o/cm)
Reduce (n,%)
1 (2,7) 16,61 ± 6,85 5 (13,5) 345 (313,5 – 376) 0 (0) 2,06 (1,61 – 2,72) 5 (13,5)
4 (10,3) 16,46 ± 7,68 6 (15,4) 329 (298 – 376) 2 (5,1) 2,12 (1,56 – 2,67) 3 (7,7)
8 (17,4) -7,99 –(10,4- 5,0) 7 (15,2) 8,08 (4,21 – 11,94) 4 (8,7) 16,62 ± 5,7 5 (10,9) 344,5 (29 –361) 0 (0) 2,1 (1,68 – 2,75) 6 (13)
G rade 5 (n=68) -15,45 - (18,87-11) 36 (52,9) -15,58 – (18,8-11) 15 (22,1) 34,28 (23,6- 45,82) 14 (20,6) 22,75 ± 7,02 17 (25) -6,53 – (9,07-4,03) 8 (11,8) 7,39 (4,68 – 11,98) 3 (4,4) 14,8 ± 5,79 4 (5,9) 329 (297 – 359) 1 (1,5) 1,9 (1,49 – 2,47) 2 (2,9)
> 0,05
Comment: There is a significant relation between left
ventricular systolic indexes on speckle tracking echocardiography and
stage of the CKD.
16
Table 3.20. LV Strain rate according to stage of CKD
Index
Grade 1+2(n=37) 1,6 ± 0,58
Grade 3 (n=39) 1,42 ± 0,53
Grade 4 (n=46) 1,33 ± 0,53
Grade 5 (n=68) 1,41 ± 0,46
p ANOVA > 0,05
Mean
GLSR - e (s-1)
4 (10,8)
6 (15,4)
9 (19,6)
7 (10,3)
> 0,05
Reduce (n,%)
1,13
1,39
1,29
1,08
> 0,05
Mean
(1,01 – 1,61)
(1,07 – 1,68)
(0,91 – 1,64)
(0,84 – 1,46)
GLSR - a (s-1)
2 (5,4)
2 (5,1)
1 (2,2)
4 (5,9)
> 0,05
Reduce (n,%)
1,66 ± 0,34
1,66 ± 0,51
1,65 ± 0,53
1,53 ± 0,49
> 0,05
Mean
GCSR - e (s-1)
1 (2,7)
2 (5,1)
8 (17,4)
8 (11,8)
> 0,05
Reduce (n,%)
< 0,05
Mean
1,19(0,78 – 1,39)
1,13 (0,83 – 1,63)
0,94(0,57 – 1,33)
0,9(0,64 – 1,35)
GCSR - a (s-1)
1 (2,7)
3 (7,7)
1 (2,2)
1 (1,5)
> 0,05
Reduce (n,%)
> 0,05
Mean
-2,94 – (4,05-1,9)
-2,64 – (3,3-1,78)
-2,33– (3,27-1,77)
-2,22 – (2,93-1,74)
GRSR - e (s-1)
3 (8,1)
6 (15,4)
6 (13)
10 (14,7)
> 0,05
Reduce (n,%)
> 0,05
Mean
-1,83– (2,96-1,38)
-2,18– (2,79-1,6)
-2,3– (3,06-1,46)
-1,73 – (2,56-1,29)
GRSR - a (s-1)
1 (2,7)
1 (2,6)
2 (4,3)
1 (1,5)
> 0,05
Reduce (n,%)
2,1 ± 0,61
1,93 ± 0,75
1,82 ± 0,62
1,76 ± 0,51
< 0,05
Mean
MDP (s- 1)
3 (8,1)
4 (10,3)
7 (10,3)
> 0,05
7 (15,2)
Reduce (n,%)
> 0,05
Mean
UTR (o/s)
-110,47 - (162,4- 80,39)
-125,78- (155,69- 90,7)
-107,14 – (141,76- 76,8)
-103,31 - (151,17- 71,0)
2 (5,4)
3 (7,7)
3 (4,4)
> 0,05
4 (8,7)
Reduce (n,%)
> 0,05
Mean
423 (392 – 454,5)
423 (376 – 454)
415,5 (392 – 454)
423 (376- 454,25)
TTPU (m s)
2 (5,4)
1 (2,6)
4 (5,9)
> 0,05
1 (2,2)
Reduce (n,%)
Comment: T here are no significant relationship between strain
rate with stages of CKD
17
3.3.2. Relationship be tween Strain and strain rate with some
subclinical characte ristics
50
40
MSP = 0,26*EF + 9,622
)
%
30 20
( P S M
10
0
0.00
0.20
0.40
0.60
0.80
1.00
EF%
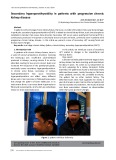
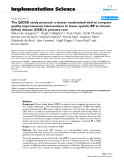
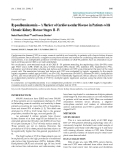
Figure 3.5. Correlation be tween MSP and EF in patients with CKD (n = 190)
Comment: MSP left ventricular systolic function on
speckle tracking echocardiography correlated positively with EF%,
correlation coefficient r = 0.223, p <0.01
MSP = 30,556 – 0,043*LVMI
)
%
( P S M
50 40 30 20 10 0
0
100
200
300
400
500
600
LVMI (g/m2)
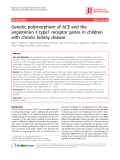
Figure 3.7. Correlation be tween MSP and LVMI in patients with CKD (n = 190)
18
Comment: Left ventricular systolic (MSP) function on speckle inversely correlated with LVMI, is
tracking echocardiography correlation coefficient r = -0,359, p <0.001.
Table 3.39. Logistic re gression of MSP re duction risk factors
Factors
Odds ratio (OR)
CI 95%
p
0,959
Age
0,925 – 0,994
< 0,05
0,967
GFR
0,939 – 0,995
< 0,05
2,896
Hypertension
1,086 – 7,720
< 0,05
1,355
E/e'(mean)> 13
0,478 – 3,843
> 0,05
1,953
e’ (septum) < 8
0,693 – 5,505
> 0,05
3,125
Hypertension pulmonary artery
1,236 – 7,903
< 0,05
Comment: Age, GFR, hypertension, Hypertension pulmonary artery
are independent risk factors for decreased MSP
Table 3.40. Logistic re gression of MDP re duction risk factors
Factors
Odds ratio (OR)
CI 95%
p
Hypertension
1,706
0,702 – 4,144
> 0,05
e' (septum) < 8
2,142
0,837 – 5,482
> 0,05
Age > 60
0,731
0,3 – 1,78
> 0,05
BMI > 23
0,453
0,144 – 1,426
> 0,05
Left atral dilatation
2,763
1,222 – 6,247
< 0,05
Comment: Left atrial dilatation is an independent risk factor for
decreased MDP.
Table 3.41. Logistic regression of MSP and MDP reduction risk factors
19
Factors
Odds ratio (OR)
CI 95%
p
Age
0,980
0,930 – 1,032
> 0,05
GFR
0,983
0,949 – 1,018
> 0,05
Hypertension
9,600
1,356 – 67,948
< 0,05
Primary kidney disease
4,227
0,849 – 21,038
> 0,05
e' (Septum) < 8
0,648
0,444 – 0,944
< 0,05
Comment: Hypertension, e’(Septum) < 8 is an independent risk factor
for decreased both MSP and MDP
Chapte r 4. DISCUSSIO N
4.1. Gene ral characte ristics of Study population:
The control: 110 subjects, of which 59 men (53,6%), 51 women (46,4%), the average age was 50,7 ± 12.45. The CKD: 190 patients with CKD without dialysis of which 112 males (58,9%) and 78 females (41,1%), average age: 51,2 ± 13.29.
4.2. Clinical, subclinical and myocardial deformation fe atures by spe ckle tracking echocardiography in patients with C KD with a normal e jection fraction. 4.2.1. Clinical and subclinical features:
GFR was 21,02 ml / min. Diabetes: 23,7%, hypertension: 55.3%, anemia: 87,4%, dyslipidemia: 67,4%, increase NT-proBNP is 61,6%. LVMI: 65,8%, LV diastolic dysfunction: 62,6%, hypertension pulmonary artery 43,7%.
4.2.2. Characte ristics of spe ckle tracking e chocardiography 4.2.2.1. Characte ristics of systolic function assessment
Characteristics of deformation indexes: Using the control group indicators with lower quartile values for comparison, we found that the deformation indexes decreased as follows: the number of patients
20
with GLS decreased 37, 9%, GCS decreased, accounting for 15,8%, GRS decreased by 12,6%, while the number of patients with bottom rotation increased only 11,6%, and only 6,3%. On the torsion indexes, the number of patients with left ventricular torsion increased by 10,5%, left ventricular torsion time increased only in 3,7% of patients, standardized left ventricular torsion increased in 8,4% of patients. Especially, there are 16,3% of patients with reduced left ventricular systolic function. When comparing our results with other studies, we find that there are certain similarities.
4.2.2.2. Characte ristics of diastolic function assessment
late circumference and 2,6% patients increased
Characteristics of deformation rate index: We use the control quart ile to determine the rate of patients with myocardial deformation on tissue marker ultrasound in patients with CKD, the results show: 13, 7% of patients had a decrease in early longitudinal deformation, 10,0% of patients decreased early peripheral deformation and 13,2% of patients decreased early lateral deformation. While only 4,7% of patients increased late longitudinal deformation, 2,6% of patients increased late horizontal deformation. With torsion, only 6,3% of patients increased left ventricular torsion removal speed and 4,2% of patients increased left ventricular torsion removal time. Especially, there are 11,1% of patients with reduced left ventricular diastolic function compared to the control group 4.3. The relationship between the myocardial deformation with clinical, subclinical characteristics of CKD with a normal eje ction fraction
4.3.1. Associate d with diabetes
The group of diabetic patients with reduced systolic and diastolic deformation evaluation indexes compared with the group of patients without diabetes had statistical significance, p <0,05. T hus, the influence of diabetes on the deformation of myocardium and
21
myocardial rotation is clearly shown in this study. Related to the pathophysiology of cardiovascular complications in diabetic patients include many factors: hyperglycemia, increased insulin resistance, dyslipidemia, increased blood clotting, obesity and hypertension.
4.3.2. Associate d with the stage of chronic kidne y disease
- Relation to the stage of chronic kidney disease: In this study, only 2 patients were diagnosed with stage 1 CKD, so we included and considered the relationship between the systolic and left ventricular diastole. on tissue marker ultrasound with 4 groups, with a relatively similar number of patients. We found that, the indicators for evaluating the deformity and assessing the systolic function showed that MSP fruit decreased gradually with the severity of the stage of chronic kidney disease, p <0,05 to <0,001.
- Relationship with anemia: One interesting finding we had was that there was an association between anemia, left ventricular systolic strain, and left ventricular systolic function. The group of patients with CKD anemia had these indicators lower than the group of patients without anemia with statistical significance, p <0.01. The anemia group decreased the above indicators from 3,699 to 5,074 times compared with the group without anemia, p <0.01. However, with the left ventricular diastolic indexes, we only saw a difference in the MDP index evaluating diastolic function, the anemic patient group had significantly lower MDP than the no anemia group, p <0.01, and especially in the anemia group up to 12.7% (all patients) had a decrease in left ventricular diastolic function, while the no-anemic group had no patients.
4.3.3. Associate d with cardiovascular manifestations in patients with CKD
22
- Associat ed with hypertension: We found an association of several deformation indices and MSP with hypertension. The group of patients with CKD with hypertension had these ratios lower than those without hypertension, p <0.05. However, no relation was found with the torsional indexes. With diastolic function, there was also a correlation between high blood pressure and strain rate as well as MDP and the hypertensive group had these indexes significantly lower than the non-hypertensive group, p <0.05. In particular, the group of patients with CKD with hypertension had a significantly higher rate of both left ventricular dysfunction, both systolic and diastolic, than the non-hypertensive patients with CKD, p <0.05.
- Related to the concentration of NT-proBNP: Our study results show that left ventricular strain and strain rate on speckle tracking echocardiography have a positive correlation with the concentration of NT-proBNP. On the contracst, the twist and rotation have an inverse correlation, p <0.05.
that, the systolic and systolic functional indicators
- Related to indicators of convention echocardiography: EF, LVMI and pulmonary hypertension artery: The results of our study show left ventricular diastole on speckle tracking echocardioagraphy correlated with EF%, LVMI and pulmonary hypertension. p <0.01.
CONCLUSIO N
23
1. Clinical, subclinical and myocardial de formation features in
CKD with a normal le ft ventricular e je ction fraction.
- Clinical and subclinical features: GFR was 21,02 ml / min. T he
diabetes: 23,7%, hypertension: 55,3%, anemia 87,4%, dyslipidemia
67,4%, increase NT-proBNP is 61,6%. LVH: 65,8%, LV diastolic
dysfunction 62,6%, hypertension pulmonary artery: 43,7%.
- Myocardial deformation: Strain and strain rate in CKD
decreased significantly compared to the control group, p <0,05 to
0,001. Among the indicators assessing left ventricular systolic
myocardial deformation, GLS decreased the most by 37,9%, MSP:
16,3%. Among the indicators assessing left ventricular diastolic
myocardial deformation, the highest proportion was 13,7% of GLSR -
e, with 11,1% of MDP.
- Rotation and T wist: In CKD tended to be higher than the
control group, but there was no statistically significant difference.
2. Relationship be tween Strain and strain rate with some clinical
and subclinical features CKD with a normal le ft ventricular
e jection fraction
- Related to the stage of CKD: The index evaluating the LV
systolic and diastolic myocardial deformation gradually decreases
with t he severity of CKD, t he more severe CKD have t he rate of left
ventricular dysfunction. the higher the p <0.01. There is a significant
positive correlation between GFR and Systolic and diastolic
myocardial deformation, p <0.01. At cut off = 26.24 ml / min, GFR
predictive value of left ventricular dysfunction, p <0.01.
- Related to diabetes and hypertension: Diabetic patients;
Hypertension has decreased evaluation index of myocardial
deformation, the left ventricular systolic and diastolic dysfunction is
24
higher than the group of patients with CKD without diabetes; T HA is
significant, p <0.01.
- Related with some indicators of echocardiography convention:
CKD with diabetes; hypertension pulmonary artery; Increased NT -
proBNP with indicators evaluating reduced deformity, the rate of left
ventricular systolic and diastolic dysfunction is significantly higher
than in patients with CKD without these characteristics, p <0.01.
- Multivariate analysis: Hypertension is an independent predictor
of reduced left ventricular systolic and diastolic function in patients
with stage 1 to 5 CKD who have not undergone dialysis, p <0.05.
REQ UES T
Based on the research results obtained and the limitations that
this topic has not implemented yet, we have the following
recommendations:
1. Chronic kidney disease should apply speckle tracking
echocardiography to evaluate left ventricular function in order to
detect early changes in left ventricular function, even when normal left
ventricular ejection fraction
2. It is necessary to continue to study the variation of left
ventricular function by using speckle tracking echocardiography in
some stages of chronic kidney disease with a larger number of
patients, especially the group of patients with severe stage with
uremia.
SCIENTIFIC RES EARCH WORKS
PUBLISHED RELATED TO THE TH ESIS
1. Nguyen Dinh Chuc, Phạm Nguyen Sơn, Phạm T hai Giang,
Nguyen Thi T hu Hoai (2020), “ Survey on some indicators for
assessement of left ventricle systolic and diastolic function by
speckle tracking echocardiography in patients with chronic
kidney disease”, Journal of clinical medicine and pharmacy
108, 15(7), pp. 47-53.
2. Nguyen Dinh Chuc, Phạm Nguyen Sơn, Phạm T hai Giang,
Nguyen T hi Thu Hoai (2020), “ Relationship between some
indicators for assessement of left ventricle systolic and
diastolic function by speckle tracking echocardiography in
patients with chronic kidney disease”, Journal of clinical
medicine and pharmacy 108, 15(7), pp. 63-69.