* Corresponding author. Tel. : +989123950902
E-mail address: saeedifarshad1@gmail.com (F. Saeedi)
© 2019 by the authors; licensee Growing Science, Canada.
doi: 10.5267/j.dsl.2018.5.003
Decision Science Letters 8 (2019) 45–64
Contents lists available at GrowingScience
Decision Science Letters
homepage: www.GrowingScience.com/dsl
Redesigning fruit and vegetable distribution network in Tehran using a city logistics model
Farshad Saeedia*, Ebrahim Teimourya and Ahmad Makuia
aDepartment of Industrial Engineering, Iran University of Science and Technology
C H R O N I C L E A B S T R A C T
Article history:
Received November 18, 2017
Received in revised format:
April 28, 2018
Accepted May 4, 2018
Available online
May 5, 2018
Tehran, as one of the most populated capital cities worldwide, is categorized in the group of
highly polluted cities in terms of the geographical location as well as increased number of
industries, vehicles, domestic fuel consumption, intra-city trips, increased manufacturing units,
and in general excessive increase in the consumption of fossil energies. City logistics models can
be effectively helpful for solving the complicated problems of this city. In the present study, a
queuing theory-based bi-objective mathematical model is presented, which aims to optimize the
environmental and economic costs in city logistics operations. It also tries to reduce the response
time in the network. The first objective is associated with all beneficiaries and the second one is
applicable for perishable and necessary goods. The proposed model makes decisions on urban
distribution centers location problem. Subsequently, as a case study, the fruit and vegetable
distribution network of Tehran city is investigated and redesigned via the proposed modelling.
The results of the implementation of the model through traditional and augmented ε-constraint
methods indicate the efficiency of the proposed model in redesigning the given network.
.2018 by the authors; licensee Growing Science, Canada©
Keywords:
City logistics
Carbon emission
Urban distribution centers
Fruit and vegetable distribution
network
Network design
Queuing theory
1. Introduction
Meeting citizens' public needs, especially foods is one of the most important and perhaps the most
principal elements of urban services. Besides, providing welfare and comfort for citizens entails proper
deployment, optimal distribution, comprehensiveness and perfectness of applications and usages, as
well as diversity of supplied products in markets and shopping centers. This is because proper
deployment of supply centers has a significant impact on reducing intra-city trips and traffic jams as
well as energy- and cost- savings. It is impossible to accomplish proper deployment of supply centers
without considering the geographical factors of population, location, and space as well as other factors
such as transportation infrastructures, land, fair access, adaptability and adjacency, population density,
capability and capacity, environmental considerations, and parking space. In this regard, it is essential
to develop models that take into account and apply these factors in urban designs to the possible extent
(Yang et al., 2016).
Based on the research conducted by the United Nation (UN), it is estimated that more than 60% of the
entire world's population will be residing in urban areas by 2030 and above 70% by 2050. High density
of population in urban areas has caused various problems including high energy consumption rate, air
pollution, and traffic congestion. Advancement of logistic systems, such as on-time and smart retailing,

46
inclines suppliers to keep their inventories at a low level and try to make savings in storage costs. These
factors have resulted in the increased demand for commodities and services and simultaneously reduced
volume of these demands, followed thereby by increased traffic of freight vehicles and, consequently,
increased emission of pollutants (Taniguchi et al., 2001). City logistics models can be effective for
solving such complicated problems (Taniguchi et al., 2014). In this regard, several policy measures
have been implemented and assessed using various models in a number of cities around the world
(Taniguchi et al., 2014).
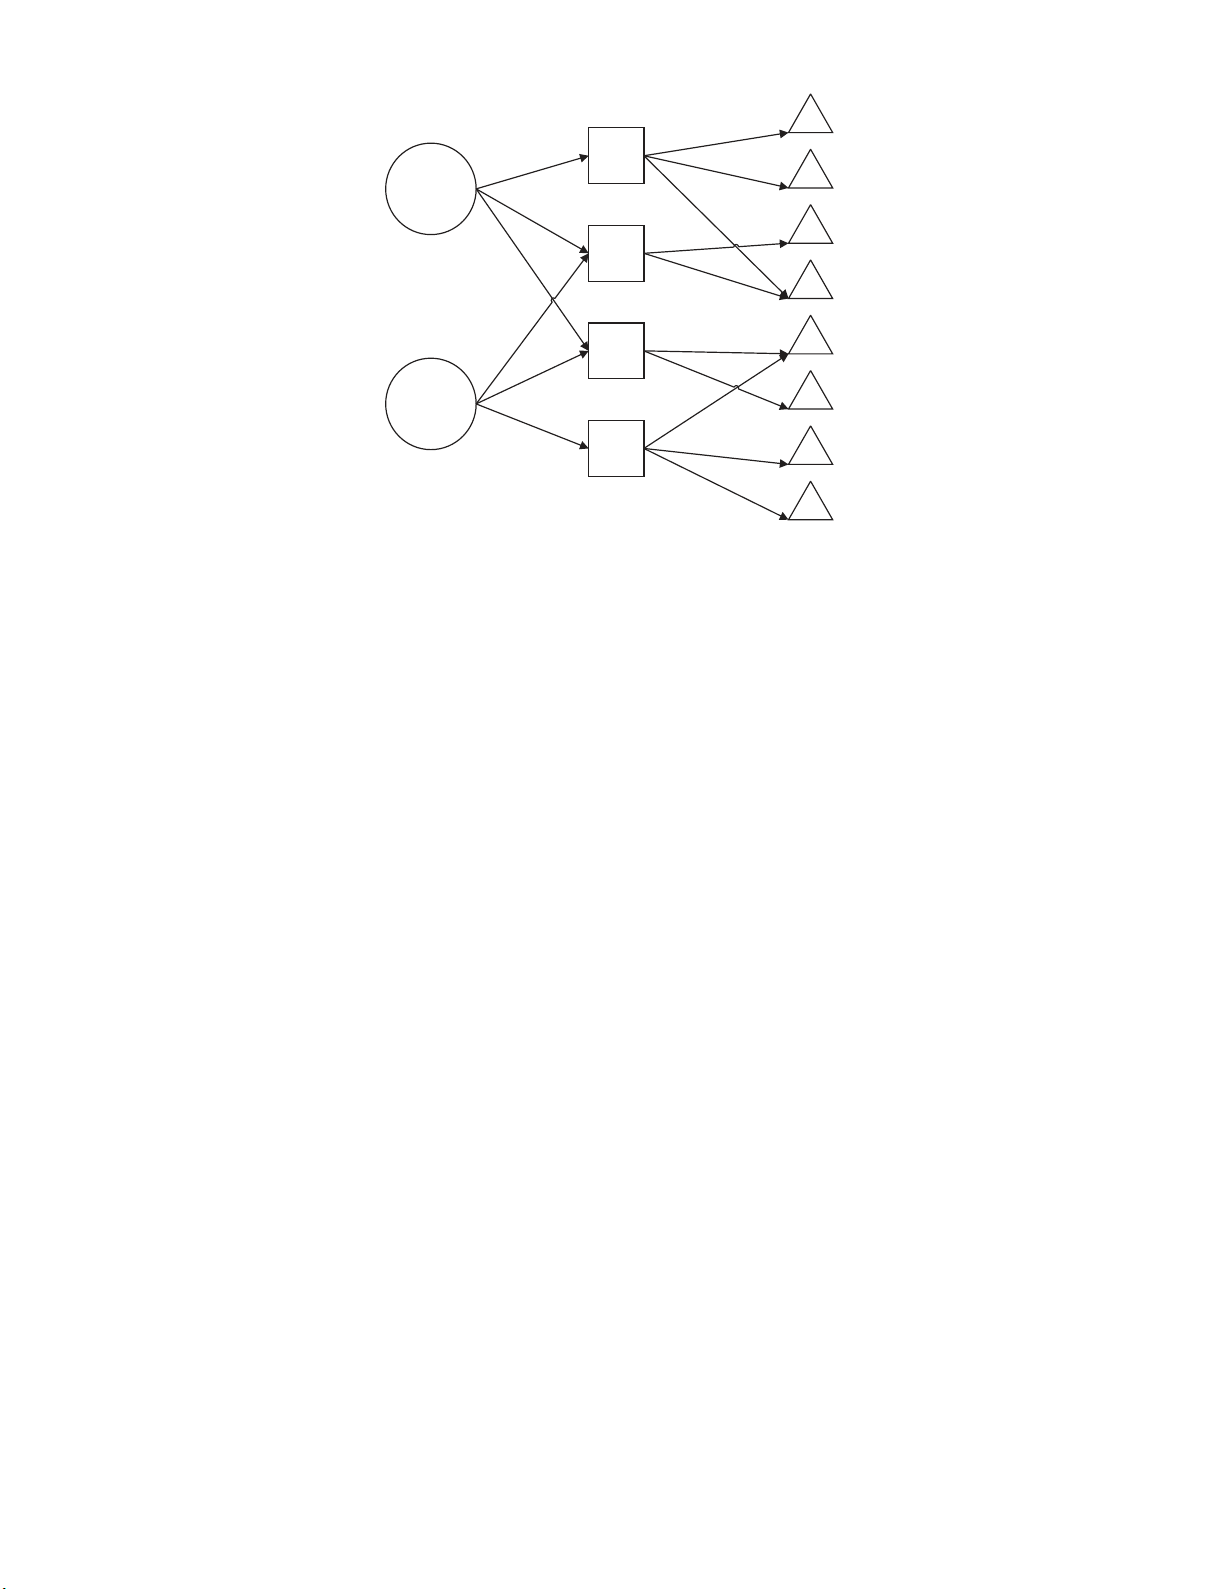
In the present study, a three-level network is investigated in order to optimize the city logistics
distribution operations and simultaneously to reduce the economic and environmental costs.
Meanwhile, it is attempted to minimize the response time in the network. In the given network, the first
level represents the logistic centers in suburban areas, the second level represents the distribution
centers inside the city, and the third level represents the sales terminals as demand points across the
city. It is supposed to select some fixed sites for constructing urban distribution centers. Besides, it is
necessary to make decisions on the capacity of distribution centers as well as the manner of allocating
these distribution centers to the logistic centers and the sales terminals to the distribution centers. The
demand for commodities is considered as probabilistic and the network is modelled based on the
queuing theory. For the provided model, the policy of putting tax on carbon and applying the low-
carbon emission resources for deployment at urban distribution centers is used. Afterwards, the
mathematical model presented in this work is applied as a case study in order to design a fruit and
vegetable distribution network in Tehran. Initially, the fruit distribution status in this city is described.
Then, using the data and information gathered from the sources and organizations affiliated to Tehran
Municipality, it is attempted to adjust the required parameters of the problem to the possible extent.
Finally, the results derived from solving the mathematical model via traditional and augmented ε-
constraint methods in this case study are presented. Results of the present study indicate high efficiency
of the proposed model in achieving its objectives and the preference of the augmented approach in
comparison with traditional one. At the end, the conclusion as well as some suggestions for future
studies are provided.
2. Review of literature
City logistics was introduced for the first time by Taniguchi in 2001. Since then, many researchers have
presented papers and studies with a focus on this area. Notwithstanding these works, mathematical
modelling of city logistics requires further attempts as well as development of relevant models. In this
regard, numerous terms and definitions have been proposed to date in order to express the concept of
city logistics. Among them, it would be better to adopt the most comprehensive definition (Wolpert &
Reuter, 2012). Some of the definitions proposed in this regard are as follows:
a. Freight transportation in urban areas (Barceló et al., 2005)
b. Routing and displacing commodities and associated activities such as warehousing (Qiu &
Yang, 2005)
c. Optimizing urban freight transportation systems (Crainic et al., 2009)
d. Providing various services for the optimal management of displacement of commodities in
cities (Dablanc, 2007)
e. Optimization process of logistics and transportation activities in urban areas considering all
beneficiaries (Taniguchi et al., 2001)
The last definition for city logistics by Taniguchi et al. (2001) seems to be more comprehensive.
Objectives of city logistics can be defined from two perspectives. In the first perspective, these
objectives can be categorized as economic, environmental, and social, while the second perspective
deals with mobility, sustainability, viability, and flexibility (Taniguchi et al., 2014).

F. Saeedi et al. / Decision Science Letters 8 (2019)
47
So far, numerous studies have been conducted in order to investigate and identify the modellings of
city logistics presented by various researchers (Anand et al., 2012; Taniguchi et al., 2014; Anand et al.,
2015; Muñuzuri & Pablo, 2012; Wolpert & Reuter, 2012).
According to these studies, most of the modellings have been performed with a focus on the economic
and environmental objectives and some others have addressed the problems of crisis and disaster as
well as the issue of emergency logistics in cities (He et al., 2013). Optimizing the location of logistic
facilities in metropolitan areas at any time, either crisis or normal conditions, is considered of great
importance due to its considerable effect on traffic congestion and air pollution (Duren & Miller, 2012).
The majority of the modellings have been performed from the viewpoint of city's authorities and
managers. However, the sustainable and green objectives have been highly regarded by the authors in
recent years (Teimoury et al., 2017). Among such research projects, Yang et al. (2016) and Moutaoukil
et al. (2015) can be mentioned.
Several innovative projects have been aimed to reduce the emission of CO2 and greenhouse gases in
urban areas, which has been accomplished mainly in three ways: stabilizing the flow of commodities,
applying the low-emission vehicles, and setting the regulations of access control to urban centers.
Stabilization of the flow of commodities, which is mainly based on the use of a single distribution
center, seems to be a suitable solution for optimizing the final delivery inside the city (Taniguchi and
Thompson, 2014).
In addition to these works, it would be an interesting idea to apply the queuing theory in order to
optimize the demand responding time in city logistics systems and, consequently, focus on increasing
the customer satisfaction in addition to attempting to reduce logistic costs (Saeedi et al., 2018).
3. Problem presentation and mathematical modelling
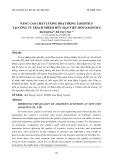
Freight vehicles gather commodities and goods from logistic centers (LC) in the suburban areas and,
then, transfer them to the intra-city distribution centers (DC) in order for further processes (including
packaging, storage, combining, barcoding, etc.). Eventually, these commodities are distributed
extensively among sales terminals (ST), also called demand points (Saeedi et al., 2018). In the present
study, objective of the problem was to select some fixed sites for constructing urban distribution
centers. Due to the limitation of capital costs, only a few number of distribution centers could be
constructed and, subsequently, only a certain number of these activated centers would receive the
governmental support to be equipped with low-carbon facilities (e.g. employment of the equipment,
which can consume natural liquid gas as fuel, or more complex structures in designing distribution
centers with optimal carbon rate). Furthermore, regarding the carbon tax policies adopted by the
government and city managers, the costs of carbon emissions resulted from processing of commodities
in distribution centers as well as transportation operations by vehicles within the network should be
taken into consideration. The ultimate objective was to minimize the total operational costs as well as
to minimize the response time. The first objective could be attractive for all beneficiaries and the second
one is appropriately applicable for perishable and necessary commodities.
In this network, the nodes and commodities played the roles of server and customer, respectively. At
the network's nodes, operations such as production, storage, packaging, barcoding, cutting, mixing,
combining, loading, discharging, sorting, processing, and delivery were performed. The governing
conditions of the problem were associated with uncertainty. Thus, under such conditions, the demand
for commodities and the service-providing time were considered as probabilistic.
48
LC
LC
DC
DC
DC
ST
ST
ST
ST
ST
ST
ST
ST
DC
Fig. 1. City logistics distribution network (Teimoury et al., 2017)
3.1.Assumptions
Each sales terminal can supply the demand for a certain commodity only from a single
distribution center, but there is no limitation for supplying the sales terminals' demands from
several distribution centers.
Each node of the network is considered as an M/M/1 queuing system.
Service time at the network's nodes is probabilistic and is considered as having an exponential
distribution function.
Entry of demand into sales terminals is considered probabilistic with an exponential distribution
function and the value of demand is considered as having a uniform distribution function.
3.2. Symbols and parameters
I Index for LCs
J Index for DCs to be set up in candidate sites
K Index for STs
R Index for commodity
TC Total operational cost in network
RT System's response time
Demands of commodity type r for ST k
dij Distance from LC i to DC j
djk Distance from DC j to ST k
fj Unit construction cost for DC j
B Total fixed cost at DCs
Cost unit of processing at distribution center j for r-type commodity
Cost unit of transport of r-type commodity from distribution center j to each
sales terminal
Cost unit of transport of r-type commodity from logistics center i to each
distribution center
pej Carbon emission unit from all processing stages at distribution center j
tej Carbon emission unit of vehicles from distribution center j to each sales
terminal

F. Saeedi et al. / Decision Science Letters 8 (2019)
49
ei Carbon emission unit of vehicles from logistic center i to each distribution
center
Ui Commodity supply capacity of logistics center i
W Number of DCs planned to construct
V Number of resources with low carbon emissions that should be allocated to the
distribution centers
a Carbon tax rate
b
Carbon emission reduction percentage at each distribution center where the low-
carbon resources have been considered
Demand entry rate at network's nodes (,
and )
Service-providing rate at network's nodes (, and )
Parameter of negative exponential distribution
c Lower bound of a uniformly distributed random variable that indicates the
quantity of commodity in a demand
d Upper bound of a uniformly distributed random variable that indicates the
quantity of commodity in a demand
Response time of the system for commodity type r from node i to node k, going
through DC located at node j
Sojourn time of commodity type r in the system
Waiting time of commodity type r in the queue
Average number of commodities in the system
Average number commodities in the queue
Transportation time for commodity type r from node i to node j
Transportation time for commodity type r from node j to node k
Transportation speed for commodity type r from node i to node j
Transportation speed for commodity type r from node j to node k
3.3. Decision variables
Amount of r-type commodity that is carried from logistics center i to
distribution center j
Zj 1 if DC j is set up; 0, otherwise
Cj Processing capacity designed at distribution center j
Pj Equal to 1 if low-carbon resources are allocated to distribution center j; 0
otherwise
1 if commodity type r is delivered from LC i to DC j; 0, otherwise
1 if commodity type r is delivered from DC j to ST k; 0, otherwise
3.4. Mathematical model
1
(1)
(2)

![Quy định pháp luật về dịch vụ logistics trong thương mại điện tử: Hoàn thiện và [Nêu bật điểm mới/hướng dẫn chi tiết]](https://cdn.tailieu.vn/images/document/thumbnail/2023/20230918/vimurdoch/135x160/7991695035219.jpg)

![Tài liệu học tập Hàng hoá [mới nhất]](https://cdn.tailieu.vn/images/document/thumbnail/2026/20260316/hoatrami2026/135x160/56001773801286.jpg)


