Open Access
Available online http://ccforum.com/content/11/6/R121
Page 1 of 7
(page number not for citation purposes)
Vol 11 No 6
Research
Prediction of volume response under open-chest conditions
during coronary artery bypass surgery
Michael Sander1, Claudia D Spies1, Katharina Berger1, Herko Grubitzsch2, Achim Foer1,
Michael Krämer1, Matthias Carl1 and Christian von Heymann1
1Department of Anesthesiology and Intensive Care Medicine, Charité Universitätsmedizin Berlin, Campus Virchow Klinikum and Campus Charité
Mitte, Augustenburger Platz 1, 13353 Berlin, Germany
2Department of Cardiovascular Surgery, Charité Universitätsmedizin Berlin, Campus Virchow Klinikum and Campus Charité Mitte, Augustenburger
Platz 1, 13353 Berlin, Germany
Corresponding author: Michael Sander, michael.sander@charite.de
Received: 4 Jul 2007 Revisions requested: 31 Jul 2007 Revisions received: 30 Sep 2007 Accepted: 22 Nov 2007 Published: 22 Nov 2007
Critical Care 2007, 11:R121 (doi:10.1186/cc6181)
This article is online at: http://ccforum.com/content/11/6/R121
© 2007 Sander et al.; licensee BioMed Central Ltd.
This is an open access article distributed under the terms of the Creative Commons Attribution License (http://creativecommons.org/licenses/by/2.0),
which permits unrestricted use, distribution, and reproduction in any medium, provided the original work is properly cited.
Abstract
Introduction Adequate fluid loading is the first step of
hemodynamic optimization in cardiac patients undergoing
surgery. Neither a clinical approach alone nor conventional
parameters like central venous pressure (CVP) and pulmonary
capillary wedge pressure (PCWP) are thought to be sufficient
for recognizing fluid deficiency or overload. The aim of this study
was to evaluate the suitability of CVP, PCWP, global end-
diastolic volume index (GEDVI), pulse pressure variation (PPV),
and stroke volume variation (SVV) for predicting changes in the
cardiac index (CI) and stroke volume index (SVI) after
sternotomy.
Methods In 40 patients, CVP, PCWP, GEDVI, PPV, SVV, and
the CI were measured at two points of time. One measurement
was performed after inducing anesthesia and one after
sternotomy.
Results A significant increase in heart rate, CI, and GEDVI was
observed during the study period. CVP, SVV, and PPV
decreased significantly. There were no significant correlations
between CVP and PCWP and changes in CI. In contrast,
GEDVI, SVV, and PPV significantly correlated with CI changes.
Only relative changes of GEDVI, SVV, and PPV predicted
changes in SVI.
Conclusion During cardiac surgery and especially after
sternotomy, CVP and PCWP are not suitable for monitoring fluid
status. Direct volume measurement like GEDVI and dynamic
volume responsive measurements like SVV and PPV may be
more suitable for monitoring the volume status of patients,
particularly under open-chest conditions.
Introduction
Adequate fluid loading is the first step in the hemodynamic
optimization of surgical patients. This is especially true for car-
diac patients, who, on the one hand, may have a fluid defi-
ciency because of preoperative fasting but, in turn, may only
restrictedly tolerate rapid fluid substitution depending on the
underlying cardiac disease. An exact estimation of volume sta-
tus is particularly difficult in these patients. The clinical
approach alone is often not sufficient for the early recognition
of fluid deficiency or overload to implement targeted treatment
[1]. Thus, volume status imbalances frequently are not recog-
nized at all or are recognized too late, which may have drastic
consequences for the hemodynamic stability of these patients
[1,2].
Thus far, filling pressures have been used most often in the
clinical routine to assess the hemodynamic status and the vol-
ume status. In a nationwide survey of internal medicine and
surgical intensive care units, central venous pressure (CVP)
was named in 90% of the cases as the monitoring procedure
of choice for volume therapy, followed by pulmonary capillary
wedge pressure (PCWP) with almost 60% [3]. A more recent
survey of cardiosurgical intensive care specialists showed that
CVP is used for monitoring volume therapy 87% of the time,
CI = cardiac index; CPB = cardiopulmonary bypass; CVP = central venous pressure; DSt = downslope time; GEDVI = global end-diastolic volume
index; HAES = hydroxyaethyl starch; ITBVI = intrathoracic blood volume index; MTt = mean transit time; PCWP = pulmonary capillary wedge pres-
sure; PPV = pulse pressure variation; SV = stroke volume; SVI = stroke volume index; SVV = stroke volume variation.

Critical Care Vol 11 No 6 Sander et al.
Page 2 of 7
(page number not for citation purposes)
followed by mean arterial blood pressure with 84% and
PCWP with 30% [4]. Parameters allowing a directly measured
approximation of intrathoracic fluid loading have been used in
the clinical routine for some years. These parameters may con-
tribute to more targeted and optimized volume therapy. To esti-
mate the volume status, the global end-diastolic volume index
(GEDVI) might be of more use than filling pressures [5].
Dynamic parameters that assess volume reactivity, like stroke
volume variation (SVV) and pulse pressure variation (PPV), are
also increasingly used to monitor volume therapy [6-8]. The
aim of this study was to examine the suitability of the estab-
lished parameters CVP and PCWP and the newer parameters
GEDVI, PPV, and SVV to predict changes in cardiac index (CI)
and stroke volume index (SVI) after sternotomy in cardiac sur-
gery patients.
Materials and methods
Patients
After approval from the ethics committee and patients' written
informed consent were obtained, 40 patients were recruited
for this study. In these patients, we measured volumetric and
dynamic volume parameters.
Anesthetic procedure
Flunitrazepam (0.5 to 2 mg) was given at night and midazolam
(0.1 mg/kg body weight) before surgery as oral premedication.
Before induction of general anesthesia, the femoral artery was
punctured under local anesthesia for continuous invasive
blood pressure measurement. Standardized anesthesia was
induced with midazolam (0.05 to 0.1 mg/kg), fentanyl (5 μg/
kg), etomidate (0.2 mg/kg), and pancuronium (0.1 mg/kg). Iso-
flurane (0.6 to 1 volume percentage end tidal) and continuous
fentanyl were given to maintain anesthesia. After endotracheal
intubation, the patients were ventilated to an end tidal CO2 of
35 to 40 mm Hg with a constant tidal volume. A five-channel
electrocardiogram and oxygen saturation were continuously
recorded. A 4-lumen central venous catheter and a pulmonary
artery catheter were inserted via puncture of the internal jugu-
lar vein. In all patients included in the study, isovolemic
hemodilution using 6% hydroxyaethyl starch (HAES) solution
(Voluven®; Fresenius Kabi AG, Bad Homburg, Germany) and
balancing the preoperative fluid deficit according to clinical
criteria with crystalloid volume were performed after induction
of anesthesia. We performed hemodilution to achieve a hema-
tocrit below 25% in all patients during cardiopulmonary
bypass (CPB) as a local standard. Autologous blood was
retransfused after weaning from CPB.
Determination of cardiac index, global end-diastolic
volume, pulse pressure variation, and stroke volume
variation
After injection of a cold saline solution, the thermal indicator
dilution curve was recorded with a thermistor-tipped catheter
in the descending aorta. The CI was determined by a standard
thermodilution technique. The calculation of intrathoracic vol-
umes was performed by an analysis of the transit times of the
indicator derived from the dilution curve that is recorded in the
descending aorta.
Mean transit time (MTt) and exponential downslope time (DSt)
of the thermal indicator were recorded. By multiplying CI with
the MTt of the indicator, the volume between the sites of injec-
tion and indicator detection can be calculated. The intratho-
racic thermal volume is based on the thermal indicator curve.
Multiplying the CI by the DSt of the thermodilution curve
results in the pulmonary thermal volume, which is the largest
single mixing volume. GEDV is obtained by subtracting the
pulmonary thermal volume from the intrathoracic thermal
volume.
Changes in arterial blood pressure induced by mechanical
ventilation allow assessment of cardiac preload. In this study,
SVV, which is the percentage change between the maximal
and minimal stroke volumes (SVs) divided by the average of
the minimum and maximum over a floating period of 30 sec-
onds, was recorded. PPV, which was calculated as the differ-
ence between the systolic blood pressure and the diastolic
blood pressure of the previous beat, was assessed accord-
ingly. SVI was calculated from cardiac output, measured by
transpulmonary thermodilution divided by heart rate and body
surface area.
Study design and monitoring
Hemodynamic and volumetric parameters were determined in
the study: CVP, PCWP, heart rate, and mean arterial blood
pressure were documented immediately after induction of
general anesthesia. Moreover, transpulmonary thermodilution
of the CI, GEDVI, PPV, and SVV were measured using a com-
mercially available monitor (PiCCO Plus; PULSION Medical
Systems AG, Munich, Germany) at this time point. All meas-
urements were repeated 15 minutes after sternotomy. To
examine the correlation between changes in hemodynamic
and volumetric parameters and CI, differences of each param-
eter were calculated between the first and second measuring
points and correlated to the changes in CI. To assess the pre-
dictive capacity of the measured parameters, the absolute val-
ues of CVP, PCWP, GEDVI, SVV, and PPV after induction of
anesthesia and the relative changes between the two meas-
urements in this study were analyzed with receiver operating
characteristic curves. A positive response to the volume load
after chest opening was defined as an increase in SVI of 15%,
as published previously [9].
Statistical analysis
All data were given as mean and standard deviation assuming
normal distribution, which was verified with the Kolmogorov-
Smirnov test. The correlation between changes in hemody-
namic and volumetric parameters was analyzed using Pear-
son's correlation analysis. Changes in individual parameters
over the course of the study were determined with the paired

Available online http://ccforum.com/content/11/6/R121
Page 3 of 7
(page number not for citation purposes)
t test. The predictive capacity of the tested parameters was
tested by receiver operating characteristic analysis [9]. The
statistical program SPSS (Version 14.0; SPSS Inc., Chicago,
IL, USA) was used for the statistical evaluation of all
parameters.
Results
Volumetric and hemodynamic parameters were determined in
40 patients. The first set of measurements was performed
directly after inducing anesthesia. Then a mean of 1,364 mL
(713 mL) of autologous blood was taken from the patients,
and 1,459 mL (605 mL) of HAES 6% and 1,311 mL (742 mL)
of crystalloid fluid were substituted as a local standard to
account for preoperative deficits and guarantee a hematocrit
below 0.25 during CPB. After hemodilution and fluid therapy
were concluded, the second set of measurements was per-
formed 15 minutes after sternotomy. Patients' basic character-
istics are presented in Table 1.
During the study period, there was a significant increase in
heart rate and a significant decrease in CVP (Table 2). We
also observed a significant decrease in systemic and pulmo-
nary vascular resistances with a concomitant significant
increase in CI and SVI (Table 2). GEDVI significantly
increased and SVV and PPV significantly decreased after fluid
loading (Table 2).
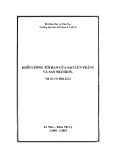
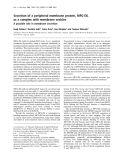
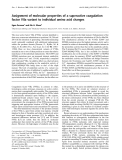
The changes in the CI between the two measuring points did
not correlate with changes in the CVP or PCWP (Figure 1).
The correlation coefficients were r = -0.280 for CVP and r =
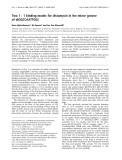
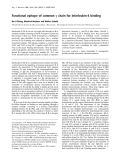
0.017 for PCWP. In contrast, the increase in GEDVI corre-
lated with the increase in CI (Figure 2). The correlation coeffi-
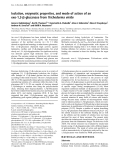
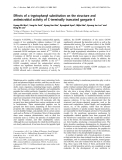
cient here was r = 0.518 (p < 0.01). Moreover, the decrease
in SVV and PPV correlated with an increase in CI with correla-
tion coefficients of r = -0.399 (p = 0.03) for SVV and r = -
0.411 (p = 0.02) for PPV (Figure 3).
The best prediction of changes in SVI was observed from rel-
ative changes in SVV and PPV. Also, the change in GEDVI
was predictive for an increase in SVI after fluid loading and
sternotomy. None of the absolute parameters after induction
of anesthesia was able to predict an increase in SVI after vol-
ume loading and chest opening (Table 3).
Discussion
The most important results of this study are that the increase
of CI observed after sternotomy and volume loading in our
study in cardiac surgical patients did not correlate with
changes in CVP and PCWP. In contrast, the changes in
GEDVI, SVV, and PPV showed a significant correlation. This is
Table 1
Basic characteristics
Mean Standard deviation
Age, years 63 10
Male/female gender 36/4
Height, meters 1.75 0.06
Weight, kg 90 15
Body mass index, kg/m229.4 4.5
Body surface, m22.08 0.19
Table 2
Hemodynamic measurements
Induction of anesthesia After sternotomy
Mean SD Mean SD P value
Heart rate, L/minute 66 12 70 17 0.02
Mean arterial blood pressure, mm Hg 72 12 73 14 0.61
Mean pulmonary artery blood pressure, mm Hg 22 4 22 8 0.98
Central venous pressure, mm Hg 12 4 9 4 <0.01
Pulmonary capillary wedge pressure, mm Hg 13 4 12 4 0.19
Cardiac index, L/minute per m22.16 0.34 3.06 0.76 <0.01
Stroke volume index, mL/m233.4 6.3 44.2 9.4 <0.01
Systemic vascular resistance, dyn/second per cm-5 1,126 240 877 312 <0.01
Pulmonary vascular resistance, dyn/second per cm-5 156 72 118 57 <0.01
Global end-diastolic volume index, mL/m2615 99 648 106 0.04
Stroke volume variation, percentage 16 8 10 5 <0.01
Pulse pressure variation, percentage 15 7 9 5 <0.01
SD, standard deviation.

Critical Care Vol 11 No 6 Sander et al.
Page 4 of 7
(page number not for citation purposes)
of major clinical interest since the vast majority of anesthesiol-
ogists still use filling pressures as a standard monitoring tool
for volume management, but as demonstrated by our results,
filling pressures might not be the monitoring parameters of
choice under open-chest conditions [4]. Only relative changes
of SVV, PPV, and GEDVI were able to predict an increase in
SVI after sterotomy and volume loading.
Opening the chest causes a decrease in airway pressures and
hence in the effects of the mechanical ventilation on venous
return. Therefore, after sternotomy, we assumed that PPV and
SVV might decrease and CI and SVI might increase alone due
to the change in airway pressure. These effects might be
regarded as a relative increase in 'cardiac preload' due to a
facilitated venous return. This is in line with our findings and
was shown previously in an experimental design [10]. Fluid
loading is decisively important in cardiac surgical patients to
optimize cardiac output and tissue oxygenation [11,12]. With
optimal preload, cardiac contractility increases and cardiac
work is economized. However, determining left ventricular
preload in the clinical routine is particularly difficult during sur-
gery. Filling pressures like CVP and PCWP are normally used
as parameters of right and left heart preload. The lack of a cor-
relation of filling pressures as a volume parameter in our study
has also been described in other studies and has several rea-
sons: CVP and PCWP depend not only on intravascular vol-
ume and peripheral vessel tone but also on right/left
ventricular compliance, pulmonary vessel resistance, and
intrathoracic pressure. Sakai and colleagues [13] described a
significant correlation between increasing PEEP and rising
CVP (r = 0.88). Furthermore, PCWP depends on the function
of the mitral valve and the contractility of the left ventricle. The
therapeutic application of vasodilators and vasopressors has
been shown to influence measurements [14].
Other studies evaluating volumetric parameters in different
surgical areas generally agree with our results. Thus, it was
shown that ITBVI and GEDVI correlate better with cardiac
preload than filling pressures [15-18]. Moreover, no significant
correlation was found between the percentage of changes in
CI and the SVI, CVP, and PCWP changes over a 24-hour
period in patients after uncomplicated coronary artery bypass
surgery [19]. Lichtwarck-Aschoff and colleagues [18] showed
for the first time that volumetric parameters like ITBV were
superior to filling pressures (CVP and PCWP) for assessing
the preload. This was also confirmed in other studies with dif-
ferent patient populations [20-22]. In burn patients, optimized
Figure 1
Correlation between changes in the cardiac index, central venous pressure (CVP), and pulmonary capillary wedge pressure (PCWP)Correlation between changes in the cardiac index, central venous pressure (CVP), and pulmonary capillary wedge pressure (PCWP).
Figure 2
Correlation between changes in the cardiac index and global end-diastolic volume index (GEDVI)Correlation between changes in the cardiac index and global end-
diastolic volume index (GEDVI).

Available online http://ccforum.com/content/11/6/R121
Page 5 of 7
(page number not for citation purposes)
volume and fluid loading are of particular clinical interest since
greater volume shifts are seen in these patients over a short
time and empirical volume therapy frequently underestimates
the real fluid requirement. In these patients, significant correla-
tions were found between ITBVI, CI, and oxygen supply
parameters [23], whereas CVP and PCWP failed to predict
changes in CI dependent on volume loading. Furthermore,
Reuter and colleagues [7] showed that there was a significant
decrease in CI and GEDVI after taking autologous blood for
hemodilution following sternotomy. Particularly with mechani-
cal ventilation and changes in the intrathoracic pressure, volu-
metric parameters like ITBVI and GEDVI are clearly superior to
filling pressures (CVP and PCWP) for estimating the cardiac
preload [24]. This is especially relevant for cardiac surgery
patients since intrathoracic pressure markedly changes after
sternotomy, which may decisively affect the usability of
changes in the filling pressures.
Positive intrathoracic pressure following mechanical ventila-
tion induces a reduction in biventricular preload. This is
reflected by variations in the SV. These variations during a
defined interval have proven to be useful parameters of car-
diac preload [25]. SVV and PPV are parameters derived from
changes in SV dependent on mechanical ventilation and have
Figure 3
Correlation between changes in the cardiac index, stroke volume variation (SVV), and pulse pressure variation (PPV)Correlation between changes in the cardiac index, stroke volume variation (SVV), and pulse pressure variation (PPV).
Table 3
Prediction of change in stroke volume index with receiver operating characteristic analysis
Area under the curve P value 95% confidence interval
CVP induction of anesthesia 0.54 0.69 0.32–0.76
PCWP induction of anesthesia 0.54 0.72 0.31–0.77
GEDVI induction of anesthesia 0.60 0.34 0.38–0.82
SVV induction of anesthesia 0.69 0.10 0.47–0.90
PPV induction of anesthesia 0.67 0.14 0.43–0.91
Delta CVP 0.66 0.13 0.45–0.87
Delta PCWP 0.57 0.55 0.35–0.79
Delta GEDVI 0.76 0.01 0.61–0.91
Delta SVV 0.85 0.01 0.69–0.98
Delta PPV 0.80 0.02 0.63–0.96
CVP, central venous pressure; GEDVI, global end-diastolic volume index; PCWP, pulmonary capillary wedge pressure; PPV, pulse pressure
variation; SVV, stroke volume variation.