An extension to the metabolic control theory taking into account
correlations between enzyme concentrations
Se
´bastien Lion
1,
*, Fre
´de
´ric Gabriel
1
, Bruno Bost
2
, Julie Fie
´vet
1
, Christine Dillmann
1
and
Dominique de Vienne
1
1
UMR de Ge
´ne
´tique Ve
´ge
´tale, INRA/UPS/CNRS/INAPG, Ferme du Moulon, Gif-sur-Yvette, France;
2
Institut de Ge
´ne
´tique et
Microbiologie, CNRS UMR 8621, Universite
´Paris Sud, Orsay Cedex, France
The classical metabolic control theory [Kacser, H. &
Burns, J.A. (1973) Symp.Soc.Exp.Biol.27, 65–104;
Heinrich, R. & Rapoport, T. (1974) Eur. J. Biochem. 42,
89–95.] does not take into account experimental evidence
for correlations between enzyme concentrations in the
cell. We investigated the implications of two causes of
linear correlations: competition between enzymes, which
is a mere physical adaptation of the cell to the limitation
of resources and space, and regulatory correlations,
which result from the existence of regulatory networks.
These correlations generate redistribution of enzyme
concentrations when the concentration of an enzyme
varies; this may dramatically alter the flux and metabolite
concentration curves. In particular, negative correlations
cause the flux to have a maximum value for a defined
distribution of enzyme concentrations. Redistribution
coefficients of enzyme concentrations allowed us to cal-
culate the Ôcombined response coefficientÕthat quantifies
the response of flux or metabolite concentration to a
perturbation of enzyme concentration.
Keywords: biochemical modelling; cellular constraint; flux;
metabolite; response coefficient.
The introduction of the metabolic control theory by Kacser
& Burns [1] and Heinrich & Rapoport [2] was a great
improvement in our understanding of the control of
metabolism (for a review see [3]). Numerous extensions to
the classical theory have been proposed to get rid of some
restrictive hypotheses of the initial theory. Extensions exist,
for example, for nonproportionality of the rates of reaction
to enzyme concentration [4], enzyme–enzyme interaction
[5,6], time-varying systems [7,8], or supply–demand analysis
[9]. Nevertheless, most studies have neglected the correla-
tions that exist between enzyme amounts in the cell.
Concentration is a key parameter for enzyme activity.
Changes in expression of enzyme genes play a central role in
the physiology of the cell, and dramatic modifications of the
cell proteome are consistently observed over development
and differentiation, or in response to environmental changes
(see http://us.expasy.org for examples in various species). In
addition, genetic studies have revealed natural variability for
enzyme concentration, for instance for alcohol dehydro-
genase in Drosophila [10] or lactate dehydrogenase in
Fundulus heteroclitus [11]. Other examples can also be
found [12,13]. Quantitative proteomic approaches have
confirmed that a majority of proteins/enzymes can display
a large range of variation within species [14–19]. Those
physiological or genetic variations are expected to be
interdependent. There is evidence for cellular constraints
that induce a variation of concentration of some enzymes
in response to a variation of others. These correlations
between enzyme concentrations undoubtedly have an
impact on the behaviour of metabolic systems, and hence
on their evolution. Two kinds of correlations will be studied
in this paper. The first one will be referred to as competition.
It is a mere physical adaptation of the cell to energetic or
steric constraints. The second one results from regulatory
networks. It will be referred to as regulation.
Competitive constraints on the variation of enzyme
concentrations have already been pointed out. Such
constraints have the effect of avoiding macromolecular
crowding, which can result in a modification of catalytic
and/or thermodynamic properties of enzymes [20], in a
limitation of solubility leading to partial protein crystalliza-
tion or aggregation [21,22], or a decrease in the diffusion of
essential metabolites ([23], for a review see [24]). Other
arguments include the limitation of resources, the energetic
cost of maintaining the cellular concentrations of enzymes
[25–27], and the availability of amino acids or elements of
the transcription and translation machinery, which has been
shown to be a limiting factor of protein synthesis in
Escherichia coli [28] and Saccharomyces cerevisiae [29].
Kacser & Beeby [30] were among the first to suggest that
the hyperbolic flux–activity relationship must ultimately
decline, for no more profound reason than that the cell or
organism must eventually reach a point at which the cost of
producing excess enzyme outweighs the benefit in fitness
that can be derived from possessing the excess [31,32].
It is clear that such competitive constraints imply that
variations of enzyme concentrations are negatively correla-
ted: an increase in the concentration of some enzymes
Correspondence to D. de Vienne, UMR de Ge
´ne
´tique Ve
´ge
´tale,
INRA/UPS/CNRS/INAPG, Ferme du Moulon, 91190 Gif-sur-
Yvette, France. Fax: +33 1 69 33 23 40, Tel.: +33 1 69 33 23 60,
E-mail: devienne@moulon.inra.fr
*Present address: Laboratoire d’e
´cologie, E
´cole normale supe
´rieure,
46, rue d’Ulm, 75005 Paris, France.
(Received 19 July 2004, revised 20 September 2004,
accepted 22 September 2004)
Eur. J. Biochem. 271, 4375–4391 (2004) FEBS 2004 doi:10.1111/j.1432-1033.2004.04375.x

causes a decrease in the concentration of other enzymes,
which can lead to important metabolic perturbations, i.e.
to the so-called protein burden effect [33]. For instance,
overexpression of b-galactosidase in E. coli was found to
reduce the synthesis of the other proteins [34] and over-
expression of glycolysis enzymes in Zymomonas mobilis has
been shown to reduce glycolytic flux [35]: therefore, for large
enzyme concentrations, the classical hyperbolic shape of the
flux curve, as predicted by the metabolic control theory,
does not describe in a satisfactory way the behaviour of the
metabolic pathway. Flux can be expected to decrease when
enzyme concentration becomes too high, and it may be
interesting to model such behaviour.
Regulatory correlations can be positive or negative. The
production and degradation of enzymes, which determines
their concentration, is related to the structure of the genetic
regulatory network [36]. The lactose operon in E. coli [37] is
a well known example of a regulatory system that induces
correlations between the concentrations of the enzymes
involved in lactose metabolism. Several experimental and
theoretical studies have been devoted to the understanding
of the mechanisms of regulatory networks [38–41]. Meta-
bolic engineering makes an important use of regulation of
metabolic pathways to achieve overexpression of the
products of interest. For instance, Prati et al. [42] reported
a way to achieve simultaneous inhibition and activation of
two glycosyltransferases of the O-glycosylation pathway in
Chinese hamster ovary cells. In Lactococcus lactis, several
genes of glycolysis have been shown to be expressed at
higher levels on glucose than on galactose [43]. The authors
interpreted this as a result of two different regulatory
networks. With the growing use of quantitative proteomics
methods, we can expect to find many more examples of
correlations between enzymes, even if we still lack the tools
to determine whether regulatory networks actually underlie
these correlations.
The existence of these competitive and regulatory corre-
lations between enzymes is assumed to constrain the
response of the metabolic systems. Here, we present an
extension of the metabolic control theory in which response
coefficients allow us to quantify the change of a metabolic
variable (flux or metabolite concentration) in response to a
perturbation of a parameter (enzyme concentration) and to
the variations of other parameters resulting from that
perturbation. We apply the general concept of a Ôcombined
response coefficientÕto a linear model of redistribution of
enzyme concentrations in order to study the systemic
consequences of enzyme correlations.
Control of metabolic pathways and
redistribution of enzyme concentrations
Control of metabolic variables
Let us consider a metabolic pathway with nenzymes
E
1
,E
2
,…,E
n
catalyzing reversible reactions between sub-
strates S
1
,…,S
m
(mmetabolites).
To quantify the response of a systemic variable y,suchas
the flux in the pathway or the concentration of a metabolite, to
an infinitesimal change in the activity (concentration) of
enzyme E
k
, Kacser & Burns [1] and Heinrich & Rapoport [2]
introduced the control coefficient. In the revised nomen-
clature for metabolic control analysis, the control coefficient
Cy
kis defined as the steady-state response in yto a change in
the local rate of step k,v
k
, with no reference to enzyme con-
centration (http://www.sun.ac.za/biochem/mcanom.html).
In particular, the control coefficient of flux Jwith respect
to step kis:
CJ
k¼vk
J
@J
@vk
and the control coefficient of metabolite concentration S
i
with respect to step kis:
CSi
k¼vk
Si
@Si
@vk
Summation theorems can be derived for metabolite and
flux control coefficients. Summing over all reactions, we
have [1]:
X
n
j¼1
CJ
j¼1and X
n
j¼1
CSi
j¼0
These relationships show that the control of flux (or
metabolite concentration) is shared among all enzymes in
the pathway.
Control coefficients are systemic properties. We can also
define local properties such as the elasticity, which quantifies
theeffectofanyparameterpthat affects the local rate of an
individual (isolated) step. The elasticity coefficient e
k
p
for
step kis written as [1]:
ek
p¼p
vk
@vk
@p
Introducing correlations between enzyme concentrations
The classical form of metabolic control theory implicitly
considers that enzyme concentration can increase towards
infinity, which is biologically inconsistent. Competitive and
regulatory constraints on enzyme concentrations exist, that
can be described with a model of redistribution of enzyme
concentrations.
Weconsideredasystemstartinginastatedefinedbythe
concentrations
E0¼ðE01 ;E02; :::; E0k; :::; E0nÞ
of the nenzymes, and supposed that a variation of the
concentration of a target enzyme E
k
results in a variation of
the concentrations of other enzymes.
Redistribution coefficient. In order to quantify the impact
of variation of enzyme E
k
on enzyme E
j
, we defined the
redistribution coefficient (a
kj
) as the ratio of an infinitesimal
change in the concentration E
j
to an infinitesimal change in
the concentration E
k
:
akj ¼@Ej
@Ekð1Þ
In this framework, the enzyme concentrations become
interdependent parameters.
Combined response coefficient of the flux. If an effector p
acts on the flux through its effect on enzyme j, the response
4376 S. Lion et al.(Eur. J. Biochem. 271)FEBS 2004

coefficient R
J
p
is the product of the flux response coefficient
with respect to enzyme jand the elasticity of enzyme jwith
respect to p[1]:
RJ
p¼CJ
jej
p
Let us now assume that the effector pacts on more than
one enzyme in a metabolic pathway. We can define the
overall, multisite response obtained from the nenzymes of
the system as [44,45]:
RJ
p¼X
n
j¼1
CJ
jej
p
This is only true for very small changes in pbecause the
response coefficient is defined as a first order approxima-
tion. For a large change in p, we should add correction
terms to account for nonlinearities.
Considering an effector pcausing the redistribution of
enzyme concentrations through the modification of con-
centration E
k
of the enzyme E
k
(e.g. pis a mutation causing
an increase of E
k
and consequently modification of other
enzyme concentrations), we can write, replacing pby E
k
:
RJ
Ek¼X
n
j¼1
CJ
jej
k
Assuming that the response of an isolated reaction is
directly proportional to change in enzyme concentration, we
have:
ej
k¼Ek
Ej
akj
so that
RJ
Ek¼EkX
n
j¼1
CJ
j
akj
Ejð2Þ
We call RJ
Ekthe combined response coefficient [46]. We
will show later (in the case of a linear metabolic pathway)
that the combined response coefficient can be equivalently
written as:
RJ
Ek¼Ek
J
@J
@Ek
where the partial derivative is taken on a set of enzyme
concentrations that describes the correlations between
enzymes.
Biologically speaking, this means that the combined
response coefficient contains information about the corre-
lations between the enzyme concentrations, hence the term
ÔcombinedÕ. We can see the combined response coefficient
as a Ôresponse coefficient under constraintÕ. We can split
Eqn 2 into two terms:
RJ
Ek¼CJ
kakk þEkX
j6¼k
CJ
j
akj
Ej
Note that a
kk
¼1 (Eqn 1), so that
RJ
Ek¼CJ
kþEkX
j6¼k
CJ
j
akj
Ejð3Þ
TheeffectofavariationofenzymeE
k
on the flux appears
then to be dependent on two factors: (a) the control exerted by
enzyme E
k
on the flux, and (b) the effect of enzyme E
k
on the
others, through the redistribution rules, which is modulated
by the control exerted by those enzymes on the flux. Thus,
even if enzyme E
k
has a high control coefficient on the flux, an
increase of E
k
should cause a decrease of the flux if E
k
is
negatively correlated with the concentrations of other
enzymes. We can also note that the response coefficient of
enzyme E
k
will be higher than its control coefficient in cases
where enzyme E
k
is positively correlated with at least one
other enzyme of the pathway, and not correlated to the others.
Thus, we have given a general expression for the
combined response coefficient of the flux, valid for a
networkofanycomplexity,withnoassumptionontherules
of redistribution of enzyme concentrations. In the next
paragraph, we will present the theoretical framework that
allowed us to describe the linear correlations between
enzyme concentrations, and in the second part of the
paper we will analyse in detail the particular case of a linear
pathway of enzymes far from saturation, considering the
response of both flux and metabolite concentrations.
Linear models of redistribution of enzyme
concentrations
We assumed linear redistribution, which means that a
kj
is
considered to be constant.
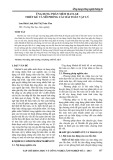
Figure 1 shows how enzyme concentrations are redis-
tributed due to their correlations. Figure 1A corresponds to
the case of independent enzyme concentrations that was
studied in the founding papers of the metabolic control
theory [1,2]. Figure 1B–G corresponds to various con-
straints that result in a redistribution of enzyme concentra-
tions over the variation of a particular enzyme.
Let us examine these constraints, the mathematical
expressions of which are summarized in Table 1. We focus
on a linear model of redistribution of enzyme concentra-
tions but other models are possible. Let us further introduce
the normalized concentration e
j
defined as:
ej¼Ej
Etot
where
Etot ¼X
n
j¼1
Ej
Competitive correlations. In order to take into account the
fact that enzyme concentrations are likely to be bounded,
Heinrich et al. [47–49], and de Vienne et al. [46], have
proposed to put a constraint on the total concentration E
tot
of the enzymes in the pathway. In this paper, this is designed
as competition and we limit the study to the quite rigid
constraint where E
tot
is a constant. We have:
X
n
j¼1
Ej¼Etot ¼const
Using the normalized concentration e
j
, the competitive
constraint on the metabolic pathway reads
X
n
j¼1
ej¼1ð4Þ
FEBS 2004 An extension to the metabolic control theory (Eur. J. Biochem. 271) 4377
In systems with only competitive constraints, the con-
centrations of enzymes E
j
("j„k) decrease when the
concentration of enzyme E
k
increases and the proportions
of enzymes E
j
remain constant. So we can define the
competition coefficient c
kj
between enzymes E
k
and E
j
(i.e.
the constant proportion between these enzymes) as
AB
CD
EF
G
Fig. 1. Redistribution of enzyme concentrations when the concentration of the target enzyme changes. We considered a six-enzyme pathway. E
3
is the
concentration of the target enzyme. The y-axis shows the concentrations of enzymes E
1
,E
2
,E
4
,E
5
and E
6
. Unless otherwise stated, the starting
distribution of enzyme concentrations is the vector E
0
¼(0.04,0.02,0.04,0.37,0.44,0.09), indicated with dots on the figures. The concentration of
the target enzyme varies either between 0 and E
tot
¼1, or between E
3,min
and E
3,max
, depending on the constraints imposed on the system.
(A) Independence between enzyme concentrations. (B) Pure regulation with positive correlations. The redistribution coefficients are a
3
¼b
3
¼
(0.99,0.63,1,0.94,0.43,0.29). (C) Pure regulation with one enzyme being negatively correlated. a
34
¼)0.94, the other redistribution coefficients being
the same as in (B). (D) Competition when the starting distribution of enzyme concentrations is the optimal one, which maximizes the flux. (E)
Competition when the starting distribution of enzyme concentrations is E
0
. (F) Regulation with competition. The starting distribution of enzyme
concentrations is E
1
¼(0.13,0.13,0.31,0.04,0.02,0.37) and the redistribution coefficients are a
3
¼(0.05,0.05,1,0.5,0.5,-2.1). (G) Regulation with
competition when the starting distribution of enzyme concentrations is E
0
and coregulation coefficients b(Eqn 6) are as in (B).
4378 S. Lion et al.(Eur. J. Biochem. 271)FEBS 2004

8j6¼ kckj ¼ ej
1ekð5Þ
Thus partial derivation of Eqn 5 with respect to e
k
leads to
@ej
@ek¼ckj
and we have c
kk
¼1. As by definition akj ¼@ej
@ek,wehave
for pure competitive systems, a simple relationship between
competition and redistribution coefficients (Table 1,
Appendix A):
8j6¼ kakj ¼ckj ¼ ej
1ek
akk ¼ckk ¼1
which can also be derived from summation of Eqn 5.
Regulatory correlations. When redistribution of enzyme
concentrations is only due to regulatory mechanisms, total
enzyme content has no upper limit, but enzyme concen-
trations are correlated. Variation of the concentration of
enzyme E
k
from E
k
to E00
kdrives the system to a new state
E00
1; :::; E00
j; :::; E00
n,where
8jE
00
j¼Ejþbkj ðE00
kEkÞð6Þ
where E
j
is the concentration of enzyme E
j
before the
variation of enzyme E
k
,andb
kj
is the coregulation
coefficient between enzymes E
j
and E
k
. The coefficients
can be positive, negative or null, but at least one is different
from 0. It is worth noting that b
kk
¼1.
In systems with only regulatory constraints, the coregu-
lation coefficient corresponds to the redistribution coeffi-
cient, i.e. a
kj
¼b
kj
, as shown in Appendix A (also Table 1).
Redistribution coefficients in competitive-regulatory path-
ways. When both competition and regulation are present in
a pathway, it is interesting to note that a simple relationship
exists between the redistribution coefficient a
kj
and the
coregulation coefficients b
kj
(Appendix A):
akj ¼bkj ejBk
1ekBkð7Þ
where
Bk¼X
n
j¼1
bkj:
This relationship does not involve explicitly the competi-
tion coefficient c
kj
. But when there is no coregulation in the
system, we have "j„kb
kj
¼0andB
k
¼b
kk
¼1, so that:
akj ¼ ej
1ek¼ckj
Application: the case of a linear pathway
of enzymes
We applied our model of redistribution of enzyme con-
centrations to the linear pathway of enzymes far from
saturation studied by Kacser & Burns [1].
Flux and metabolite concentrations in a linear pathway
Let us consider a linear metabolic pathway, with n enzymes
E
1
,E
2
,…,E
n
converting a substrate X
0
into a final product
X
n
by a series of unimolecular reversible reactions:
X0¢
E1S1¢
E2S2¢
E3... ¢
En2Sn2¢
En1Sn1¢
EnXn
The enzymes are supposed to be Michaelian and far from
saturation. The steady-state flux through the pathway is
[1,2]:
J¼X
P
n
j¼1
1
Vj
MjK0;j1
ð8Þ
and the steady-state concentration of metabolite S
i
is
Si¼J
XK0;iX0X
j>i
1
Vj
MjK0;j1þXn
K0;nX
ji
1
Vj
MjK0;j1
0
@1
Að9Þ
where X
0
and X
n
are the concentrations of substrate X
0
and
product X
n
, respectively, and X¼X
0
)X
n
/K
0,n
.X
0
and X
n
are considered as fixed parameters of the systems, while the
intermediate metabolite concentrations S
i
(1 £i£n)1)
are variables. V
k
is the maximum velocity of enzyme E
k
,M
k
is its Michaelis constant, and K0;k¼Qk
j¼1Kj1;jis the
product of the equilibrium constants of reactions 1, 2,…,k.
To make apparent the concentration of enzymes, E
k
,in
Eqns 8 and 9, we used the relationship:
Vk¼kcat;kEk
where k
cat,k
is the turnover number of enzyme E
k
.
We can then define the activity parameter A
k
of enzyme
E
k
by:
Ak¼kcat;k
Mk
K0;k1
with K
0,0
¼1 by convention.
Table 1. Mathematical expressions of the redistribution coefficients of
enzyme concentrations a
kj
when introducing competitive and/or regula-
tory constraints. a
kj
is the ratio of a change in the concentration E
j
to a
change in the concentration E
k
. Note that values of a
kj
are only true for
j„kbecause a
kk
is always equal to unity. The subscript krefers in this
table to the enzyme whose concentration we want to vary, for instance
through experimental or genetic means (see Appendices A to D for
more details).
No competition
(E
tot
is not constant)
Competition
(E
tot
is constant)
No regulation 8j6¼ kakj ¼0
akk ¼18j6¼ kakj ¼ckj ¼ ej
1ek
akk ¼ckk ¼1
X
n
j¼1
ckj ¼0
Regulation 8j6¼ kakj ¼bkj
bkk ¼18j6¼ kakj¼bkj ejBk
1ekBk
akk ¼1
Xn
j¼1akj ¼0
FEBS 2004 An extension to the metabolic control theory (Eur. J. Biochem. 271) 4379