Usefulness of microchip electrophoresis for reliable analyses
of nonstandard DNA samples and subsequent on-chip enzymatic
digestion
Masatoshi Kataoka
1
, Sonoko Inoue
2
, Kazuaki Kajimoto
1
, Yasuo Sinohara
1,2,3
and Yoshinobu Baba
1,2,4
1
Division of Gene Expression, Institute for Genome Research, The University of Tokushima, Japan;
2
Faculty of Pharmaceutical
Science, University of Tokushima, Japan;
3
Single-Molecule Bioanalysis Laboratory, National Institute of Advanced Industrial Science
and Technology, Takamatsu, Japan;
4
CREST, Japan Science and Technology Corporation, Tokushima, Japan
The Hitachi SV1100 utilizes capillary electrophoresis on a
microchip that is capable of rapidly sizing DNA frag-
ments. Reproducibility of electrophoresis in different
channels was shown by comparing the migration times of
the internal controls, DNA fragments of 100 and 800 bp.
The range of DNA sizing for this microchip is between
100 and 800 bp, and accuracy in sizing of a 322 bp DNA
fragment of a pUC118 PvuII digest was observed, inde-
pendent of DNA concentration. Although relatively good
quantification of this fragment was observed with a DNA
concentration of 1.83 ngÆlL
)1
, error increased in a dose-
dependent manner. Furthermore, the feasibility of
sequential analysis with this microchip was shown by the
reproducibility of successive electrophoreses of the internal
control in one channel. When the pUC118 PvuII digest
was treated with endonuclease KpnI on the microchip for
10 min, sequential analysis showed that the 322 bp frag-
ment completely disappeared and two peaks correspond-
ing to the 130 and 192 bp fragments appeared. This
analysis was performed within 4 min, and the peaks were
estimated as 127 and 183 bp, respectively. These results
indicate the potential of on-microchip endonuclease
treatment of plasmid DNA with sequential analysis,
offering high resolution in a short time.
Keywords: electrophoresis; microchip; plasmid; quanti-
fication; sizing.
Plasmid DNA is one of the most common genetic vectors
used in molecular biological applications [1]. Common
practice in plasmid analysis is to cut the plasmid DNA at
one site with a restriction endonuclease. For DNA sizing
and semiquantification of digested DNA fragments, agarose
gel electrophoresis is performed with a linear DNA sizing
marker followed by ethidium bromide staining. These
methods are manual and time-consuming; each endo-
nuclease treatment and run on an agarose gel requires
about 1 h, and consumes microgram amounts of DNA
fragments. Furthermore, after the electrophoresis, separate
steps of imaging with densitometer scanning of the photo-
graph or CCD imaging of the stained gel are necessary [2].
Miniaturization of analytical and biological instruments
has developed rapidly in the past 10 years [3–8]. Microchip
electrophoresis has recently attracted much attention in
DNA analysis due to its high efficiency, high throughput,
time-saving ability, easy operation, and low consumption of
samples and reagents [9]. Some commercial instruments,
such as the Agilent 2100 Bioanalyzer, Shimadzu MCE2010,
and Hitachi SV1100 and SV1210, have been developed,
which has greatly promoted the further application of
microchip electrophoresis. In microchip electrophoresis,
nucleic acid fragments are separated by capillary electro-
phoresis in a chip with microfabricated channels, with
automated detection as well as on-line data evaluation.
Microfabricated devices are forecast to be fundamental to
the postgenome era, especially in the field of genetics and
medicine [10]. However, although there are many reports
of the use of these instruments to evaluate standard DNA,
DNA ladders, PCR products, and commercially available
plasmid digests [11–20], little information is available about
their use with biological materials [11]. It is therefore
necessary to evaluate these microfabricated devices for
DNA analysis of biological materials, for example plasmid
DNA isolated from bacteria.
In the present study, we evaluated the ability of the
Hitachi SV1100 to generate consistent results for the
migration time of internal control DNA fragments of 100
and 800 bp on electrophoresis in different channels.
Furthermore, we investigated the accuracy of sizing and
quantification of endonuclease-digested plasmid DNA. The
effects of DNA concentration on the accuracy of DNA
sizing and quantification were also examined. Furthermore,
we demonstrated the reproducibility of successive electro-
phoreses of the internal controls in one channel, and
on-microchip endonuclease treatment of plasmid DNA
and sequential analysis were performed to examine the
feasibility of additional applications for DNA analysis.
Correspondence to M. Kataoka, Division of Gene Expression,
Institute for Genome Research, The University of Tokushima,
Kuramotocho 3-18, Tokushima 770-8503, Japan.
Fax: + 81 88 633 9148, Tel.: + 81 88 633 9147,
E-mail: kataoka@genome.tokushima-u.ac.jp
(Received 20 February 2004, revised 6 April 2004,
accepted 14 April 2004)
Eur. J. Biochem. 271, 2241–2247 (2004) FEBS 2004 doi:10.1111/j.1432-1033.2004.04161.x
Materials and methods
Reagents and sample preparations
Restriction endonucleases PvuII and KpnI were pur-
chased from TOYOBO (Tokyo, Japan). After digestion
of pUC118 (3162 bp) with PvuII, digested DNA was
purified by phenol/chloroform extraction, precipitated
with two vols cold ethanol, centrifuged, washed once
with 70% ethanol, allowed to dry under ambient
conditions, and resuspended in TE buffer. The concen-
tration of DNA was determined from absorbance at
260 nm by use of a Shimadzu UV160 spectrophotometer
(Shimadzu, Kyoto, Japan). PvuII-digested pUC118 DNA
fragments (2, 20, 40, 80, 160, and 320 ngÆlL
)1
)were
subjected to electrophoresis on a microchip, and the
variations of DNA sizing and concentrations were
examined. After digestion of pUC118 with endonucleases,
the size of the digested fragments was confirmed by
gel electrophoresis on 1.5% or 3.0% agarose (Takara
Shuzo, Kyoto, Japan) followed by ethidium bromide
staining.
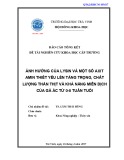
Microchip preparation
Disposable i-chips (Hitachi Electronics Co., Tokyo,
Japan), which are fabricated from polymethylmethacry-
late and comprise an interconnected network of fluid
reservoirs and microchannels, were used for all of the
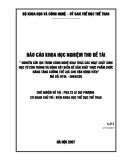
separation experiments (Fig. 1A). Three samples can be
analysed on this chip. The loading gel containing
ethidium bromide was infused from the buffer reservoir
(wells 3, 7, and 11) into the microchannels of the i-chip
by using a syringe, and wells 1, 2, 5, 6, 9, and 10 were
filled with 10 lL gel by using a pipette. Wells 4, 8, and
12 were the sample wells, and a pipette was used to fill
each well with 1.0 lL internal control, containing
2.0 ngÆlL
)1
each 100 and 800 bp dsDNA fragments as
markers for DNA sizing and quantification, and 9.0 lL
sample. Each sample can be analyzed in parallel within
4min.
Instrumentation
Experiments were performed on a Hitachi SV1100 micro-
chip electrophoresis instrument (Hitachi Electronics Co.,
Tokyo, Japan) with a light-emitting diode confocal fluor-
escence detector (excitation at 470 nm and measurement of
fluorescence at 580 nm). The instrument consists of a
bench-top device (chip reader) that communicates with a
personal computer. The
SV
1100
B
software includes data
collection, presentation, and interpretation functions. Data
is displayed as both a simulated gel image and electrophero-
grams. Electropherograms of internal controls, 100 and
800 bp DNA fragments, are shown in Fig. 1B. Sizing and
quantification of DNA fragments can also be presented in
tabular form (Fig. 1C). The chip reader contains program-
mable high voltage power supplies, each of which is
connected to a platinum electrode. These electrodes allow
the instruments to perform multiple injections and other
fluid manipulations from specific sample wells.
Microfluidic separation
All chips (i-chips), except for the analysis of DNA ladder
consisting of 100–800 bp fragments (Hitachi Electronics
Co.) and on-chip KpnI digestion of pUC118, were
prepared according to the manufacturer’s instructions
with the supplied materials (gel, internal controls). To
Fig. 1. Design of the i-chip and the data output of the assay on a
microchip. (A) The chip performs capillary electrophoresis in each of
three different channels, and three samples can be analysed on this
chip. Wells 4, 8, and 12 are sample wells. The loading gel was infused
from the buffer reservoir (wells 3, 7, and 11) into the microchannels
using a syringe, and wells 1, 2, 5, 6, 9, and 10 were filled with gel by
using a pipette. (B) Analysis of internal control, using the
SV
1100
B
software on the Hitachi SV1100 to present the results in the form of
electropherograms. (C) The corresponding analytical results for each
internal control DNA fragment were tabulated, and each peak was
estimated automatically as 100 and 800 bp in DNA size, and 2 ngÆlL
)1
in concentration, respectively.
2242 M. Kataoka et al. (Eur. J. Biochem. 271)FEBS 2004
examine variations of DNA sizing after sequential
electrophoresis in different channels and in a single
channel, 1.0 lL internal control containing 100 and
800 bp DNA fragments and 9 lL TE buffer instead of
sample was added to the sample well. The sample well
was connected through a network of channels to the
separation lane, which was used to perform the DNA
separation. For analysis of DNA ladder consisting of
100–800 bp fragments, 8 lL DNA ladder and 2 lLTE
buffer were added to the sample well and analysed. For
analysis of on-chip KpnItreatmentofPvuII-digested
pUC118 fragments, 7 lL40ngÆlL
)1
PvuII-digested
DNA, 1 lL70m
M
MgCl
2
,and1lL internal control
were added to the sample well and analysed on the
microchip. Then, 1 lLKpnI (3–10 U lL
)1
)wasaddedto
this well, and sequential analysis was performed after
5, 10, and 15 min incubation of the microchip on the
Hitachi SV 1100.
Results and discussion
Reproducibility of the electrophoresis in different
channels
The Hitachi SV1100 performs capillary electrophoresis in
each of three different channels, and three samples can be
analysed on one chip. To evaluate the reproducibility of
electrophoresis in the different channels, the migration
times in each channel were examined with the internal
controls, 100 and 800 bp DNA fragments (Table 1). The
relative standard deviations in five different channels for
the migration times of the 100 and 800 bp fragments
were 2.67% and 2.98%, respectively, indicating the
reproducibility of the electrophoresis even in different
channels.
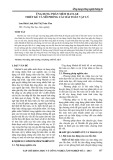
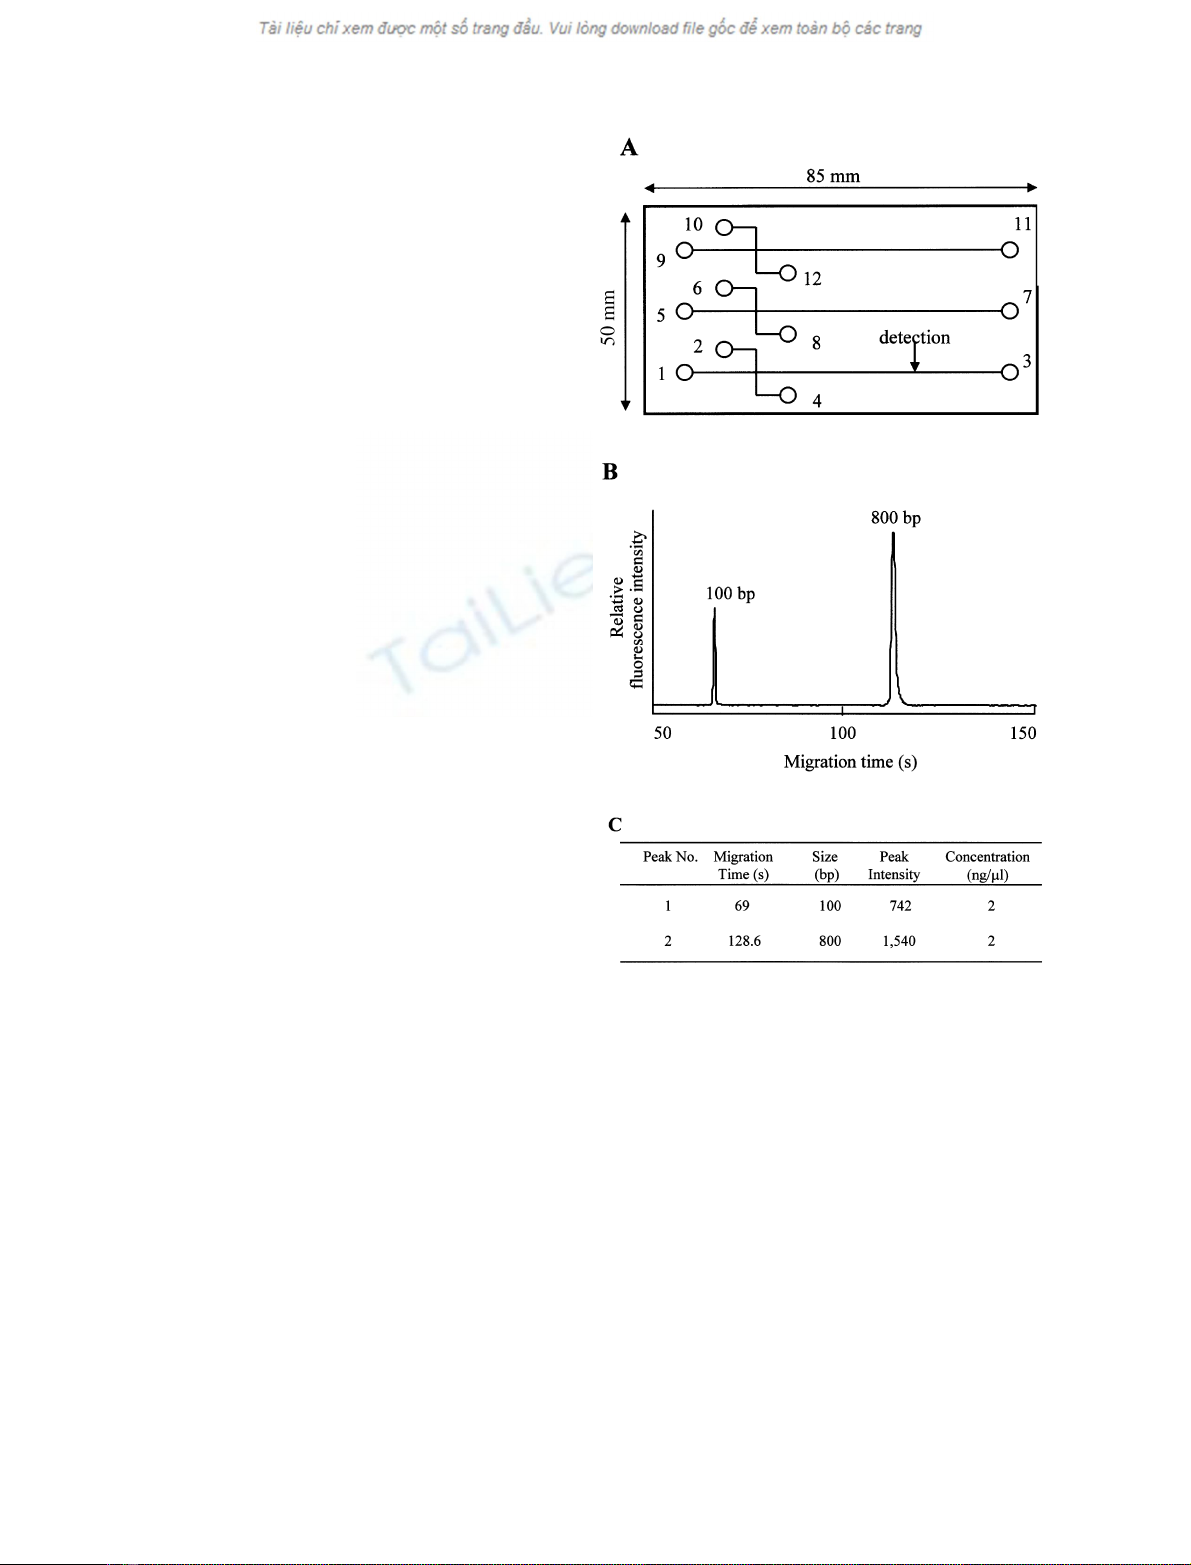
Separation of the DNA ladder
An electropherogram of DNA ladder consisting of 100–
800 bp fragments is shown in Fig. 2A. Eight peaks corres-
ponding to the 100–800 bp fragments were separated
clearly. A calibration curve was constructed by plotting
each migration time against DNA size, and a linear
relationship was obtained for fragment sizes of 100–
600 bp (Fig. 2B).
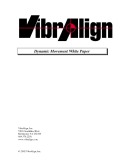
DNA sizing and quantification of
Pvu
II-digested
pUC118 fragments
PvuII digestion of pUC118 results in fragments of 322 and
2840 bp (Fig. 3A). These fragments were analysed to
evaluate the ability of the Hitachi SV1100 to generate
consistent results with respect to DNA sizing and quanti-
fication. The Hitachi SV1100 is capable of estimating DNA
size between 100 and 800 bp. The concentration of the
internal control DNA fragments measured automatically is
2.0 ngÆlL
)1
, and we used 20 ngÆlL
)1
PvuII-digested DNA
for analysis so that the concentration of the 322 bp
fragments would be 1.83 ngÆlL
)1
. Two peaks correspond-
ing to the PvuII-digested pUC118 fragments were observed
in electropherograms (Fig. 3B). As shown in Fig. 3C, the
estimated DNA size differed from the predicted size of the
322 bp DNA fragment by only 2 bp (peak no. 2), whereas
a large difference was observed in the prediction of the size
of the 2840 bp DNA fragment (peak no. 4). The Hitachi
SV1100 was able to give a more precise sizing of the 322 bp
fragment compared with the rough estimate obtained from
Table 1. Reproducibility of migration times of fragments in internal
controls in five different channels with electrophoresis. RSD, relative
standard deviation.
Channel number
Migration time (s)
100 bp 800 bp
1 69.0 130.2
2 70.8 131.4
3 71.4 132.8
4 73.4 139.8
5 73.6 136.8
Average 71.64 134.2
RSD (%) 2.67 2.98
Fig. 2. Relationship between base pair sizes and migration times of the
DNA fragments. (A) Electrophoretic separation of the 100 bp ladder
(100–800 bp) using the
SV
1100
B
software on the Hitachi SV1100.
(B) Relationship between the base pairs and migration time.
FEBS 2004 On-chip KpnI digestion and analysis of plasmid DNA (Eur. J. Biochem. 271) 2243