
Biophysical characterization of the interaction of high-density
lipoprotein (HDL) with endotoxins
Klaus Brandenburg
1
, Gudrun Ju¨ rgens
1
,Jo¨ rg Andra¨
1
, Buko Lindner
1
, Michel H. J. Koch
2
, Alfred Blume
3
and Patrick Garidel
3
1
Forschungszentrum Borstel, Biophysik, Borstel, Germany;
2
European Molecular Biology Laboratory, Hamburg Outstation, EMBL
c/o DESY, Hamburg, Germany;
3
Martin-Luther-Universita
¨t Halle/Wittenberg, Institut fu
¨r Physikalische Chemie, Halle, Germany
The interaction of bacterial endotoxins [lipopolysaccharide
(LPS) and the endotoxic principlelipid A], with high-den-
sity lipoprotein (HDL) from serum was investigated with a
variety of physical techniques and biological assays. HDL
exhibited an increase in the gel to liquid crystalline phase
transition temperature T
c
and a rigidification of the acyl
chains of the endotoxins as measured by Fourier-transform
infrared spectroscopy and differential scanning calorimetry.
The functional groups of the endotoxins interacting with
HDL are the phosphates and the diglucosamine backbone.
The finding of phosphates as target groups is in accordance
to measurements of the electrophoretic mobility showing
that the zeta potential decreases from )50 to )60 mV to
)20 mV at binding saturation. The importance of the sugar
backbone as further target structure is in accordance with the
remaining negative potential and competition experiments
with polymyxin B (PMB) and phase transition data of the
system PMB/dephosphorylated LPS. Furthermore, endo-
toxin binding to HDL influences the secondary structure of
the latter manifesting in a change from a mixed a-helical/
b-sheet structure to a predominantly a-helical structure. The
aggregate structure of the lipid A moiety of the endotoxins as
determined by small-angle X-ray scattering shows a change
of a unilamellar/inverted cubic into a multilamellar structure
in the presence of HDL. Fluorescence resonance energy
transfer data indicate an intercalation of pure HDL, and of
[LPS]–[HDL] complexes into phospholipid liposomes. Fur-
thermore, HDL may enhance the lipopolysaccharide-bind-
ing protein-induced intercalation of LPS into phospholipid
liposomes. Parallel to these observations, the LPS-induced
cytokine production of human mononuclear cells and the
reactivity in the Limulus test are strongly reduced by the
addition of HDL. These data allow to develop a model of
the [endotoxin]/[HDL] interaction.
Keywords: endotoxin conformation; high density lipopro-
teins (HDL); lipopolysaccharides; Fourier-transform infra-
red spectroscopy.
Bacterial lipopolysaccharides (LPS) belong to the most
potent stimulators of the immune system and play an
important role in the pathogenesis and manifestation of
Gram-negative infections, in general, and of septic shock,
in particular, and are thus called endotoxins. The
mechanism of endotoxin interaction with different target
cell structures are still largely unknown and only limited
data are available on the detailed mode of binding of
endotoxins to various endogenous proteins, which are
important with regard to combat invading microorgan-
isms and to transport and neutralize free endotoxin.
Among the humoral factors which are important LPS-
binding molecules are serum lipoproteins. It was sugges-
ted that sequestering of LPS by lipid particles may form
an integral part of humoral detoxification [1]. Lipo-
proteins are water-soluble complexes with a neutral core,
surrounded by a phospholipid layer that contains
cholesterol and one or more apolipoproteins.Theyserve
as ligands for cell membrane receptors, as cofactors for
enzymes, and can dock lipopolysaccharide-binding pro-
teins. They are classified as very-low density, low-density
and high-density lipoproteins (HDL) according to their
buoyant density. The primary function of these lipo-
proteins is to transport lipids, cholesterol and cholesteryl
esters in blood and the lymphatic system. HDL moreover
plays a role in binding and neutralizing bacterial
lipopolysaccharide and decrease the immunostimulatory
action of LPS. In particular, a drastic reduction of the
LPS-induced cytokine production [tumor necrosis factor-
a, interleukin (IL)-1, IL-6] due to HDL binding was
observed [2–4]. Furthermore, it was demonstrated that
lipopolysaccharide-binding protein (LBP) increased the
uptake of LPS by reconstituted HDL (R-HDL) particles
derived from either LPS micellesor LPS–sCD14 com-
plexes, and in this process LPS molecules are exchanged
with phospholipids [5].
Here, we report on the interaction of HDL with deep
rough mutant LPS Re and the endotoxic principle, lipid
A applying a variety of physical and biological techniques.
With Fourier-transform infrared spectroscopy (FTIR)
the phase transition behavior of the acyl chains of the
Correspondence to K. Brandenburg, Forschungszentrum Borstel,
Biophysik, Parkallee 10, D-23845 Borstel, Germany.
Fax: +49 4537 188632, Tel.: + 49 4537 188235,
E-mail: kbranden@fz-borstel.de
Abbreviations: ATR, attenuated total reflectance; FTIR, Fourier-
transform infrared spectroscopy; HDL, high-density lipoprotein;
IL, interleukin; LAL, Limulus amebocyte lysate; LBP, lipo-
polysaccharide-binding protein; LPS, lipopolysaccharide; PMB,
polymyxin B; PtdSer, phosphatidylserine.
(Received 2 September 2002, revised 18 October 2002,
accepted 24 October 2002)
Eur. J. Biochem. 269, 5972–5981 (2002) FEBS 2002 doi:10.1046/j.1432-1033.2002.03333.x

endotoxins in absence and presence of HDL as well as
the effect of HDL on functional groups of the endotoxins
were observed for the latter, using the attenuated total
reflectance (ATR) method. To obtain information about
the phase transition enthalpy changes of the endotoxins,
differential scanning calorimetry in the absence and
presence of HDL was carried out. Also, with FTIR the
influence of endotoxin binding on the secondary structure
of the protein part of HDL, apolipoprotein A-I (apoA-I)
was observed. The effect of HDL on the surface charge of
the endotoxin aggregates was studied by applying zeta
potential measurements, which also enabled an estimate
for the binding saturation to be made. The aggregate
structure and, with that, the conformation of the lipid A
part of LPS was studied by small-angle X-ray diffraction.
With fluorescence resonance energy transfer experiments,
information about the influence of HDL on the inter-
calation of LPS and LBP, and the intercalation of the
lipoprotein itself into phospholipid target membranes
could be given. Finally, in biological experiments the
ability of the endotoxin and [endotoxin]/[HDL] complexes
to induce cytokine production in mononuclear cells and to
activate the Limulus amebocyte lysate (LAL) clotting
cascade was measured. Thus, it was possible to charac-
terize the binding of HDL to the endotoxins profoundly
and to get insight into the mechanisms of the reduction of
the LPS-induced cytokine production in human mono-
nuclear cells.
MATERIALS AND METHODS
Lipids and reagents
Lipopolysaccharide from the deep rough mutant Re
Salmonella minnesota (R595) was extracted by the phenol/
chloroform/petrol ether method [6] from bacteria grown at
37 C, purified, and lyophilized. Free lipid A was isolated by
acetate buffer treatment of LPS R595. After isolation, the
resulting lipid A was purified and converted to its triethyl-
amine salt.
The known chemical structure of lipid A from LPS R595
was checked by the analysis of the amount of glucosamine,
total and organic phosphate, and the distribution of the fatty
acid residues applying standard procedures. The amount
of 2-keto-3-deoxyoctonate never exceeded 5 weight %.
Dephospho-LPS Re was prepared from LPS deep rough
mutant F515 from Escherichia coli byHFtreatmentatlow
temperature (4 C). The detailed procedure is described
elsewhere [7].
High-density lipoprotein (HDL) from human plasma was
purchased from Fluka (Deisenhofen, Germany). It was
essentially free of contaminants, in particular of LPS, which
was examined by applying the Limulus test (see later).
Lipopolysaccharide-binding protein (LBP) was a kind
gift of S. F. Carroll (XOMA corporation, Berkeley, CA,
USA).
Sample preparation
The lipid samples were usually prepared as aqueous disper-
sions at high buffer content, i.e. above 60% using 20 m
M
Hepes (pH 7). For this, the lipids were suspended directly in
buffer, sonicated and temperature-cycled several times
between5and70C and then stored for at least 12 h
before measurement. For the elucidation of the protein
secondary structure in the absence and presence of endo-
toxins, HDL was prepared in buffer made either from H
2
O
or D
2
O incubated at 37 C for 30 min, and lipid dispersions
prepared as described above were added in appropriate
amounts, and further incubated at 37 C for 15 min.
Afterwards, 10 lL of these dispersions were spread on a
CaF
2
infrared window, and the excess water was evaporated
slowly at 37 C.
FTIR spectroscopy
The infrared spectroscopic measurements were performed
on a 5-DX FTIR spectrometer (Nicolet Instruments,
Madison, WI, USA) and on an IFS-55 spectrometer
(Bruker, Karlsruhe, Germany). The lipid samples were
placed in a CaF
2
cuvette with a 12.5-lm Teflon spacer.
Temperature-scans were performed automatically between
10 and 70 C with a heating-rate of 0.6 CÆmin
)1
.Every
3C, 50 interferograms were accumulated, apodized, Fou-
rier transformed and converted to absorbance spectra. For
strong absorption bands, the band parameters (peak
position, band width, and intensity) were evaluated from
the original spectra, if necessary after subtraction of the
strong water bands.
In the case of overlapping bands, in particular for the
analysis of amide I-vibration mode, curve fitting was
applied using a modified version of the
CURFIT
program
obtained by D. Moffat, NRC, Ottawa, Canada. An
estimate of the number of band components was obtained
from deconvolution of the spectra [8] and the curve was
fitted to the original spectra after subtraction of base lines
resulting from neighboring bands. The bandshapes of the
single components are superpositions of Gaussian and
Lorentzian. Best fits were obtained by assuming a Gauss
fraction of 0.55–0.60. The precision of the curve fit
procedure is approximately 3%.
ATR
The lipids were prepared as oriented thin multilayers as
described previously [9] by spreading a 1-m
M
lipid suspen-
sion, which was temperature-cycled between 5 and 70 C
several times prior to spreading, in Hepes buffer on a ZnSe
ATR crystal and evaporating the excess water by slow
periodic movement under a nitrogen stream at room
temperature. The lipid sample was placed in a closed
cuvette, and the air above the sample was saturated with
water vapor to maintain full hydration. Infrared ATR
spectra were recorded with a mercury–cadmium–telluride
detector with a scan number of 1000 at a resolution of
2cm
)1
. The measurements were performed at 26 C, the
intrinsic instrument temperature, in some cases also at
37 C.
Differential scanning calorimetry
LPS was dispersed in buffer at a concentration of
1mgÆmL
)1
. A liposomal lipid dispersion was obtained by
sonication for 10 min at 40 C. After cooling to room
temperature, a defined amount of HDL was added to 1 mL
lipid dispersion and the sample was gently vortexed until
FEBS 2002 HDL interaction with endotoxins (Eur. J. Biochem. 269) 5973

HDL was completely dissolved [9]. Differential scanning
calorimetry measurements were performed with a MicroCal
VP scanning calorimeter (MicroCal, Inc., Northampton,
MA, USA). The heating and cooling rate was 1 CÆmin
)1
.
Heating and cooling curves were measured in the tempera-
ture interval from 10 to 100 C. Three consecutive heating
and cooling scans were measured [10].
X-ray diffraction
X-ray diffraction measurements were performed at the
European Molecular Biology Laboratory (EMBL) outsta-
tion at the Hamburg synchrotron radiation facility HASY-
LAB using the double-focusing monochromator-mirror
camera X33 [11]. Diffraction patterns in the range of the
scattering vector 0.07 < s<1nm
)1
(s¼2sinhÆk
)1
,2h
scattering angle and kthe wavelength ¼0.15 nm) were
recorded at 40 C with exposure times of 2 or 3 min using a
linear detector with delay line readout [12]. The s-axis was
calibrated with tripalmitate, which has a periodicity of
4.06 nm at room temperature. Details of the data acquisi-
tion and evaluation system can be found elsewhere [13]. The
diffraction patterns were evaluated as described previously
[14] assigning the spacing ratios of the main scattering
maxima to defined 3D structures. The lamellar and cubic
structures are most relevant here. They are characterized by
the following features: (a) lamellar: The reflections are
grouped in equidistant ratios, i.e. 1, 1/2, 1/3, 1/4, etc. of the
lamellar repeat distance dL; (b) cubic: The different space
groups of these nonlamellar 3D structures differ in the
ratio of their spacing. The relation between reciprocal
spacing s
hkl
¼1/d
hkl
and lattice constant a is s
hkl
¼
[(h
2
+k
2
+l
2
)/a]
1/2
, where hkl are Miller indices of the
corresponding set of plane.
Zeta potential
Zeta potentials were determined with a Zeta-Sizer 4
(Malvern Instr., Herrsching, Germany) at a scattering angle
of 90from the electrophoretic mobility by laser-Doppler
anemometry as described earlier [15]. The zeta potential was
calculated according to the Helmholtz-Smoluchovski equa-
tion from the mobility of the aggregates in a driving electric
field of 19.2 VÆcm
)1
. It was determined for the endotoxins
(0.5 m
M
) at different HDL concentrations.
Isothermal titration calorimetry
Microcalorimetric experiments of HDL-binding to endo-
toxins were performed on an MCS isothermal titration
calorimeter (Microcal Inc., Northampton, MA, USA). The
endotoxin samples at a concentration of 0.25 mgÆmL
)1
,
prepared as described above, were filled into the microca-
lorimetric cell (volume 1.3 mL), and HDL at concentrations
up to 12 mgÆmL
)1
were loaded into the syringe compart-
ment, both after thorough degassing of the suspensions.
After temperature equilibration, the HDL was titrated in
5lL portions every 10 min into the endotoxin-containing
cell, and the heat for each injection measured by the ITC
instrument was plotted vs. time. The total heat signal from
each experiment was subsequently determined by integra-
ting the individual peaks and plotted against the [HDL]/
[endotoxin] weight ratio.
Fluorescence resonance energy transfer
The fluorescence resonance energy transfer assay was per-
formed as described earlier [16,17]. Briefly, phospholipid
liposomes from phosphatidylserine (PtdSer) were doubly
labeled with the fluorescent dyes N-(7-nitrobenz-2-oxa-1,3-
diazol-4yl)-phosphatidylethanolamine and N-(lissamine
rhodamine B sulfonyl)-phosphatidylethanolamine (Rh-PE)
(Molecular Probes, Eugene, OR, USA). Intercalation of
unlabeled molecules into the doubly labeled liposomes leads
to probe dilution and thus inducing a lower fluorescence
resonance energy transfer efficiency: the emission intensity
of the donor increases and that of the acceptor decreases
(for clarity, only the quotient of the donor and acceptor
emission intensity is shown here).
In all experiments, doubly labeled PtdSer liposomes were
prepared and after 50, 100, and 150 s recombinant LBP,
LPS, and HDL were added in different order, and the NBD
donor fluorescence intensity at 531 nm was monitored for at
least 300 s. LBP, HDL and LPS were added in the weight
ratios 0.5 : 1 : 1.
Stimulation of human mononuclear cells by LPS Re
For an examination of the cytokine-inducing capacity of the
[endotoxin]/[HDL] mixtures, human mononuclear cells
were stimulated with the latter and the IL-6 production of
the cells was determined in the supernatant.
Mononuclear cells were isolated from heparinized (20
IEÆmL
)1
) blood taken from healthy donors and processed
directly by mixing with an equal volume of Hank’s balanced
solution and centrifugation on a Ficoll density gradient for
40 min (21 C, 500 g). The layer of mononuclear cells was
collected and washed twice in Hank’s medium and once in
serum-free RPMI 1640 containing 2 m
ML
-glutamine,
100 UÆmL
)1
penicillin, and 100 lgÆmL
)1
streptomycin. The
cells were resuspended in serum-free medium and their
number was equilibrated at 5 ·10
6
cellsÆmL
)1
. For stimu-
lation, 200 lLÆwell
)1
mononuclear cells (5 ·10
6
cellsÆmL
)1
)
were transferred into 96-well culture plates. The stimuli were
seriallydilutedinserum-freeRPMI1640andaddedtothe
cultures at 20 lL per well. The cultures were incubated for 4
hat37 C under 5% CO
2
. Supernatants were collected after
centrifugation of the culture plates for 10 min at 400 g and
stored at )20 C until determination of cytokine content.
Immunological determination of IL-6 in the cell super-
natant was performed in a sandwich-ELISA as described
elsewhere [18]. Ninety-six-well plates (Greiner, Solingen,
Germany) were coated with a monoclonal (mouse) human
IL-6 antibody (clone 16 from Intex AG, Switzerland). Cell
culture supernatants and the standard (recombinant human
IL-6, Intex) were diluted with buffer. After exposure to
appropriately diluted test samples and serial dilutions of
standard rIL-6, the plates were exposed to peroxidase-
conjugated (sheep) anti-human IL-6 antibody. The plates
were shaken 16–24 h at room temperature (21–24 C) and
washed six times in distilled water to remove the antibodies.
Subsequently the color reaction was started by addition
of tetramethylbenzidine/H
2
O
2
in alcoholic solution and
stopped after 5–15 min by addition of 0.5 molÆL
)1
sulfuric
acid. In the color reaction, the substrate is cleaved
enzymatically, and the product was measured photometri-
cally on an
ELISA
reader (Rainbow, Tecan, Crailsham,
5974 K. Brandenburg et al. (Eur. J. Biochem. 269)FEBS 2002
Germany) at a wavelength of 450 nm and the values were
related to the standard. IL-6 was determined in duplicate at
two different dilutions and the values were averaged.
Determination of endotoxin activity by the
chromogenic
Limulus
test
Endotoxin activity of [LPS]–[HDL] mixtures at concentra-
tions between 10 lgÆmL
)1
and 10 pgÆmL
)1
was determined
by a quantitative kinetic assay based on the reactivity of
Gram-negative endotoxin with LAL [19], using test kits
from LAL Coamatic Chromo-LAL K (Chromogenix,
Haemochrom). The standard endotoxin used in this test
was from E. coli (O55:B5), and 10 EUÆmL
)1
corresponds to
1ngÆmL
)1
. In this assay, saturation occurs at 125 endotoxin
units EUÆmL
)1
, and the resolution limit is £0.1 EUÆmL
)1
(maximum value for ultrapure water from embryo-transfer,
Sigma).
RESULTS
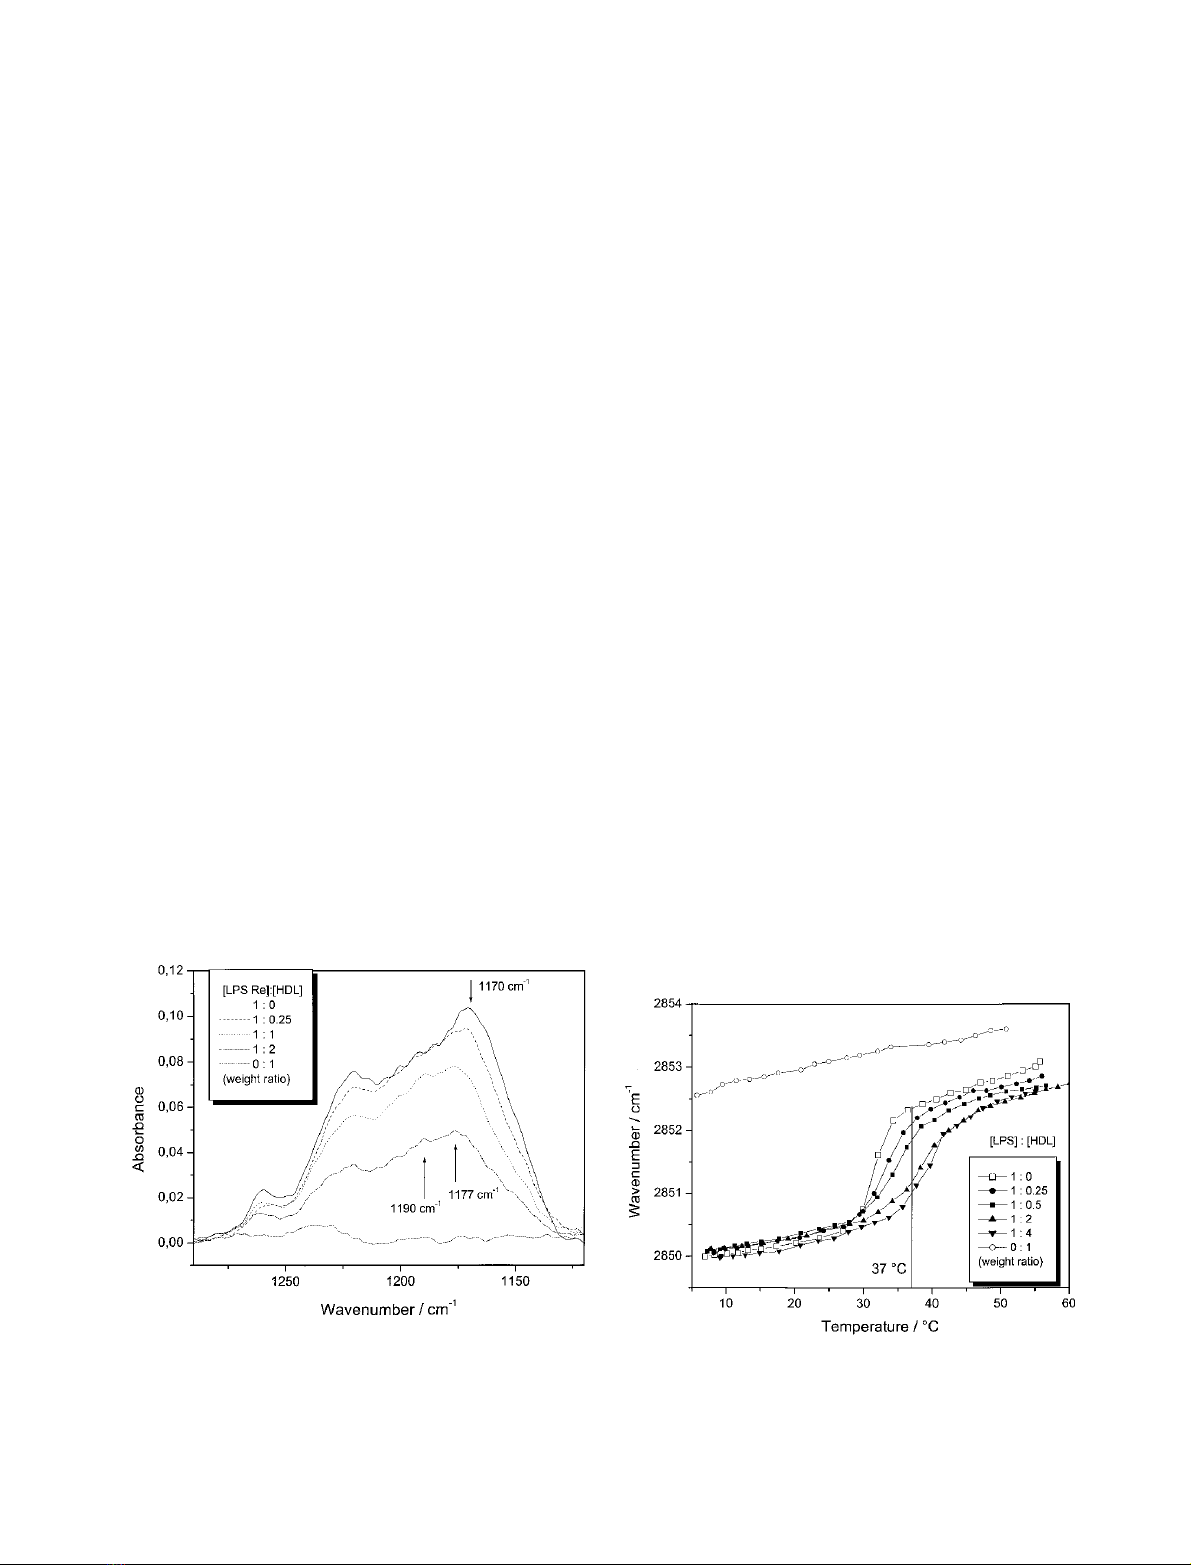
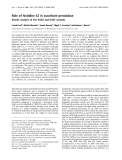
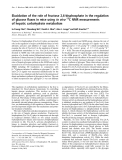
Measurements of hydrated LPS–HDL complexes
Infrared-ATR experiments were performed with hydrated
LPS multilayers in the absence and presence of different
HDL concentrations. In these measurements, the LPS
concentration was held constant and the spectra were
normalized by taking the band intensity of the symmetric
stretching vibration m
s
(CH
2
) as standard. In Fig. 1, a change
in the band contours in the range of the two phosphate and
the diglucosamine vibrations, m
as
(PO
2
) 1270–1250 cm
)1
,
and m
as
(PO
2
)
hydr.
1230–1220 cm
)1
and m
as
(diglucosamine)
1180–1150 cm
)1
, can be seen; the addition of HDL leads to
an intensity decrease in the band contours proportional to
the HDL concentration. From Fig. 1 it can be taken that
especially the intensity of the band component around
1190 cm
)1
increases as compared with that at lower
wavenumbers and becomes sharper. Additionally, the
component at 1170 cm
)1
for pure LPS is shifted to
approximately 1177 cm
)1
in the presence of HDL. These
results indicate that (i) besides the phosphate groups, the
sugar diglucosamine part in lipid A are also binding-sites for
HDL, and (ii) these vibrational bands are immobilized due
to HDL binding.
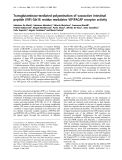
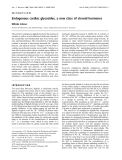
Gel to liquid crystalline (b«a) phase behavior
The b«agel to liquid crystalline acyl chain melting behavior
was investigated with FTIR by evaluating the peak position
of the symmetric stretching vibration m
s
(CH
2
), which is a
measure of acyl chain order. HDL induces a slight
rigidification in particular in the liquid crystalline (a) phase
of the acyl chains of LPS Re, as deduced from a decrease in
wavenumber values at a given temperature, and a significant
increase in the phase transition T
c
from 31 C for pure LPS
to 40 C for an [LPS]–[HDL] mixture at a weight ratio of
1 : 4. Also, pure HDL exhibits a signal in this wavenumber
range due to its phospholipid moiety. This, however, is
much higher with an only weak temperature dependence in
the wavenumber range 2852.5–2853.5 cm
)1
(Fig. 2). These
values are indicative of acyl chains with a large amount of
gauche conformers. Importantly, the interaction of HDL
with LPS leads to a reduction of the wavenumber by more
than one unit (see vertical line at 37 C), i.e. a strong
rigidification of the lipid A acyl chains.
This holds true also for lipid A even although higher
amounts of HDL are required to induce a significant
increase in T
c
. Thus, at a weight ratio[lipid A]/[HDL] 1 : 3
the phase transition at T
c
¼45 C of pure lipid A is shifted
to 50 C (data not shown). This observation reflects the
different number of negative charges and monosaccharide
units (LPS Re has four negative charges and four sugar
units, lipid A two of each) which may be connected with
different conformations of the molecules.
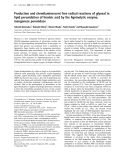
Differential scanning calorimetry measurements of the
interaction of LPS with HDL (Fig. 3) shows for pure LPS a
phase transition in accordance to that observed in Fig. 2.
Fig. 1. Infrared-ATR spectra in the range of the antisymmetric
stretching vibration of the negatively charged phosphate groups
m
as
(PO
2–
)1210–1260 cm
)1
) and the diglucosamine ring vibration (see
arrows) of LPS at different [LPS]/[HDL] weight ratios. The spectra
were normalized by taking the band intensity of the symmetric
stretching vibration of the methylene groups m
s
(CH
2
)asstandard.
Fig. 2. Peak position of the symmetric stretching vibration of the
methylene groups m
s
(CH
2
) vs. temperature for a 10-m
M
LPS Re pre-
paration at different HDL concentrations. In the gel (b) phase of the acyl
chains, the peak position lies at 2850 cm
)1
, in the liquid crystalline (a)
phase at 2852.5 cm
)1
.
FEBS 2002 HDL interaction with endotoxins (Eur. J. Biochem. 269) 5975
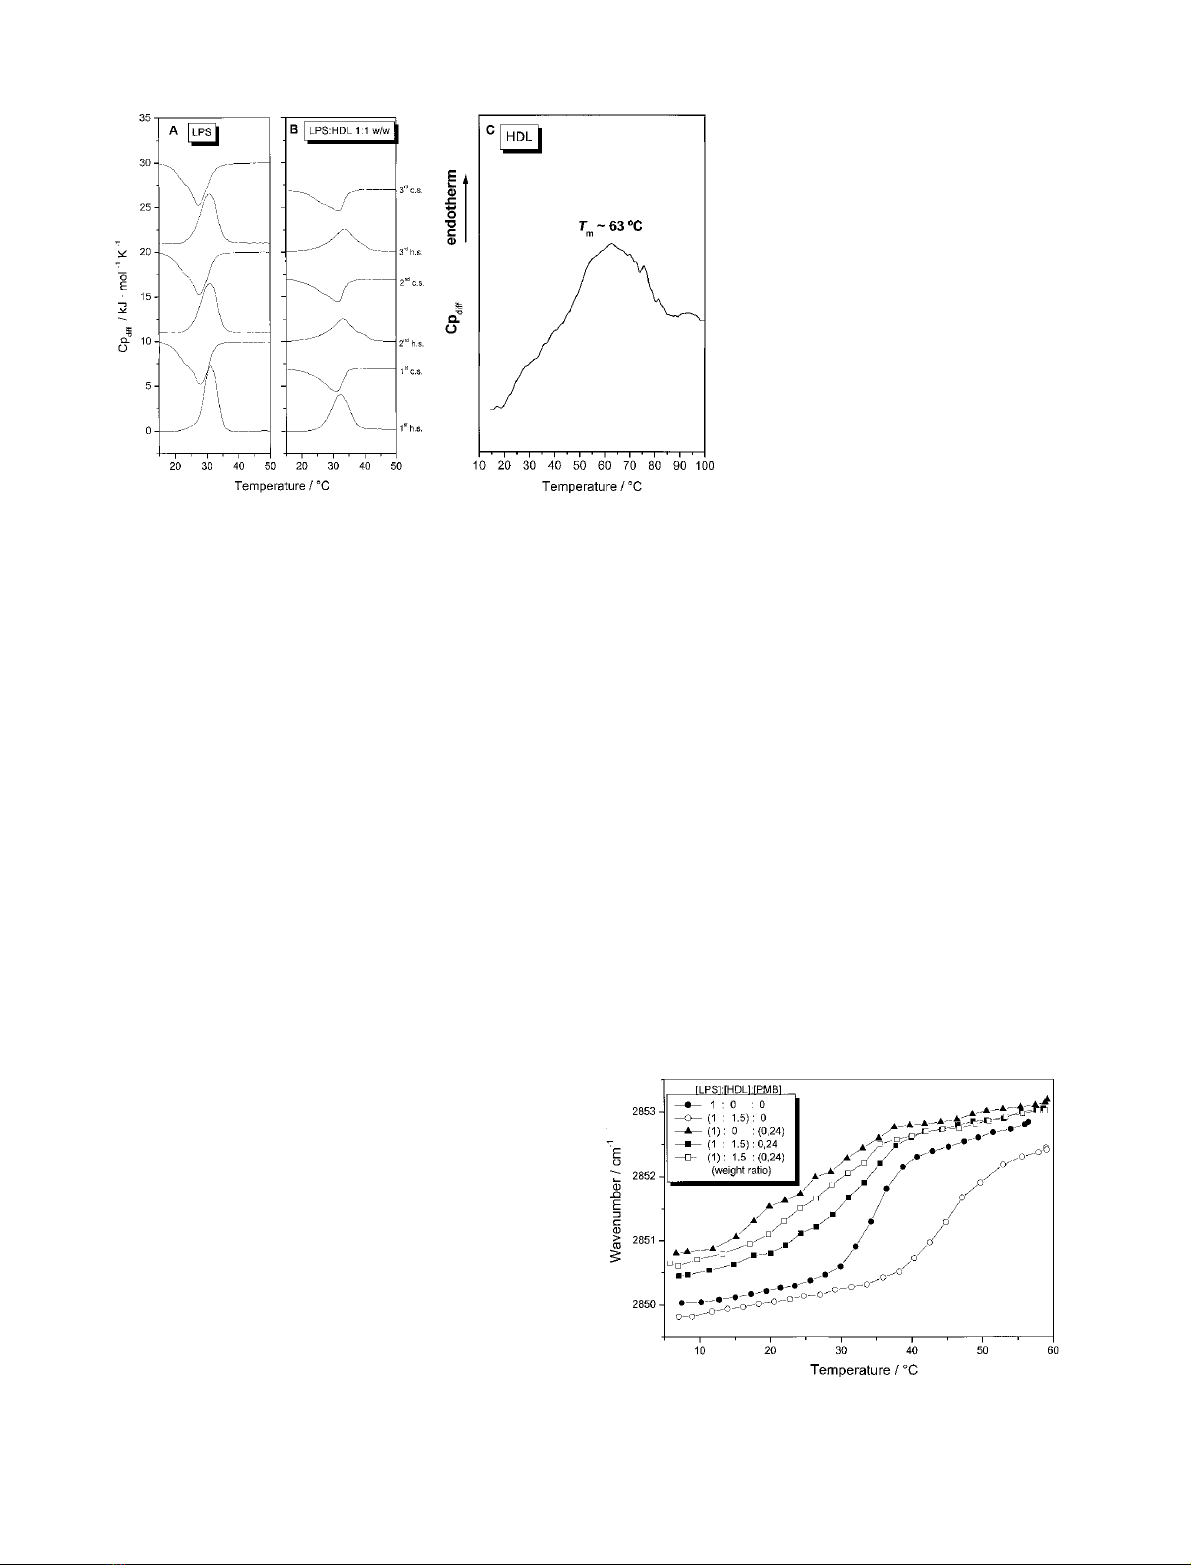
The phase transition in the first heating scan is characterized
by a coexistence region between 22 and 37 C(T
1/2
¼
4.5 C) and the maximum of the heat capacity curve is
found at 31 CwithDH
C
¼38 kJÆmol
)1
. The succeeding
cooling scan reveals only a very small hysteresis for the
re-crystallization of the acyl chains from the liquid crystal-
line to the gel phase. The maximum of the heat capacity
curve of the 1st cooling scan is observed at T¼28 Cwith
DH¼)39 kJÆmol
)1
. A shoulder at 23 C is observed in
the first and succeeding cooling scan. The thermograms of
the succeeding heating scan are slightly broader compared
with the 1st heating scan (Fig. 3A).
HDL was added to LPS at different concentrations
{[LPS]/[HDL] 1 : 0.25, 1 : 0.45, 1 : 0.6 and 1 : 1 (w/w)}. In
Fig. 3(B) representative thermograms for the sample at a
LPS/HDL 1 : 1 (w/w) ratio are plotted. The phase trans-
ition temperature of LPS is shifted from 31 Cto33 C,
the half-width of the phase transition is increased
(T
1/2
¼7C) and the phase transition enthalpy is decreased
by 22%. The presence of HDL induces a broadening of
the coexistence range of the phase transition, especially for
the offset temperature which is shifted above 42 C. The
phase transition as derived from the IR spectra from the
temperature dependence of m
s
(CH
2
) of the [LPS]/[HDL]
1 : 0.5 system revealed similar data: T
c
¼34 Cand
T
1/2
¼8.5 C. The heat-capacity curve of LPS/HDL ratio
develops a shoulder starting at 20 C in the gel phase
indicating that HDL interacts with the gel phase LPS. This
is observed for all four investigated LPS/HDL concentra-
tion ratios. A second peak with a very small enthalpy
contribution at higher temperature (T63 C, DH¼
8kJÆmol
)1)
corresponds to the denaturation peak of
pure HDL, because the maximum of the heat capacity curve
of pure HDL is observed at 63 C (Fig. 3C). Thus,
additional HDL does not interact with the LPS membrane
but acts like pure protein. Heating of the sample above
70 C leads to complete and irreversible denaturation of
HDL (data not shown).
Parallel to the measurements of LPS Re, differential
scanning calorimetry measurements of the phase behavior
of lipid A indicated a similar increase in T
c
,andthe
evaluation of the phase transition enthalpy (peak area)
showed a value of 14 kJÆmol
)1
which in the presence of
HDL is reduced to 12 kJÆmol
)1
, i.e. a reduction by 15%.
These data indicate that the binding of HDL to LPS and
lipid A leads to a disturbance of the hydrophobic moiety.
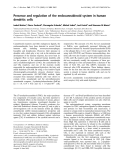
Inhibition experiments were performed with the polycat-
ionic peptide polymyxin B (PMB), which binds strongly to
the lipid A phosphates [20]. At a [LPS]/[PMB] weight ratio
of 1 : 0.24, PMB alone causes a drastic fluidization of LPS,
while HDL leads to a rigidification of LPS at a weight ratio
of [LPS]/[HDL] 1 : 1.5 (Fig. 4). Addition of HDL to the
preincubated [LPS]–[PMB] complex leads to almost the
same result as without HDL, and addition of PMB to
preincubated [LPS]–[HDL] causes a slightly attenuated
fluidizing effect as compared with LPS with PMB alone.
PMB, which binds much stronger to the LPS phosphates
than HDL, may displace HDL molecules from their binding
site, the lipid A phosphates.
These results are complemented by the data of the
dephospho-LPS Re and HDL systems (Fig. 5). Dephos-
pho-LPS Re has a T
c
of 45 C,andinthecaseof
phosphates as the primary binding site no change of the
phase behavior of dephospho-LPS Re would be expected.
However, addition of HDL causes a fluidization parti-
cularly in the gel phase and in the transition range at a
Fig. 3. Differential scanning calorimetry heat
capacity curves of pure LPS Re (A), a mixture
of [LPS]/[HDL] at 1.1 : 1 w/w (B), and for pure
HDL (C). Heating and cooling curves were
measured in the temperature interval 10–
100 C. Three consecutive heating and cooling
scans are presented (A,B) (h.s. heating-scan,
c.s. cooling scan) and first heating scan (C).
Fig. 4. Peak position of the symmetric stretching vibration of the
methylene groups m
s
(CH
2
) vs. temperature in competition experiments
with LPS Re, PMB and HDL in different sequences.
5976 K. Brandenburg et al. (Eur. J. Biochem. 269)FEBS 2002


%20--%3e%3cdefs%3e%3cstyle%3e%20.st0%20{%20fill:%20%23fff;%20}%20.st1%20{%20fill:%20%237800fa;%20}%20%3c/style%3e%3c/defs%3e%3cpath%20class='st1'%20d='M117.78,12.18H43.11c2.9,3.47,4.65,7.94,4.65,12.82,0,5.6-2.3,10.66-6.01,14.29h76.02l7.22-13.56-7.22-13.56Z'/%3e%3cg%3e%3cpath%20class='st0'%20d='M53.58,26.17h-.59v-1.46h.59v-4.96h2.83c1.78,0,2.67.94,2.67,2.82v5.76c0,1.87-.89,2.81-2.67,2.81h-2.83v-4.96ZM55.36,21.37v3.34h1.1v1.46h-1.1v3.34h1.01c.61,0,.91-.37.91-1.1v-5.93c0-.74-.3-1.1-.91-1.1h-1.01Z'/%3e%3cpath%20class='st0'%20d='M65.99,31.14h-1.8l-.31-2.07h-2.19l-.31,2.07h-1.64l1.82-11.39h2.62l1.82,11.39ZM65.28,18.04c-.25.46-.51.77-.75.94-.21.15-.47.22-.79.22-.26,0-.57-.07-.92-.22l-.38-.15c-.14-.05-.26-.07-.37-.07-.3,0-.53.18-.71.54l-.91-.68c.25-.46.51-.77.75-.94.21-.14.48-.21.79-.21.26,0,.57.07.92.21l.38.15c.14.05.26.07.37.07.3,0,.53-.18.71-.54l.91.68ZM61.91,27.52h1.73l-.87-5.76-.87,5.76Z'/%3e%3cpath%20class='st0'%20d='M74.53,26.89v1.52c0,1.91-.89,2.86-2.67,2.86s-2.67-.95-2.67-2.86v-5.93c0-1.91.89-2.86,2.67-2.86s2.67.95,2.67,2.86v1.11h-1.69v-1.22c0-.75-.31-1.12-.93-1.12s-.93.37-.93,1.12v6.15c0,.74.31,1.11.93,1.11s.93-.37.93-1.11v-1.63h1.69Z'/%3e%3cpath%20class='st0'%20d='M81.4,31.14h-1.8l-.31-2.07h-2.19l-.31,2.07h-1.64l1.82-11.39h2.62l1.82,11.39ZM75.9,19.2l1.52-1.91h1.71l1.51,1.91h-1.61l-.76-.95-.75.95h-1.61ZM77.32,27.52h1.73l-.87-5.76-.87,5.76ZM83.1,15.99l-1.76,1.91h-1.26l1.17-1.91h1.86Z'/%3e%3cpath%20class='st0'%20d='M84.86,19.75c1.78,0,2.67.94,2.67,2.82v1.48c0,1.87-.89,2.81-2.67,2.81h-.85v4.28h-1.79v-11.39h2.64ZM84.01,21.37v3.86h.85c.58,0,.87-.36.87-1.08v-1.71c0-.71-.29-1.07-.87-1.07h-.85Z'/%3e%3cpath%20class='st0'%20d='M93.51,19.75c1.78,0,2.67.94,2.67,2.82v1.48c0,1.87-.89,2.81-2.67,2.81h-.85v4.28h-1.79v-11.39h2.64ZM92.66,21.37v3.86h.85c.58,0,.87-.36.87-1.08v-1.71c0-.71-.29-1.07-.87-1.07h-.85Z'/%3e%3cpath%20class='st0'%20d='M98.8,31.14h-1.79v-11.39h1.79v4.88h2.03v-4.88h1.83v11.39h-1.83v-4.88h-2.03v4.88Z'/%3e%3cpath%20class='st0'%20d='M105.36,24.55h2.46v1.62h-2.46v3.34h3.09v1.63h-4.88v-11.39h4.88v1.63h-3.09v3.18ZM108.17,17.29l-1.76,1.91h-1.26l1.17-1.91h1.86Z'/%3e%3cpath%20class='st0'%20d='M112.2,19.75c1.78,0,2.67.94,2.67,2.82v1.48c0,1.87-.89,2.81-2.67,2.81h-.85v4.28h-1.79v-11.39h2.64ZM111.35,21.37v3.86h.85c.58,0,.87-.36.87-1.08v-1.71c0-.71-.29-1.07-.87-1.07h-.85Z'/%3e%3c/g%3e%3ccircle%20class='st1'%20cx='25'%20cy='25'%20r='20'/%3e%3cpath%20class='st0'%20d='M32.78,19.27c2.92,0,4.43,2.55,5.28,5.33l.71,2.17c.14.38-.33.75-.71.75h-5.61c.19-.33.24-.71.09-1.08l-.75-2.45c-.43-1.32-.99-2.64-1.79-3.77.75-.57,1.65-.94,2.78-.94h0ZM25,18.38c3.25,0,4.9,2.78,5.89,5.89l.76,2.45c.14.42-.33.8-.8.8h-11.69c-.42,0-.94-.38-.8-.8l.75-2.45c.99-3.11,2.64-5.89,5.89-5.89h0ZM25,11.35c1.74,0,3.11,1.37,3.11,3.11s-1.37,3.11-3.11,3.11-3.11-1.41-3.11-3.11,1.41-3.11,3.11-3.11h0ZM17.27,19.27c1.08,0,1.98.38,2.73.94-.8,1.13-1.37,2.45-1.74,3.77l-.8,2.45c-.14.38-.05.75.09,1.08h-5.56c-.42,0-.9-.38-.75-.75l.71-2.17c.9-2.78,2.41-5.33,5.33-5.33h0ZM17.27,12.91c1.51,0,2.78,1.27,2.78,2.83s-1.27,2.83-2.78,2.83-2.83-1.27-2.83-2.83,1.27-2.83,2.83-2.83h0ZM32.78,12.91c1.56,0,2.78,1.27,2.78,2.83s-1.23,2.83-2.78,2.83-2.83-1.27-2.83-2.83,1.27-2.83,2.83-2.83h0ZM27.07,28.56v.09c0,.57-.24,1.08-.61,1.46h0v.05c-.38.33-.9.57-1.46.57s-1.08-.24-1.46-.61h0c-.38-.38-.61-.9-.61-1.46v-.09h1.41v.09c0,.19.05.38.19.47v.05c.09.09.28.19.47.19s.38-.09.47-.19v-.05c.14-.09.24-.28.24-.47t-.05-.09h1.41ZM30.99,28.56v.09c0,1.65-.66,3.16-1.74,4.24-1.08,1.08-2.59,1.79-4.24,1.79s-3.16-.71-4.24-1.79l-.05-.05c-1.04-1.08-1.7-2.55-1.7-4.2v-.09h1.41v.09c0,1.27.47,2.4,1.27,3.25h.05c.85.85,1.98,1.37,3.25,1.37s2.4-.52,3.25-1.37c.85-.8,1.37-1.98,1.37-3.25v-.09h1.37ZM34.99,28.56v.09c0,2.78-1.13,5.28-2.92,7.07-1.79,1.79-4.29,2.92-7.07,2.92s-5.23-1.13-7.07-2.92c-1.79-1.79-2.92-4.29-2.92-7.07v-.09h1.41v.09c0,2.4.94,4.53,2.5,6.08,1.56,1.56,3.72,2.5,6.08,2.5s4.52-.94,6.08-2.5c1.56-1.56,2.5-3.68,2.5-6.08v-.09h1.41Z'/%3e%3c/svg%3e)