
Presence and regulation of the endocannabinoid system in human
dendritic cells
Isabel Matias
1
, Pierre Pochard
2
, Pierangelo Orlando
3
, Michel Salzet
4
, Joel Pestel
2
and Vincenzo Di Marzo
1
1
Endocannabinoid Research Group,
1
Istituto di Chimica Biomolecolare, Consiglio Nazionale delle Ricerche,
Comprensorio Olivetti, Pozzuoli (Napoli), Italy;
2
Inflammatory Reaction and Allergic diseases Department, INSERM unit,
Pasteur Institute, Lille, France;
3
Istituto di Biochimica delle Proteine ed Enzimologia, Consiglio Nazionale delle Ricerche,
Comprensorio Olivetti, Pozzuoli (Napoli), Italy;
4
Laboratoire de Neuroimmunite
´des Anne
´lides, UMR 8017 CNRS, Universite
´
des Sciences et Technologies de Lille, Villeneuve d’Ascq, France
Cannabinoid receptors and their endogenous ligands, the
endocannabinoids, have been detected in several blood
immune cells, including monocytes/macrophages,
basophils and lymphocytes. However, their presence in
dendritic cells, which play a key role in the initiation and
development of the immune response, has never been in-
vestigated. Here we have analyzed human dendritic cells
for the presence of the endocannabinoids, anandamide
and 2-arachidonoylglycerol (2-AG), the cannabinoid CB
1
and CB
2
receptors, and one of the enzymes mostly
responsible for endocannabinoid hydrolysis, the fatty acid
amide hydrolase (FAAH). By using a very sensitive liquid
chromatography-atmospheric pressure chemical ioniza-
tion-mass spectrometric (LC-APCI-MS) method, lipids
extracted from immature dendritic cells were shown to
contain 2-AG, anandamide and the anti-inflammatory
anandamide congener, N-palmitoylethanolamine (PalEtn)
(2.1 ± 1.0, 0.14 ± 0.02 and 8.2 ± 3.9 pmolÆ10
)7
cells,
respectively). The amounts of 2-AG, but not anandamide
or PalEtn, were significantly increased following cell
maturation induced by bacterial lipopolysaccharide (LPS)
or the allergen Der p 1 (2.8- and 1.9-fold, respectively). By
using both RT-PCR and Western immunoblotting, den-
dritic cells were also found to express measurable amounts
of CB
1
and CB
2
receptors and of FAAH. Cell maturation
did not consistently modify the expression of these pro-
teins, although in some cell preparations a decrease of the
levels of both CB
1
and CB
2
mRNA transcripts was
observed after LPS stimulation. These findings demon-
strate for the first time that the endogenous cannabinoid
system is present in human dendritic cells and can be
regulated by cell activation.
Keywords: anandamide; 2-arachidonoylglycerol; cannabi-
noid; receptor; fatty acid amide hydrolase.
The D
9
-tetrahydrocannabinol (THC), the major psychoac-
tive component of Cannabis sativa, has been reported to
have beneficial effects on the treatment of nausea, glauco-
ma, hypertension, migraine, neurological disorders (i.e.
epilepsy, Huntington’s disease, Tourette’s syndrome, dys-
tonia and Parkinson’s disease) and pain [1], and to play a
down-regulatory role on the immune system [2]. Indeed,
cannabinoids exhibit immunosuppressive properties and
in vitro they weaken humoral immunity [3,4], cell-mediated
immunity [5,6] and cellular defenses against infectious
agents [7,8]. A modulation of the cytokine network and a
decrease of T- and B-cell proliferation have been described
in vitro [9]. A reduction of the cytolytic activity of natural
killer cells and of antigen presentation was also observed,
again in vitro [9].
The endocannabinoid system, comprising membrane
receptors for THC, endogenous ligands for these receptors,
and proteins for their biosynthesis and inactivation, is
present to a large extent in mammalian immune tissues. The
cannabinoid CB
2
receptor, cloned by Munro et al. [10] from
a human promyelocytic leukemia (HL60) cell cDNA
library, appears to be the predominant cannabinoid recep-
tor in the immune system, while it is not expressed in the
brain. High CB
2
expression is observed in B cells and in
natural killer cells, and may be related to the established
alteration of the function of these cells by cannabinoids.
CB
2
is also expressed to a lesser extent in monocytes,
neutrophils and T cells. The brain cannabinoid receptor,
CB
1
, is also expressed in immune cells such as like
lymphocytes [11], splenocytes [12] and T cells [13].
Anandamide was the first endogenous cannabinoid
receptor ligand to be discovered in 1992 [14]. Other
endocannabinoidswere reported later, i.e. 2-arachido-
noyl-glycerol (2-AG) [15,16] and noladin ether [17]. Endo-
cannabinoids have been found in immune cells like
macrophages [18–21] and RBL-2H3 basophilic leukemia
Correspondence to V. Di Marzo, Istituto di Chimica
Biomolecolare, Consiglio Nazionale delle Ricerche,
Comprensorio Olivetti, Pozzuoli (Napoli), Italy.
Fax: + 39 081 8041770, Tel.: + 39 081 8675093,
E-mail: vdimarzo@icmib.na.cnr.it
Abbreviations: 2-AG, 2-arachidonoylglycerol; PalEtn, N-palmitoyl-
ethanolamine; FAAH, fatty acid amide hydrolase; THC, D
9
-tetra-
hydrocannabinol; LPS, lipopolysaccharide; LC-APCI-MS, liquid
chromatography-atmospheric pressure chemical ionization-mass
spectrometry; MACS, magnetic cell sorting.
(Received 26 March 2002, revised 10 June 2002,
accepted 24 June 2002)
Eur. J. Biochem. 269, 3771–3778 (2002) FEBS 2002 doi:10.1046/j.1432-1033.2002.03078.x

cells [22]. After stimulation with either lipopolysaccharide
(LPS) or platelet activating factor, macrophages and
lymphocytes are able to produce a higher amount of
anandamide and/or 2-AG [21,23–26]. IgE-dependent stim-
ulation of RBL-2H3 cells also leads to the formation of
anandamide and of its congener N-palmitoylethanolamine
(PalEtn) [22], which exerts anti-inflammatory actions via
nonCB
1
, nonCB
2
–mediated mechanisms [27]. Endocanna-
binoids have various effects on immune cell function, some
of which (e.g. modulation of cytokine release from mac-
rophages and inhibition of lymphocyte proliferation)
resemble those of THC, while some others (e.g. stimulation
of hematopoietic cell proliferation) are exerted via
noncannabinoid receptor-mediated mechanisms (reviewed
in [28,29]).
After cellular uptake, mediated by one or more yet to be
characterized specific membrane transporters, the degrada-
tion of endocannabinoids occurs via the fatty acid amide
hydrolase (FAAH) [30] in neuronal as well as immune cells,
such as RBL-2H3 basophilic leukemia cells [22], U937
monocytic cells [31], macrophages [24,32], mast cells [33],
and platelets [34]. FAAH, a serine hydrolase and a member
of the amidase family, is an integral membrane protein that
is responsible for the inactivation of anandamide and, to
some extent, 2-AG [35,36].
Dendritic cells, derived from bone marrow stem cells, are
the most potent antigen-presenting cells of the immune
system. They play a central role in the initiation of primary
immune response and in the enhancement of secondary
immune response [37,38]. Immature dendritic cells localized
in peripheral tissues are able to take up antigens (i.e. viruses,
bacteria, parasites, cancer cells) and, subsequently, to
migrate through afferent lymphatics to the T cell-rich zone
of draining lymph nodes. During migration, immature
dendritic cells undergo an additional maturation step and
become able to present processed antigens in association
with major histocompatibility complex II antigens [39], and
to stimulate naive T cells [40]. Dendritic cells are involved in
the polarization of the immune response towards a Th1
(large production of interferon-c) or a Th2 (sustained
production of interleukins-4 and -5, as observed in allergies)
profile.
Despite the key pivotal role in the immune response
played by dendritic cells, nothing is known about their
capability to produce, respond to and degrade endocanna-
binoids. Indeed as dendritic cells can be derived from
monocytes, and as monocytes were previously described to
express the endocannabinoid system, we investigated the
presence and regulation of endocannabinoids, cannabinoid
receptors and FAAH in immature and mature dendritic
cells obtained by stimulation with either the bacterial agent
LPS or the mite allergen, Der p 1.
MATERIALS AND METHODS
Materials and animals
Deuterated anandamide, PalEtn and 2-AG were synthe-
sized from [
2
H
4
]palmitic acid and [
2
H
8
]arachidonic acid
and ethanolamine or glycerol as described previously [22].
Rats (Strain CD, Charles River, France) were anaesthe-
tized before their brain and spleen were removed and
placed in nitrogen.
Antibodies
Rabbit antihuman CB
1
and CB
2
polyclonal antibodies and
also the corresponding blocking peptides were from Cay-
man. The CB
1
antibody was raised against the N-terminal
(amino acids 1–14) extracellular region of human and rat
CB
1
receptor. The CB
2
antibody was raised against a
sequence between the N-terminal and the first trans-
membrane domain of the protein of the human and rat
CB
2
receptor. The specificity of the CB
1
and CB
2
antibodies
was described in McIntosh et al. [41] and in Shire et al.[42],
respectively. Rabbit anti-human and rat FAAH polyclonal
antibody, kindly provided by M. Maccarrone (Department
of Experimental Medicine and Biochemical Sciences, Uni-
versity of Rome-Tor Vergata, Italy), was elicited against the
conserved FAAH sequence VGYYETDNYTMPSPAMR
[26].
Isolation of human monocytes and differentiation
into dendritic cells
Dendritic cells were generated in vitro from peripheral blood
mononuclear cells (PBMC) as described previously [43].
Blood from healthy donors was centrifuged (120 g,15min)
and platelet rich plasma was discarded. Blood cells were
further diluted in Roswell Park Memorial Institute medium
(RPMI 1640) and layered over a Ficoll gradient (Pharma-
cia) (v/v). After centrifugation (400 g, 30 min), two fractions
were obtained: a top leukocyte band containing mononu-
clear cells (monocytes and lymphocytes) and a lower band
containing polymorphonuclear leukocytes (granulocytes)
and the red cells. The PBMC were recovered, washed with
RPMI and counted. After a further centrifugation, the cell
pellet was resuspended in NaCl/P
i
containing BSA and
EDTA for CD14
+
monocyte purification by magnetic cell
sorting (MACS) micro beads (Miltenyl Biotech, Germany),
as described by the manufacturer.
Briefly, CD14 microbeads were developed for human cell
separation based on the expression of the CD14 antigen.
The CD14 antigen is expressed in high amounts in
monocytes and/or macrophages and in low amounts in
granulocytes. For monocyte purification, 10 ·10
6
enriched
PBMCwereincubatedfor30 minonicewith20 lLMACS
micro beads coated with antibodies directed against CD14
membrane marker, washed and applied onto a column
placed in the magnetic field of a MACS separator (Miltenyi
Biotec, Paris, France). After elution of the CD14-negative
cells by two washings with NaCl/P
i
/BSA/EDTA buffer, the
column was removed from the magnetic field and the
CD14
+
monocytes were collected, washed twice in RPMI
1640 medium before plating (2 ·10
6
cells; 2 mL per well)
into six-well flat-bottomed culture plates in RPMI 1640
medium supplemented with 1% Tiacarpen (0.2 mgÆmL
)1
;
SmithKline Beecham) and 10% fetal bovine serum
(Life Technologies). To allow monocyte differentiation
into immature dendritic cells, CD14
+
cells were cultured
for 6 days at 37 C in humidified 5% CO
2
in air, into
six-well flat-bottomed culture plates in RPMI medium
supplemented with granulocyte-macrophage colony stimu-
lating factor (Peprotech, London, UK) (20 ngÆmL
)1
), and
interleukin-4 (R&D Systems) (200 UÆmL
)1
).
For dendritic cell activation, LPS (1 lgÆmL
)1
)orthe
Der p 1 antigen (a major allergen of the house dust mite
3772 I. Matias et al. (Eur. J. Biochem. 269)FEBS 2002

Dermatophagoides pteronyssinus)(500ngÆmL
)1
)wasadded
to the culture medium for 24 h. Cell cultures were further
harvested for analysis.
Purification and quantification of endocannabinoids
The extraction, purification and quantification of ananda-
mide, 2-AG and PalEtn from immature and mature
dendritic cells requires a set of different biochemical steps
[22]. First, cells were Dounce-homogenized and extracted
with chloroform/methanol/Tris/HCl 50 m
M
pH 7.5
(2 : 1 : 1, v/v) containing internal standards (5 pmol
[
2
H
8
]anandamide, 100 pmol [
2
H
8
]2-AG, and 5 pmol
[
2
H
4
]PalEtn). The lipid-containing organic phase was dried
down, weighed, prepurified by open bed chromatography
on silica gel. The resultant fractions were obtained by
eluting the column with 9 : 1 and 1 : 1 (v/v) chloroform/
methanol and then analyzed by liquid chromatography-
atmospheric pressure, chemical ionization-mass spectro-
metry (LC-APCI-MS) by using a Shimadzu HPLC
apparatus (LC-10ADVP) coupled to a Shimadzu (LCMS-
2010) quadrupole MS via a Shimadzu APCI interface.
MS analyses were carried out in the selected ion
monitoring (SIM) mode, as described previously [44]. The
temperature of the APCI source was 400 C, the HPLC
column was a Phenomenex (5 lm, 150 ·4.5 mm) reverse-
phase column, eluted as described [44]. Anandamide
(retention time 14.5 min), PalEtn (retention time
19.0 min) and 2-AG quasi-molecular ions (m/z¼348.3,
379.3 and 300.3) were quantified by isotope dilution with the
above-mentioned deuterated standards (same retention
times and m/z¼356.3, 387.3 and 304.3) [44] and their
amounts in pmoles normalized per 10
7
cells. Two LC-MS
peaks for both deuterated and undeuterated mono-arachi-
donoylglycerol were found at retention times of 17.0 and
18.9 min, respectively, corresponding to 2-AG and 1(3)-
AG, in agreement with the previous observation that 2-AG
undergoes isomerization during the purification procedure
[24]. Therefore, the amounts of 2-AG were calculated by
adding the amounts of the two isomers. The amounts of
endocannabinoids are expressed as pmols or nmols per 10
7
cells extracted. Data were statistically evaluated by
ANOVA
(Bonferroni-adjusted).
Total RNA isolation and RT-PCR analysis
Total RNA from immature and mature dendritic cells was
extracted using Trizol reagent according to the manufac-
turer’s recommendations (GibcoBRL). Following extrac-
tion, RNA was precipitated using ice-cold isopropanol,
resuspended in diethyl pyrocarbonate (Sigma)-treated water
and its integrity was verified following separation by
electrophoresis into an 1% agarose gel containing ethidium
bromide. RNA was further treated with RNAse-free
DNAse I (Ambion DNA-freeTM kit) according the manu-
facturer’s recommendations to digest contaminating
genomic DNA and to subsequently remove the DNAse
and divalent cations.
The expression of mRNAs for glyceraldehyde-3-phos-
phate dehydrogenase, FAAH, CB
1
and CB
2
receptors was
examined by RT-PCR. Total RNA was reverse-transcribed
using oligo dT primers. DNA amplifications were carried
out in PCR buffer (Q-Biogen) containing 2 lL cDNA,
500 l
M
dNTP, 2 m
M
MgCl
2
,0.8 l
M
each primer and 0.5 U
Taq polymerase (Q-Biogen). The thermal reaction profile
consisted of a denaturation step at 94 Cfor1min,
annealing at 60 Cfor1minandanextensionstepat
72 C for 1 min. A final extension step of 10 min was
carried out at 72 C. The PCR cycles were 35 for CB
1
,CB
2
,
FAAH and glyceraldehyde-3-phosphate dehydrogenase
and were observed to be optimal and in the linear portion
of the amplification curve (data not shown). Reactions were
performed in a PE Gene Amp PCR System 9600 (Perkin-
Emer). After PCR, the products were separated by electro-
phoresis on a 2% agarose gel containing ethidium bromide
for UV visualization.
The specific human oligonucleotides were synthesized on
the basis of cloned human cDNA sequences of glyceralde-
hyde-3-phosphate dehydrogenase, FAAH, CB
1
and CB
2
.
For glyceraldehyde-3-phosphate dehydrogenase, the prim-
ers sequences were 5¢-CCCTTCATTGACCTCAACTA
CATGGT-3¢(nucleotides 208–233; sense) and 5¢-GAG
GGCCATCCACAGTCTTCTG-3¢(nucleotides 655–677;
antisense). The FAAH sense and antisense primers were
5¢-GTGGTGCT(G/A)ACCCCCATGCTGG-3¢(nucleo-
tides 469–475) and 5¢-TCCACCTCCCGCATGAACCG
CAGACA-3¢(nucleotides 561–569), respectively. The CB
1
sense and antisense primers were 5¢-GATGTCTTTGGGA
AGATGAACAAGC-3¢(nucleotides 365–373) and 5¢-AG
ACGTGTCTGTGGACACAGACATGG-3¢(nucleotides
460–468), respectively. For CB
2
, the primers sequences were
5¢-CCCATGCAGGA(G/T)TACATGATCCTGAG-3¢
(nucleotides 20–29; sense) and 5¢-CTCCGC(A/C)G(A/G)
AAGCCCTC(A/G)TAC-3¢(nucleotides 64–70; antisense).
The expected sizes of the amplicons were 470 bp for
glyceraldehyde-3-phosphate dehydrogenase, 300 bp for
FAAH, 309 bp for CB
1
and 150 bp for CB
2
. The glycer-
aldehyde-3-phosphate dehydrogenase house-keeping gene
expression was used in order to evaluate any variation in the
RNA content and cDNA synthesis in the different prepa-
rations. Furthermore, the PCR primers for glyceraldehyde-
3-phosphate dehydrogenase and FAAH were selected on
the basis of the sequence of the FAAH gene (NCBI
accession number AF098010) by including the introns
5476–6026 and 6173–6296, and of the sequence of the
glyceraldehyde-3-phosphate dehydrogenase gene (NCBI
accession number AH007340) by including the introns
3216–3305, 3413–3541, 3633–3722, 3839–3930 and 4013–
4205, respectively. In the presence of contaminant genomic
DNA, the expected size of the amplicons would be 1062 bp
for glyceraldehyde-3-phosphate dehydrogenase and
1335 bp for FAAH, respectively. No PCR products were
detected when the reverse transcriptase step was omitted
(data not shown).
Western immunoblotting
Analytical SDS/PAGE (10%) was performed as described
previously [45] on lysates from immature dendritic cells and
from brain and spleen of rat used as positive control for
CB
1
,CB
2
and FAAH, respectively. Western blot analysis
was then carried out with the CB
1
,CB
2
and FAAH
polyclonal antibody. Briefly, dendritic cells or rat organs
were homogenized in lysis buffer (1 m
M
EDTA, 50 m
M
Tris/HCl pH 7.4, 150 m
M
NaCl, 1 m
M
Na-orthovanadate,
1m
M
Na-fluoronate, 1% NP-40, 0.1% SDS, 1% Triton,
FEBS 2002 The endocannabinoid system in human dendritic cells (Eur. J. Biochem. 269) 3773
0.25% Na-desoxycholate, 1 m
M
phenylmethanesulfonyl
fluoride, 1 mgÆmL
)1
serine proteases inhibitors) using a
Dounce homogenizer, incubated at 4 C for 30 min and
finally centrifuged at 10 000 gfor 20 min The amount of
proteins in each resulting supernatant was titrated by a
Biorad assay. Supernatants were mixed 4 : 1 (v/v) with
sample buffer (300 m
M
Tris/HCl pH 6.8, 50% glycerol,
500 m
M
dithiotreitol, 0.05% Bromophenol blue, 10% SDS)
and boiled for 5 min prior to loading on a 0.75 mm-thick
gel. Samples were subjected to electrophoresis (100 V) for
2.5 h under reducing conditions, and separated proteins
were transferred onto Immobilon Protein Transfer at
30 mA overnight at 4 C. The nitrocellulose membrane
was preincubated with 5% nonfat dry milk in NaCl/Tris
(10 m
M
Tris/HCl pH 8, 150 m
M
NaCl)for30mintoblock
nonspecific binding. The membrane was incubated for 1 h
in antibody at a dilution of 1 : 400 for CB
1
polyclonal
antibody, 1 : 250 for CB
2
polyclonal antibody, and 1 : 200
for FAAH polyclonal antibody. A control was made in the
same conditions using the CB
1
polyclonal antibody and the
CB
2
polyclonal antibodies preabsorbed with the homolo-
gous antigens (4 lgÆmL
)1
antibody solution). Then, the
membrane was washed 3 ·10 min in NaCl/Tris containing
0.05% Tween-20 (NaCl/Tris/Tween) and incubated with
goat anti-(rabbit IgG) Ig conjugated with horseradish
peroxidase (dilution 1 : 3000) for 1 h. The membrane was
again washed 3 ·10mininNaCl/Tris/Tweenandrinsedin
NaCl/Tris/Tween.SignalsweredetectedwithanECLkit
(Biorad). Control of specificities was performed by pre-
adsorpbing the antibody by the homologous antigen at a
concentration of 4 lgÆmL
)1
of antibody solution.
RESULTS
Endocannabinoids in dendritic cells
After a lipid extraction in chloroform/methanol, a separa-
tion was conducted using SiO
2
open bed chromatography.
The separated lipids (9 : 1 fraction) were subjected to
LC-APCI-MS analysis. The amounts in immature dendritic
cells were 0.14 ± 0.02 pmol per 10
7
cells and
2.1±1.0pmolper10
7
cells, for anandamide and 2-AG,
respectively (means ± SD, n¼4). PalEtn was quantified
at an amount of 8.2 ± 3.9 pmol per 10
7
cells
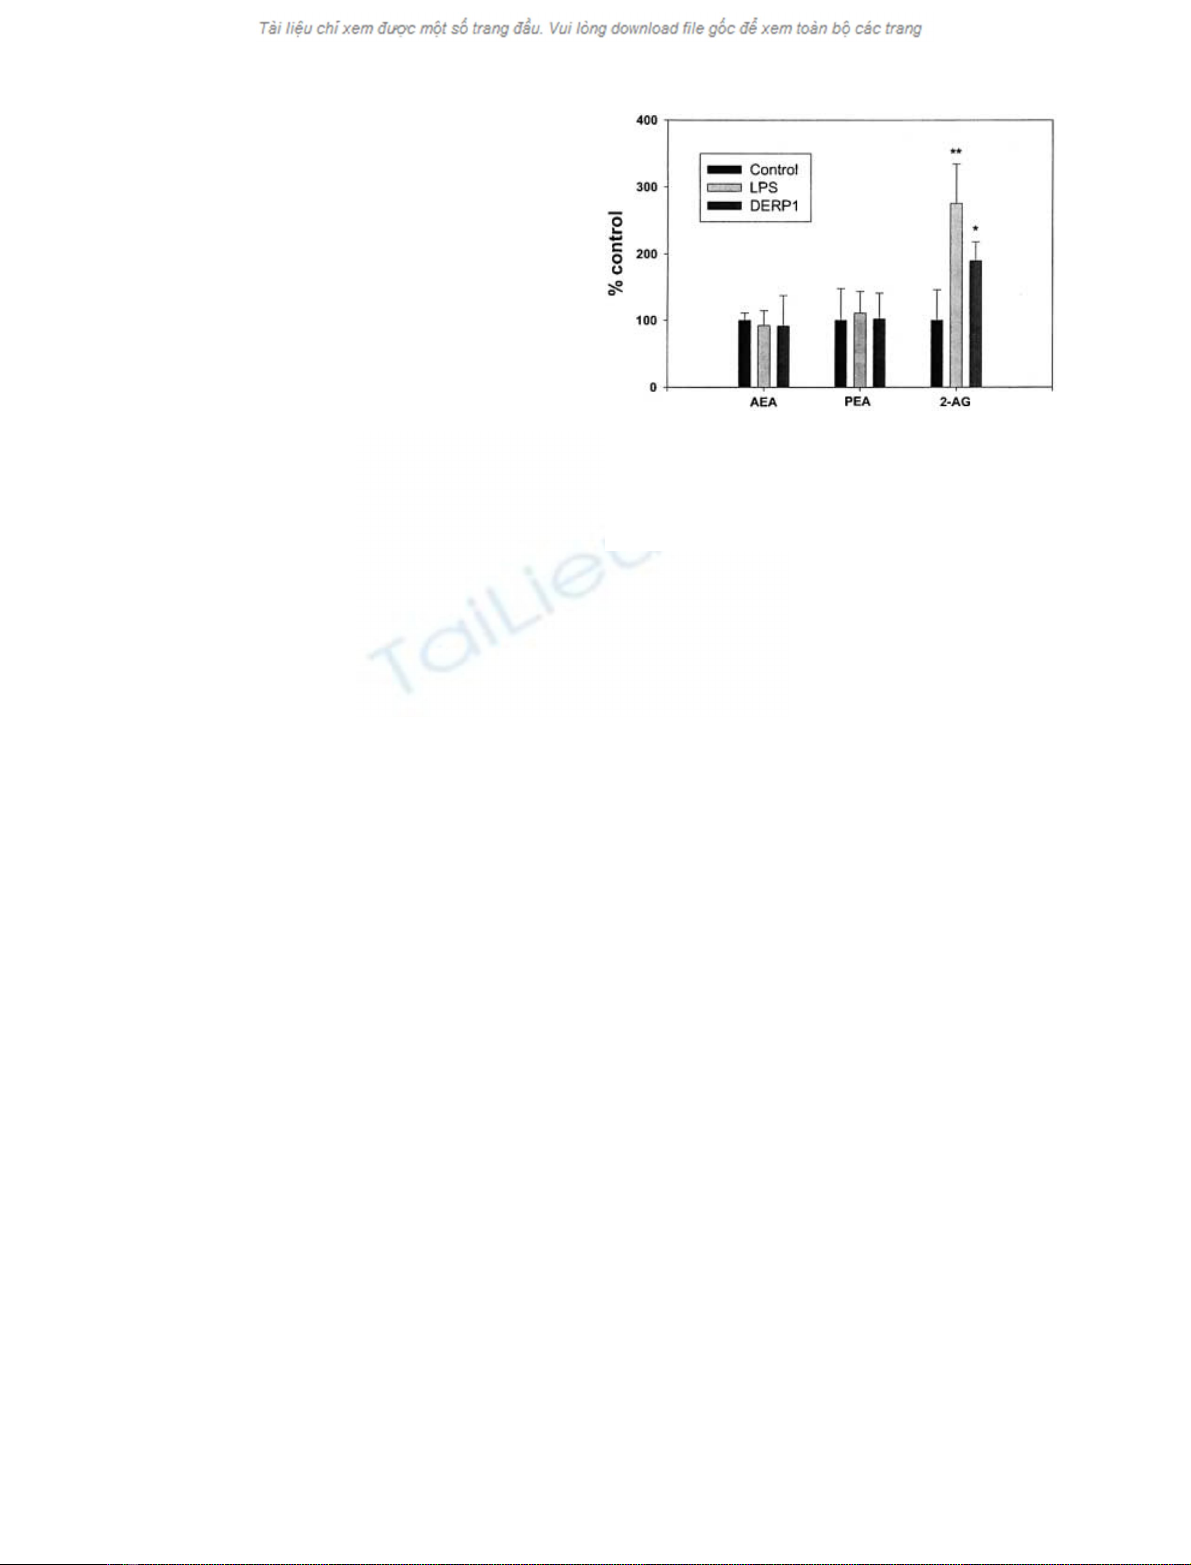
(means ± SD, n¼4). Because the activation and the
maturation of dendritic cells induce a series of events that
lead to changes in dendritic cell phenotype and function, we
have compared the amount of these compounds in
immature dendritic cells that were used as control (100%)
with those of dendritic cells made mature by stimulation
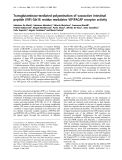
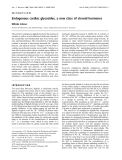
with LPS and Der p 1 allergen (Fig. 1). We found that in
mature dendritic cells the amounts of 2-AG were increased
to 275.5 ± 59.1% and 189.8 ± 28.2% of control after
LPS and Der p 1 stimulation, respectively (means ± SD,
n¼4, P<0.05 by
ANOVA
) (Fig. 1). By contrast, we
observed no statistically significant effect on anandamide
amounts (92.3 ± 22.1% and 91.5 ± 45.6% of control
after LPS and Der p 1 stimulation, respectively, means
±SD,n¼4, P> 0.05) (Fig. 1). The amounts of PalEtn
were also not significantly modified by cell maturation
(110.8 ± 32.5% and 102.0 ± 38.9% of control for LPS
and Der p 1 stimulation, respectively, means ± SD, n¼4)
(Fig. 1).
Analysis of cannabinoid receptors and fatty acid
amide hydrolase
To determine the presence of the cannabinoid receptors
(CB
1
and CB
2
) and of the fatty acid amide hydrolase
(FAAH), we used two independent methods. RT-PCR was
used to determine the presence of the messenger RNAs, and
Western immunoblot analysis was used to determine the
presence of the corresponding proteins.
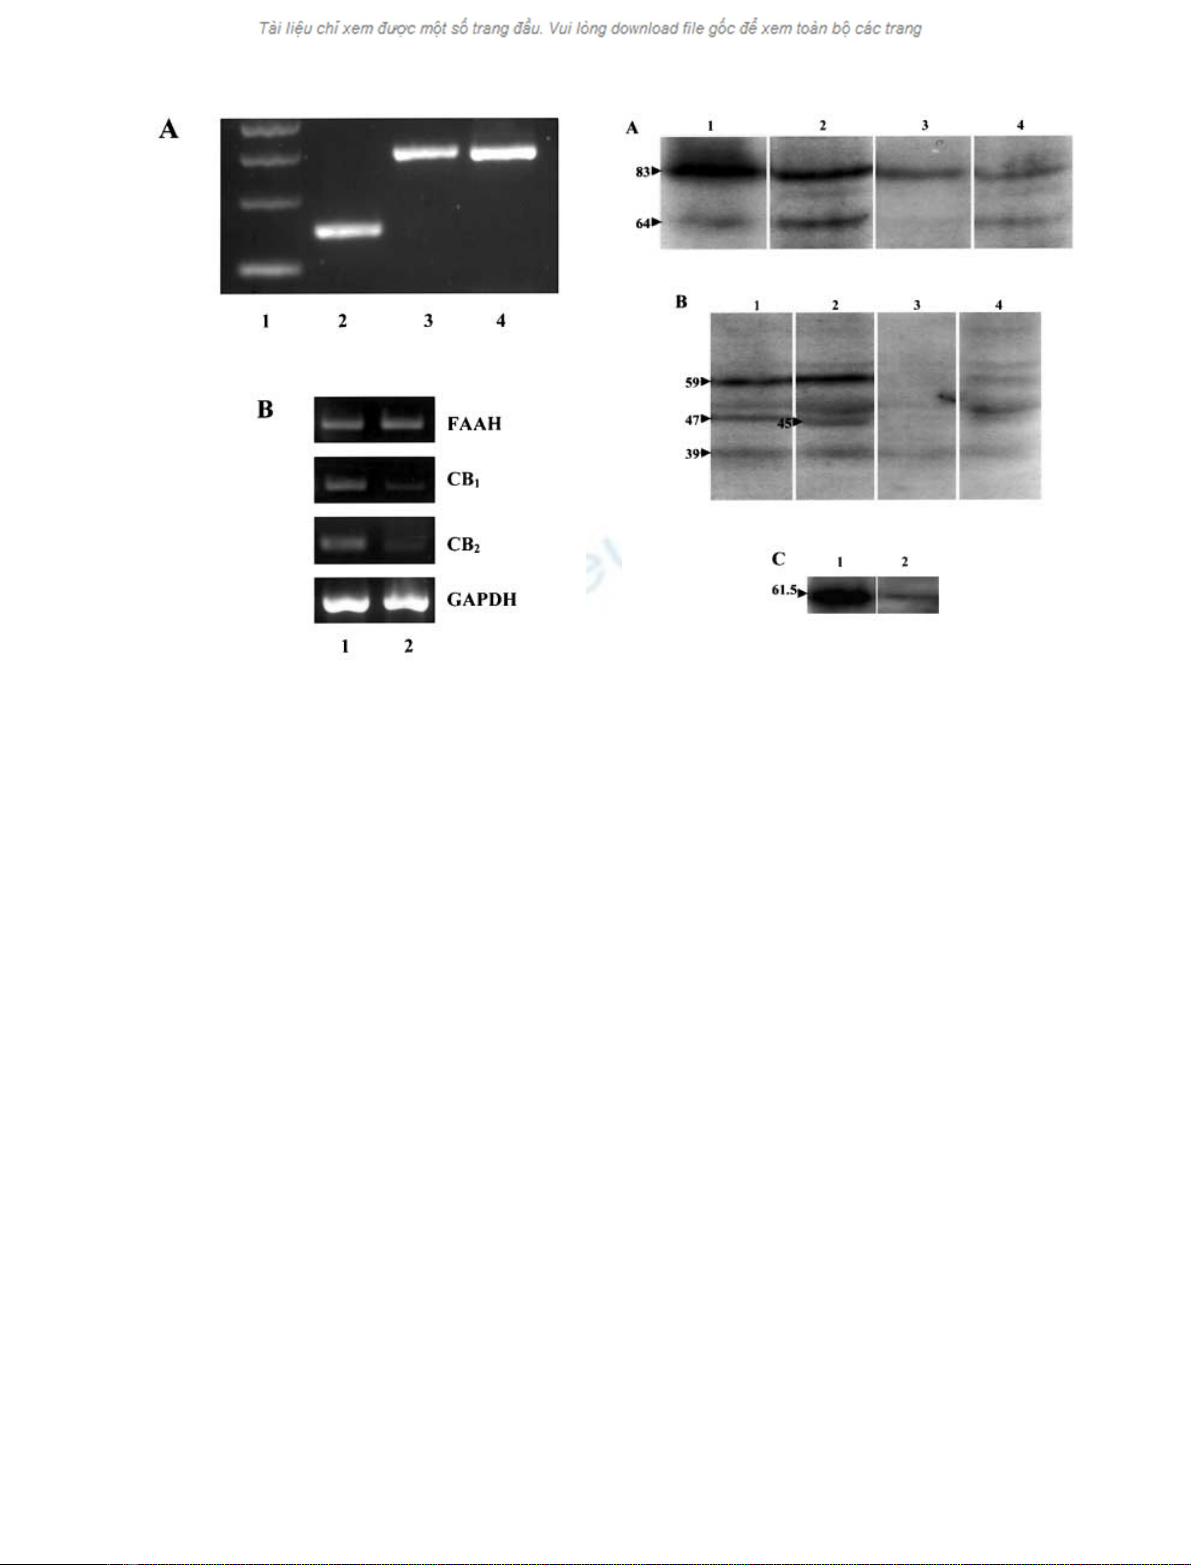
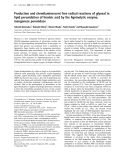
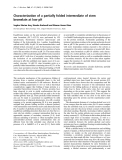
Using specific primers for human CB
1
, amplification of
immature and mature dendritic cell cDNA revealed the
presence of mRNA transcripts of the expected length for
CB
1
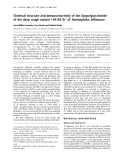
(Fig. 2A). Western immunoblotting of immature
dendritic cells shows two bands at 83 and 64 kDa very
similar to those detected in rat brain, used as positive
control (Fig. 3A). The predicted size of the CB
1
protein
based in its amino acid sequence following extrapolation
from its corresponding cDNA is 53 kDa. However, previ-
ous studies demonstrated that the immunoreactive bands at
83 and 64 kDa most likely represent a receptor that has
undergone post-translational modification such as glycosy-
lation [46]. That the immunoreactive bands at 83 and
64 kDa were not due to nonspecific interactions is sup-
ported by the observation that preabsorbing of the CB
1
antibody with its corresponding blocking peptide eliminated
almost all of the staining of these bands (Fig. 3A). The most
abundant band in human immature dendritic cells was the
one at 83 kDa which may be related to a predominant
glycosylation form of the CB
1
receptor in these cells.
Additionally, in the rat brain lysate we also observed a band
at 41 kDa which could correspond to the truncated CB
1
receptor protein (data not shown) [46].
The expression of CB
2
mRNA in immature and mature
dendritic cells was also demonstrated by using RT-PCR
with specific human primers (Fig. 2A). Western blot
analysis of proteins prepared from human immature
dendritic cells shows the presence of three immunoreactive
bands at 59, 45 and 39 kDa (Fig. 3B). The most
abundant band was the one at 59 kDa, which was
present in both human immature dendritic cells and in rat
Fig. 1. Modulation of the levels of anandamide (AEA), PalEtn and
2-AG in dendritic cells treated with either vehicle (control), LPS or
Der p 1. Data are expressed as per cent of controls and are means
±SD(n¼4). *P<0.05by
ANOVA
. Control levels were 0.14 ± 0.02,
8.2±3.9and2.1±1.0pmolper10
7
cells for AEA, PalEtn and 2-
AG, respectively.
3774 I. Matias et al. (Eur. J. Biochem. 269)FEBS 2002
spleen used as a positive control. This band, whose
staining was totally abolished when the CB
2
antibody was
preabsorbed with its corresponding antigen, might corre-
spond to a glycosylated form of the CB
2
receptor protein.
The dendritic cells band at 45 kDa and the rat spleen at
47 kDa were less intense and are consistent with the
previous glycosylated forms of human and rat CB
2
receptors [47,48]. The 39 kDa band was very faint in
both human immature dendritic cells and rat spleen and
could correspond to the 39 kDa predicted size of the CB
2
protein based on its amino acid sequence extrapolated
from the corresponding cDNA.
A FAAH mRNA transcript was also detected in human
dendritic cells. RT-PCR amplification of cDNA of these
cells shows a single band of the expected molecular size
(Fig. 2A). We also determined the presence of the FAAH
protein by Western blot analysis (Fig. 3C). An intense
staining band at 61.5 kDa, corresponding to the predicted
size of FAAH protein (62 kDa), based on its amino acid
sequence extrapolated from its corresponding cDNA, was
observed in immature dendritic cells as well as in rat brain
lysates (Fig. 3C).
To examine the modulation of CB
1
,CB
2
and FAAH
mRNA expression in immature vs. mature dendritic cells,
we compared the expression of these genes by RT-PCR in
immature dendritic cells, used as controls, with that of
dendritic cells after stimulation with LPS and Der p 1
allergen. Although in some cases a decrease of the expres-
sion of CB
1
and CB
2
receptor was observed with LPS
(Fig. 2B), these findings could not be reproduced in all
dendritic cell preparations examined.
DISCUSSION
The results presented here indicate for the first time that
human dendritic cells contain anandamide, 2-AG and
PalEtn. The amounts of anandamide and 2-AG in imma-
ture dendritic cells were similar to the ones detected in rat
circulating macrophages [21,24], and also in this case 2-AG
was the most abundant endocannabinoid. As compared to
human lymphocytes [26], however, dendritic cells make 25
times less anandamide and much more 2-AG. PalEtn,
which is not an endocannabinoid but exhibits cannabimi-
metic anti-inflammatory effects in immune cells [28,49], was
more abundant than both anandamide and 2-AG, as
Fig. 2. FAAH, CB
1
and CB
2
mRNA expression in dendritic cells. (A)
Expression in immature cells of mRNA transcripts with the expected
sizes for CB
2
(lane 2), CB
1
(lane 3) and FAAH (lane 4). A 100 bp DNA
ladder is shown starting from 100 bp (lane 1). (B) FAAH, CB
1
and
CB
2
mRNA expression in immature dendritic cells (lane 1) or after
stimulation with LPS (lane 2). Glyceraldehyde-3-phosphate dehydro-
genase (GAPDH) mRNA expression in dendritic cells is shown as the
housekeeping gene. The expected sizes of the amplicons were 300 bp
for FAAH, 309 bp for CB
1
, 150 bp for CB
2
and 470 bp for GAPDH.
In (A) five times more PCR product than in (B) was loaded onto the
agarose gel. In (B), data are not representative of all the samples
analyzed, as in only three preparations out of the six analyzed was a
decrease of mRNA transcripts observed.
Fig. 3. Western immunoblotting of protein homogenates of human
immature dendritic cells, rat brain and rat spleen. (A) Rat brain (lane 1)
and dendritic cell (lane 2) lysates reacted with CB
1
antibody exhibit
two immunoreactive bands at 83 kDa and 64 kDa. The
immunostaining of these bands were reduced in rat brain (lane 3) and
in dendritic cells (lane 4) lysates when the CB
1
antibody was preab-
sorbed with its corresponding homologous peptide. (B) Rat spleen
(lane 1) and dendritic cells (lane 2) lysates reacted with CB
2
antibody
show three immunoreactive bands: at 59, 47 and 39 kDa for the
rat spleen lysate and at 59, 45 and 39 kDa for the dendritic cell
lysate. Pre-adsorption of CB
2
antibody with the homologous antigen
abolished the positive staining (lanes 3 and 4). (C) Rat brain (lane 1)
and dendritic cell (lane 2) lysates reacted with FAAH antibody exhibit
an intense immunoreactive band at 61.5 kDa.
FEBS 2002 The endocannabinoid system in human dendritic cells (Eur. J. Biochem. 269) 3775


%20--%3e%3cdefs%3e%3cstyle%3e%20.st0%20{%20fill:%20%23fff;%20}%20.st1%20{%20fill:%20%237800fa;%20}%20%3c/style%3e%3c/defs%3e%3cpath%20class='st1'%20d='M117.78,12.18H43.11c2.9,3.47,4.65,7.94,4.65,12.82,0,5.6-2.3,10.66-6.01,14.29h76.02l7.22-13.56-7.22-13.56Z'/%3e%3cg%3e%3cpath%20class='st0'%20d='M53.58,26.17h-.59v-1.46h.59v-4.96h2.83c1.78,0,2.67.94,2.67,2.82v5.76c0,1.87-.89,2.81-2.67,2.81h-2.83v-4.96ZM55.36,21.37v3.34h1.1v1.46h-1.1v3.34h1.01c.61,0,.91-.37.91-1.1v-5.93c0-.74-.3-1.1-.91-1.1h-1.01Z'/%3e%3cpath%20class='st0'%20d='M65.99,31.14h-1.8l-.31-2.07h-2.19l-.31,2.07h-1.64l1.82-11.39h2.62l1.82,11.39ZM65.28,18.04c-.25.46-.51.77-.75.94-.21.15-.47.22-.79.22-.26,0-.57-.07-.92-.22l-.38-.15c-.14-.05-.26-.07-.37-.07-.3,0-.53.18-.71.54l-.91-.68c.25-.46.51-.77.75-.94.21-.14.48-.21.79-.21.26,0,.57.07.92.21l.38.15c.14.05.26.07.37.07.3,0,.53-.18.71-.54l.91.68ZM61.91,27.52h1.73l-.87-5.76-.87,5.76Z'/%3e%3cpath%20class='st0'%20d='M74.53,26.89v1.52c0,1.91-.89,2.86-2.67,2.86s-2.67-.95-2.67-2.86v-5.93c0-1.91.89-2.86,2.67-2.86s2.67.95,2.67,2.86v1.11h-1.69v-1.22c0-.75-.31-1.12-.93-1.12s-.93.37-.93,1.12v6.15c0,.74.31,1.11.93,1.11s.93-.37.93-1.11v-1.63h1.69Z'/%3e%3cpath%20class='st0'%20d='M81.4,31.14h-1.8l-.31-2.07h-2.19l-.31,2.07h-1.64l1.82-11.39h2.62l1.82,11.39ZM75.9,19.2l1.52-1.91h1.71l1.51,1.91h-1.61l-.76-.95-.75.95h-1.61ZM77.32,27.52h1.73l-.87-5.76-.87,5.76ZM83.1,15.99l-1.76,1.91h-1.26l1.17-1.91h1.86Z'/%3e%3cpath%20class='st0'%20d='M84.86,19.75c1.78,0,2.67.94,2.67,2.82v1.48c0,1.87-.89,2.81-2.67,2.81h-.85v4.28h-1.79v-11.39h2.64ZM84.01,21.37v3.86h.85c.58,0,.87-.36.87-1.08v-1.71c0-.71-.29-1.07-.87-1.07h-.85Z'/%3e%3cpath%20class='st0'%20d='M93.51,19.75c1.78,0,2.67.94,2.67,2.82v1.48c0,1.87-.89,2.81-2.67,2.81h-.85v4.28h-1.79v-11.39h2.64ZM92.66,21.37v3.86h.85c.58,0,.87-.36.87-1.08v-1.71c0-.71-.29-1.07-.87-1.07h-.85Z'/%3e%3cpath%20class='st0'%20d='M98.8,31.14h-1.79v-11.39h1.79v4.88h2.03v-4.88h1.83v11.39h-1.83v-4.88h-2.03v4.88Z'/%3e%3cpath%20class='st0'%20d='M105.36,24.55h2.46v1.62h-2.46v3.34h3.09v1.63h-4.88v-11.39h4.88v1.63h-3.09v3.18ZM108.17,17.29l-1.76,1.91h-1.26l1.17-1.91h1.86Z'/%3e%3cpath%20class='st0'%20d='M112.2,19.75c1.78,0,2.67.94,2.67,2.82v1.48c0,1.87-.89,2.81-2.67,2.81h-.85v4.28h-1.79v-11.39h2.64ZM111.35,21.37v3.86h.85c.58,0,.87-.36.87-1.08v-1.71c0-.71-.29-1.07-.87-1.07h-.85Z'/%3e%3c/g%3e%3ccircle%20class='st1'%20cx='25'%20cy='25'%20r='20'/%3e%3cpath%20class='st0'%20d='M32.78,19.27c2.92,0,4.43,2.55,5.28,5.33l.71,2.17c.14.38-.33.75-.71.75h-5.61c.19-.33.24-.71.09-1.08l-.75-2.45c-.43-1.32-.99-2.64-1.79-3.77.75-.57,1.65-.94,2.78-.94h0ZM25,18.38c3.25,0,4.9,2.78,5.89,5.89l.76,2.45c.14.42-.33.8-.8.8h-11.69c-.42,0-.94-.38-.8-.8l.75-2.45c.99-3.11,2.64-5.89,5.89-5.89h0ZM25,11.35c1.74,0,3.11,1.37,3.11,3.11s-1.37,3.11-3.11,3.11-3.11-1.41-3.11-3.11,1.41-3.11,3.11-3.11h0ZM17.27,19.27c1.08,0,1.98.38,2.73.94-.8,1.13-1.37,2.45-1.74,3.77l-.8,2.45c-.14.38-.05.75.09,1.08h-5.56c-.42,0-.9-.38-.75-.75l.71-2.17c.9-2.78,2.41-5.33,5.33-5.33h0ZM17.27,12.91c1.51,0,2.78,1.27,2.78,2.83s-1.27,2.83-2.78,2.83-2.83-1.27-2.83-2.83,1.27-2.83,2.83-2.83h0ZM32.78,12.91c1.56,0,2.78,1.27,2.78,2.83s-1.23,2.83-2.78,2.83-2.83-1.27-2.83-2.83,1.27-2.83,2.83-2.83h0ZM27.07,28.56v.09c0,.57-.24,1.08-.61,1.46h0v.05c-.38.33-.9.57-1.46.57s-1.08-.24-1.46-.61h0c-.38-.38-.61-.9-.61-1.46v-.09h1.41v.09c0,.19.05.38.19.47v.05c.09.09.28.19.47.19s.38-.09.47-.19v-.05c.14-.09.24-.28.24-.47t-.05-.09h1.41ZM30.99,28.56v.09c0,1.65-.66,3.16-1.74,4.24-1.08,1.08-2.59,1.79-4.24,1.79s-3.16-.71-4.24-1.79l-.05-.05c-1.04-1.08-1.7-2.55-1.7-4.2v-.09h1.41v.09c0,1.27.47,2.4,1.27,3.25h.05c.85.85,1.98,1.37,3.25,1.37s2.4-.52,3.25-1.37c.85-.8,1.37-1.98,1.37-3.25v-.09h1.37ZM34.99,28.56v.09c0,2.78-1.13,5.28-2.92,7.07-1.79,1.79-4.29,2.92-7.07,2.92s-5.23-1.13-7.07-2.92c-1.79-1.79-2.92-4.29-2.92-7.07v-.09h1.41v.09c0,2.4.94,4.53,2.5,6.08,1.56,1.56,3.72,2.5,6.08,2.5s4.52-.94,6.08-2.5c1.56-1.56,2.5-3.68,2.5-6.08v-.09h1.41Z'/%3e%3c/svg%3e)