BioMed Central
Page 1 of 11
(page number not for citation purposes)
Cost Effectiveness and Resource
Allocation
Open Access
Research
Cost analysis of an integrated disease surveillance and response
system: case of Burkina Faso, Eritrea, and Mali
ZanaCSomda*
1, Martin I Meltzer1, Helen N Perry1, Nancy E Messonnier1,
Usman Abdulmumini2, Goitom Mebrahtu3, Massambou Sacko4,
Kandioura Touré5, Salimata Ouédraogo Ki6, Tuoyo Okorosobo7,
Wondimagegnehu Alemu7 and Idrissa Sow7
Address: 1Centers for Disease Control and Prevention, Atlanta, Georgia, USA, 2WHO Country Office, Asmara, Eritrea, 3Disease Prevention and
Control, Ministry of Health, Eritrea, 4WHO Country Office, Bamako, Mali, 5Service Surveillance des Maladies, Ministère de la Santé, Mali,
6Direction des Etudes et de la Planification, Ministère de la Santé, Ouagadougou, Burkina Faso and 7WHO African Regional Office, Harare,
Zimbabwe
Email: Zana C Somda* - ZSomda@cdc.gov; Martin I Meltzer - MMeltzer@cdc.gov; Helen N Perry - HPerry@cdc.gov;
Nancy E Messonnier - NMessonnier@cdc.gov; Usman Abdulmumini - abdulmuminiu@er.afro.who.int;
Goitom Mebrahtu - goitomm2004@yahoo.com; Massambou Sacko - sackom@ml.afro.who.int; Kandioura Touré - ktoure@dnsmali.org;
Salimata Ouédraogo Ki - ouedraosali@yahoo.fr; Tuoyo Okorosobo - okorosobot@na.afro.who.int;
Wondimagegnehu Alemu - alemuw@afro.who.int; Idrissa Sow - sowi@zw.afro.who.int
* Corresponding author
Abstract
Background: Communicable diseases are the leading causes of illness, deaths, and disability in sub-Saharan
Africa. To address these threats, countries within the World Health Organization (WHO) African region adopted
a regional strategy called Integrated Disease Surveillance and Response (IDSR). This strategy calls for streamlining
resources, tools, and approaches to better detect and respond to the region's priority communicable disease. The
purpose of this study was to analyze the incremental costs of establishing and subsequently operating activities
for detection and response to the priority diseases under the IDSR.
Methods: We collected cost data for IDSR activities at central, regional, district, and primary health care center
levels from Burkina Faso, Eritrea, and Mali, countries where IDSR is being fully implemented. These cost data
included personnel, transportation items, office consumable goods, media campaigns, laboratory and response
materials and supplies, and annual depreciation of buildings, equipment, and vehicles.
Results: Over the period studied (2002–2005), the average cost to implement the IDSR program in Eritrea was
$0.16 per capita, $0.04 in Burkina Faso and $0.02 in Mali. In each country, the mean annual cost of IDSR was
dependent on the health structure level, ranging from $35,899 to $69,920 at the region level, $10,790 to $13,941
at the district level, and $1,181 to $1,240 at the primary health care center level. The proportions spent on each
IDSR activity varied due to demand for special items (e.g., equipment, supplies, drugs and vaccines), service
availability, distance, and the epidemiological profile of the country.
Conclusion: This study demonstrates that the IDSR strategy can be considered a low cost public health system
although the benefits have yet to be quantified. These data can also be used in future studies of the cost-
effectiveness of IDSR.
Published: 8 January 2009
Cost Effectiveness and Resource Allocation 2009, 7:1 doi:10.1186/1478-7547-7-1
Received: 16 June 2008
Accepted: 8 January 2009
This article is available from: http://www.resource-allocation.com/content/7/1/1
© 2009 Somda et al; licensee BioMed Central Ltd.
This is an Open Access article distributed under the terms of the Creative Commons Attribution License (http://creativecommons.org/licenses/by/2.0),
which permits unrestricted use, distribution, and reproduction in any medium, provided the original work is properly cited.

Cost Effectiveness and Resource Allocation 2009, 7:1 http://www.resource-allocation.com/content/7/1/1
Page 2 of 11
(page number not for citation purposes)
Background
Communicable diseases remain the most common causes
of death, illness and disability in African countries. Lopez
et al. (2006) reported that one-third of the deaths in low-
and-middle income countries in 2001 were from commu-
nicable and parasitic diseases and maternal and nutri-
tional conditions [1,2]. In addition, the economic cost in
terms of prevention, treatment, and loss of productivity is
enormous [3-5]. Although a number of studies on eco-
nomic evaluation of interventions against communicable
diseases have been reported in the literature [6,7], most of
these studies in sub-Saharan Africa have focused on indi-
vidual disease-specific intervention programs, such as pre-
vention or treatment of malaria, measles, meningitis,
tuberculosis and HIV/AIDS [5,8-15]. Relatively few stud-
ies have looked at the economics of integrating resources
for disease surveillance and public health response activi-
ties [16].
Surveillance is an important component of disease pre-
vention and control programs. It is useful in early detec-
tion of unusual events for effective and timely action,
monitoring and evaluation of interventions and guiding
selection of appropriate corrective measures [17]. In 1998,
the Regional Committee of the World Health Organiza-
tion Africa region (WHO-AFRO) adopted a strategy called
Integrated Disease Surveillance and Response (IDSR)
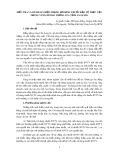
[18]. Under the IDSR strategy, countries address improve-
ments in infrastructure capacities and support activities
and select a number of priority diseases and health risk
conditions from a list of the 19 communicable diseases
that affect African communities (Figure 1) [19-21]. By
December 2007, considerable progress had been
achieved, with 43 of the 46 countries having assessed their
national surveillance system and developed plans of
action; 41 countries had already adapted the technical
guidelines to meet their own public health priorities and
situations and then launched IDSR activities at their dis-
trict levels; and 33 countries had trained staff on IDSR in
at least 60% of their districts (Table 1).
In order to better understand the investment and imple-
mentation costs of this IDSR strategy, the IDSR multi-part-
ner task force that guides the implementation of this
regional strategy recommended that the partners under-
take cost analyses and cost-effectiveness studies. There-
fore, the purpose of this study was to analyze the
incremental costs of establishing and subsequently oper-
ating activities for detection and response to the priority
diseases under the IDSR.
Methods
Study countries
The study was conducted in Burkina Faso, Eritrea, and
Mali, countries where infectious diseases such as cholera,
malaria, meningococcal meningitis and yellow fever are
either epidemic or endemic (Table 2). Burkina Faso, with
a population of 13.2 million, is divided into 13 health
regions, 55 districts and has more than 1,232 primary
health care centers. Mali, with about 13.5 million inhab-
itants, has nine regions, 57 districts and over 709 fully
operational primary health care centers. Eritrea, with an
estimated population of 4.4 million, is divided into six
regions, 57 districts and has 664 primary health care cent-
ers. These three countries were selected for this study
because each had fully established IDSR leadership and
structures at the national level by 2002, with implementa-
tion at regional and district levels in 2003 and 2004,
respectively.
Table 1: Progress with IDSR implementation in the WHO AFRO African Region†: 2001 – 2007
IDSR Activities Number of countries (% of total 46 countries)
2001 2002 2003 2004 2005 2006 2007
Sensitization of Ministry of Health officials and stakeholders on IDSR 22
(48%)
35
(76%)
36
(78%)
43
(96%)
44
(96%)
44
(96%)
44
(96%)
Assessment of national surveillance and response, including laboratory 22
(48%)
35
(76%)
36
(78%)
43
(93%)
43
(93%)
43
(93%)
43
(93%)
Development of IDSR plans of action 13
(28%)
31
(67%)
32
(70%)
43
(93%)
43
(93%)
43
(93%)
43
(93%)
Adaptation of generic IDSR technical guidelines* 1
(2%)
26
(57%)
35
(76%)
39
(85%)
41
(89%)
41
(89%)
41
(89%)
Adaptation of generic IDSR training materials* 1
(2%)
20
(43%)
35
(76%)
39
(85%)
39
(85%)
39
(85%)
Training staff on IDSR in at least 60% of the districts 33
(72%)
Publishing feedback bulletins 32
(70%)
†Source: Progress with IDSR implementation http://www.cdc.gov/idsr/implementation.htm#progress.
*Materials were developed by WHO AFRO and the US Centers for Disease Control and Prevention (CDC)
Cost Effectiveness and Resource Allocation 2009, 7:1 http://www.resource-allocation.com/content/7/1/1
Page 3 of 11
(page number not for citation purposes)
Study design
We conducted retrospective surveys of costs for integrating
surveillance and response to the priority diseases adopted
by each country (see Additional file 1, Appendix 1) at
national, regional, and district surveillance offices as well
as public health clinics, laboratories and pharmacies. We
conducted one field test in Eritrea followed by full field
studies in Burkina Faso and Mali. In Eritrea, the survey
sites included the central Ministry of Health, the Anseba
provincial office, and offices in the Haquaz district. In
Burkina Faso, most IDSR activities were focused on the
epidemic-prone diseases, with particular emphasis on
detection and response to meningococcal meningitis. The
data were obtained from four health regions (Bobo Diou-
lasso, Gaoua, Kaya, and Ouahigouya), 14 districts, and 20
primary health care centers. In Mali, the survey was con-
ducted in three regions (Kayes, Mopti, and Sikasso), and
included one district per region and one primary health
care center per district. We consulted, in each country,
with public health and disease surveillance officers to
select sites that they considered representative of the
national IDSR system.
We took the perspective of the government-funded health
care system (i.e., we only recorded costs incurred by the
governments and external partners). All cost data were
recorded in local currency values and then converted into
US dollar using the appropriate mean annual exchange
rate. We used the general consumer price index from each
country and a discount rate of 3% to adjust all costs into
2002 US dollars equivalent [22]. We also examined the
effect on cost per capita estimate of using purchasing
Recommended IDSR priority diseases, core functions and activities in the WHO African regionFigure 1
Recommended IDSR priority diseases, core functions and activities in the WHO African region.

Cost Effectiveness and Resource Allocation 2009, 7:1 http://www.resource-allocation.com/content/7/1/1
Page 4 of 11
(page number not for citation purposes)
power parities (PPP) to convert national currencies into
international dollars (PPP removes currency conversion
problems due to fixed conversion rates that may not
reflect actual relative costs) [22].
Cost data
We collected data associated with all "health-related sur-
veillance" (HRS) activities (i.e., all communicable and
non-communicable diseases and risk factors, including
the surveillance and response activities of the IDSR tar-
geted diseases) from Burkina Faso and Eritrea for the years
2002 to 2005 and from Mali for the years 2000 to 2005.
For each country, region/province and district, we
obtained annual population data from the disease surveil-
lance units. Program cost data were obtained from disease
surveillance budget and program records, and from inter-
views with IDSR program coordinators and key public
health staff. Whenever we found a difference between
budget and reported expenditure, we used the reported
expenditure. Aggregated pharmacy, clinical and medical
records were collected using a structured questionnaire.
The survey instrument (available from http://
www.cdc.gov/idsr/survcost.htm) guided collection of
data on all the resources used, including capital (one-time
investment) and recurrent (on-going) items. The capital
items included building infrastructure, vehicle, equip-
ment (e.g., refrigerators, computers, etc.), and furniture
(e.g., tables, chairs, etc.). The recurrent items included per-
sonnel (salaries and benefits of surveillance officers, data
managers, physicians, nurses, etc.), rent (rent, utilities,
operation, and maintenance), office and laboratory sup-
plies, transportation, public awareness campaigns and
short-term training. The questionnaire also collected
information on other variables related to disease surveil-
lance activities, such as length of use of buildings, vehicles
or equipment per year, and resources provided through
other activities and organizations.
IDSR specific cost estimation
For each health structure level, all resources were grouped
into the following major categories: personnel; transpor-
tation; office consumable goods; public awareness cam-
paigns; drugs or treatment; laboratory supplies; and
capital items (Additional file 1, Appendix 2). For each cat-
egory, we identified the proportion of those cost data
(such as staff workload or actual use of resources, if esti-
mates or records were available) attributable to IDSR.
Personnel costs
When time keeping records were absent, we interviewed
each staff member to estimate the breakdown of their
time on all HRS, IDSR priority diseases, each IDSR activity
(i.e., detection, notification, analysis, investigation,
response, feedback, and support), and other ministry of
health activities. We recorded the number of workers,
their annual income, and the number of full time equiva-
lents needed for administration or delivering of each HRS
and IDSR activity. We then apportioned total personnel
costs to each IDSR activity based on the ratio of personnel
time allocated to that activity relative to all IDSR activities.
We included fees of individual consultants hired for spe-
cialized services such as short-term training.
Transportation costs
We considered vehicles purchased for IDSR activities as
capital items (see below). IDSR-related running costs for
transporting personnel and patients, drugs, specimens,
vaccines and other items, as a percentage of the total fuel
and maintenance costs, were estimated based on the vehi-
cle use-time per IDSR activity. When there were no data to
Table 2: Summary of country health status*
Burkina Faso Eritrea Mali WHO African Region†
Total population (× 1,000) 13,228 4,401 13,518 738,083
Total expenditure on health (as % of GDP) 5.6 4.4 4.8
Adult mortality rate (per 1000 population) 441 313 452 492
Under-5 mortality rate (per 1000 live births) 192 82 219 167
Year of life lost by communicable diseases (%) 87 81 86 59
Causes of death among children under 5 years of age (%)
Neonatal causes 18.3 27.4 25.9 26.2
Diarrhoeal diseases 18.8 15.6 18.3 16.6
Malaria 20.3 13.6 16.9 17.5
Pneumonia 23.3 18.6 23.9 21.1
Measles 3.4 2.5 6.1 4.3
HIV/AIDS 4.0 6.2 1.6 6.8
Other 11.9 16 7.3 7.5
* Source: World Health Statistics 2006 http://www.who.int/whosis/en/
†WHO African region comprises 46 countries in sub-Saharan Africa including Algeria and Mauritania (African countries outside WHO/AFRO
region are Western Sahara, Morocco, Tunisia, Libya, Egypt, Sudan, and Somalia).

Cost Effectiveness and Resource Allocation 2009, 7:1 http://www.resource-allocation.com/content/7/1/1
Page 5 of 11
(page number not for citation purposes)
apportion transport costs, we proportioned costs using
the ratio of personnel time for IDSR to total personnel
time for all HRS activities. We included rental vehicle and
public transportation fees for IDSR-specific activities.
Office consumable costs
These included office supplies and materials, facilities and
equipment maintenance, and utilities costs. Office con-
sumable costs for IDSR, as a proportion of all HRS costs,
were calculated using either the ratio of IDSR personnel
time to all HRS personnel time, or actual amount of
resources used for IDSR-activities (if the latter were avail-
able).
Public awareness campaign costs
We measured advertising, broadcasting and media costs
for public campaigns and targeted social mobilization.
IDSR costs were estimated as a proportion of total media
health education costs using the ratio of IDSR personnel
time to all HRS personnel time.
Treatment costs
These included all drugs and vaccines as well as other pro-
grammatic measures (e.g., treated bed nets) used in the
line of controlling and preventing diseases included in the
IDSR program. Total annual costs were calculated based
on the procurement cost and the quantity of each specific
product required for the treatment of diseases. We esti-
mated IDSR costs using either the actual amount of
resource or the ratio of IDSR personnel time to all HRS
personnel time at the health facility (if the former were
available).
Laboratory consumable costs
We estimated the costs of laboratory consumable materi-
als and supplies (e.g., reagents, slides, gloves, test tubes,
cotton wool swabs, blood culture bottles, aluminum foil,
syringes, rapid diagnostic kits, etc) required for the pur-
pose of various diagnostic tests for diseases included in
the IDSR strategy.
Capital equipment costs
The costs of buildings, laboratory and office equipment
and vehicles were depreciated at 3% annually over a 50-,
10-, and 5-year useful-life time horizon, respectively. We
calculated the annualized cost using the following general
equation:
where K is the purchase price of the item, r represents the
depreciation rate, and t is the useful-life-year. We assumed
the scrap value of the capital items at the end of the useful
life to be zero.
For equipment and vehicles, we apportioned out capital
costs using the equipment and vehicle use-time (see
above). For buildings, we proportioned capital costs using
the ratio of IDSR personnel time to all HRS personnel
time.
Data analysis
We entered and analyzed the data in a spreadsheet (Micro-
soft Excel 5.0, Microsoft Corp., Seattle), calculating aver-
ages and standard deviations per resource category and
per IDSR activity. We aggregated costs of all HRS and IDSR
activities across all resource categories by health structure
level. Using the estimated total costs for each province
and district included in the study, and population esti-
mates for each included province and district, we calcu-
lated average annual cost per capita per year for all HRS
and IDSR activities. We then used these per capita costs
and the annual population estimates to calculate the total
annual national IDSR program cost in each country. We
also compared the per capita surveillance costs to the per
capita national health expenditures [23].
Missing data
We encountered two types of missing data. The first cate-
gory of missing data involved cost data for some building
structures and equipment. For example, cost data were
missing for approximately half of buildings in each coun-
try. The second category of missing data involved cost data
for the laboratory testing and treatments from Burkina
Faso. To fill in for the structure and equipment cost data,
we used average cost data for similar structures and equip-
ment at other sites (in the same country) as a proxy for the
missing data. For example, when the information neces-
sary to estimate the cost of a specific building was not
available, we used the data for similar ministry buildings
in the same locality or nearby health structures. For the
missing cost data from Burkina Faso, we conducted two
analyses: one by cost category (personnel, transport,
office, etc.) excluding any cost categories for which we had
no data and the other by extrapolating the relevant cost
data from the other countries.
Results
Table 3 summarizes the mean annual costs by resource
categories at the region, district, and primary health care
center level in the three countries. Detailed costs are
shown in Additional file 1, Appendix 3. As expected,
because of larger populations and types of IDSR activities,
regional-level costs were greater in all categories than at
the level of district and primary health care center. How-
ever, the cost of running IDSR at each site varied substan-
tially by resource-type. Since disease surveillance requires
Annualized cost K=+
+−
⎡
⎣
⎢
⎢
⎤
⎦
⎥
⎥
rr
t
rt
()
()
1
11


![Vaccine và ứng dụng: Bài tiểu luận [chuẩn SEO]](https://cdn.tailieu.vn/images/document/thumbnail/2016/20160519/3008140018/135x160/652005293.jpg)