CULTURE AND THE EFFECTIVENESS OF SUPPLIER DIVERSITY PROGRAMS: A TEST OF PREDICTORS by Gwendolyn Whitfield A Dissertation Submitted to the Faculty of The Graduate College in partial fulfillment of the requirements for the Degree of Doctor of Philosophy Department of Sociology Western Michigan University Kalamazoo, Michigan December 2003
UMI Number: 3133550 Copyright 2003 by
Whitfield, Gwendolyn All rights reserved.
UMI Microform 3133550
________________________________________________________
Copyright 2004 ProQuest Information and Learning Company.
All rights reserved. This microform edition is protected against
unauthorized copying under Title 17, United States Code.
____________________________________________________________ ProQuest Information and Learning Company 300 North Zeeb Road PO Box 1346 Ann Arbor, MI 48106-1346
Copyright by Gwendolyn Whitfield 2003
ACKNOWLEDGMENTS
First and foremost, I am thankful to God for giving me the faith, ability, resources
and strength to pursue higher dreams. With God nothing is impossible.
I would like to thank my chair, Dr. Tom Vanvaley and the members of my
dissertation committee, Dr. David Hartmann, Dr. Robert Landeros and Dr. Subash
Sonnad. Thank you for the support, guidance and time you generously provided. I would
also like to thank Dr. Dan Farrell, Dr. Bruce Ferrin and Dr. David Litinsky for the unique
ways in which they helped me frame my research.
Thanks also to Dr. Joseph Cavinato and the Institute for Supply Management for
providing a dissertation grant to help make the completion of this research possible.
Finally, I would like to thank my daughter Mariah and my parents Joe and
Virginia Whitfield for their belief in me and their unwavering love and support.
Gwendolyn Whitfield.
ii
TABLE OF CONTENTS
ACKNOWLEDGMENTS...................................................................................................ii
LIST OF TABLES .............................................................................................................vi
LIST OF FIGURES...........................................................................................................vii
CHAPTER I ........................................................................................................................ 1
Introduction ................................................................................................................................. 1
Supplier Diversity Overview....................................................................................................... 2
Primary Research Questions ....................................................................................................... 4
Theoretical Framework ............................................................................................................... 6
Research Methodology................................................................................................................ 8
Scope of the Dissertation........................................................................................................... 11
Contribution of the Research..................................................................................................... 12
OVERVIEW OF THE RESEARCH................................................................................... 1
CHAPTER II ..................................................................................................................... 13
Introduction ............................................................................................................................... 13
Purchasing and Supply Chain Management.............................................................................. 13
Minority Business in the U.S. ................................................................................................... 17
Supplier Diversity ..................................................................................................................... 22
Organizational Culture .............................................................................................................. 26
LITERATURE REVIEW.................................................................................................. 13
CHAPTER III.................................................................................................................... 30
RESEARCH DESIGN ...................................................................................................... 30
iii
Introduction ............................................................................................................................... 30
Research Propositions ............................................................................................................... 31
Measures ................................................................................................................................... 31
Research Design and Data Collection....................................................................................... 34
Design Issues for Mixed Methods............................................................................................. 35
Sample....................................................................................................................................... 36
Research Methodology.............................................................................................................. 38
Data Collection.......................................................................................................................... 38
Internet-Mediated Research ...................................................................................................... 39
Validity Issues ........................................................................................................................... 41
Reliability Issues ....................................................................................................................... 43
TABLE OF CONTENTS—continued CHAPTER III
CHAPTER IV ................................................................................................................... 45
Introduction ............................................................................................................................... 45
Summary Statistics.................................................................................................................... 45
Analysis at the Organizational-Level ........................................................................................ 50
Results of Factor Analysis......................................................................................................... 58
Results of Reliability Test ......................................................................................................... 59
Analysis for Individual Units .................................................................................................... 59
Humanistic ................................................................................................................................ 59
Qualitative and Quantitative Data Analysis: A Combined Approach....................................... 61
DATA ANALYSIS ........................................................................................................... 45
iv
Data Displays ............................................................................................................................ 62
Results ....................................................................................................................................... 64
TABLE OF CONTENTS—continued CHAPTER IV
CHAPTER V..................................................................................................................... 66
Introduction ............................................................................................................................... 66
Managerial Contributions.......................................................................................................... 66
Academic Contributions............................................................................................................ 67
Limitations of Research ............................................................................................................ 69
Future Research......................................................................................................................... 69
DISCUSSION OF THE RESULTS .................................................................................. 66
BIBLIOGRAPHY ............................................................................................................. 70
v
LIST OF TABLES
Table 1. Types of Cultures .................................................................................................. 9
Table 2. Unit Levels of Spending...................................................................................... 10
Table 3. Minority Population, 2000 .................................................................................. 18
Table 4. Firms by Race and Ethnic Origin, 1997 ............................................................. 18
Table 5. Minority-Owned Firms by Industry, 1997. ......................................................... 19
Table 6. Growth in Number of Minority-Owned Firms, 1982-1997. ............................... 20
Table 7. Description of Culture for Diversity Instrument................................................. 34
Table 8. Buyer Data .......................................................................................................... 37
Table 9. Construct Validity of the 12 Scales of the Organizational Culture Inventory. ... 42
Table 10. Cronbach Alpha Coefficients for Scales .......................................................... 44
Table 11. Scale Means at the Organizational Level.......................................................... 51
Table 12. Factor Analysis for Culture Styles .................................................................... 58
Table 13. Means for Individual Units ............................................................................... 59
Table 14. Aggregate Means for Culture Clusters.............................................................. 60
Table 15. Partially-Ordered Meta Matrix.......................................................................... 63
vi
LIST OF FIGURES
Figure 1. Conceptual Model................................................................................................ 7
Figure 2. Unit Affiliation of Respondents......................................................................... 46
Figure 3. Ethnicity of Respondents ................................................................................... 47
Figure 4. Years with Organization .................................................................................... 48
Figure 5. Gender of Respondents...................................................................................... 49
Figure 6. Educational-Level of Respondents .................................................................... 50
Figure 7. Frequency for Affiliative Scale at Organizational Level................................... 51
Figure 8. Frequency of Achievement Scale at Organizational Level ............................... 52
Figure 9. Frequency for Self-Actualizing Scale at Organizational Level ......................... 53
Figure 10. Frequency for Humanistic Scale at Organizational Level ............................... 54
Figure 11. Frequency of Perfectionistic Scale at Organizational Level............................ 55
Figure 12. Management’s Commitment to Diversity........................................................ 56
vii
CHAPTER I
OVERVIEW OF THE RESEARCH
Introduction
Globalization and cultural diversity are on the rise. According to the Minority
Business Development Agency, the minority population will represent 37.4 percent of the
total U.S. population by the year 2020, and will yield purchasing power of $3 trillion
(MBDA 2000). Moreover, it is estimated that between 2000 and 2050 the majority of
new business starts will originate in the minority community (U.S. Small Business
Administration 1994).
These shifts in U.S. demography will have economic, political and social
implications. For corporations in particular, these trends represent significant changes for
supply chain management. The field of supply chain management is concerned with how
the processes of making, buying and selling goods and services are organized. It is
defined as the integration of people, resources and technology from the raw material
stage to the end-product for users and represents an intertwined, complex production and
distribution network (Leenders et al, 2002).
Firms are also beginning to recognize supply chain management as a viable
source of profit, growth and competitive advantage as companies scramble to cut costs
and increase customer value (Lancioni 2000, McGinnis 1999). One important aspect of
supply chain management is the purchasing function. 1
Purchasing can be defined as preparing and placing purchase orders for
commodities, supplies and services to minimize total cost and maximize value (Cavinato
and Kauffman 2000). According to a 1993 study by The Institute for Supply
Management, two-thirds of the CEO's and Presidents surveyed felt that the purchasing
function was very important to the overall success of the firm (Bales and Fearon 1993).
Purchasing has also been linked to playing a role in corporate strategy formulation and
implementation (Ellram 1995). Purchasing professionals rely on their relationships with
suppliers in order to carry out their purchasing responsibilities and much research has
been conducted about the importance of effective buyer/supplier relationships. We are
beginning to see the impact of wide-spread demographical shifts on supply chain
management and purchasing professional’s relationships with minority suppliers.
(Purchasing 1995 and 1996).
Supplier Diversity Overview
The interest in minority suppliers has risen lately partly because diversity is being
recognized as a key environmental change of the new century. Workforce as well as
business demographics are undergoing dramatic change. For example, from 1987 to 1997
minority businesses grew 168 percent. Currently there are 3.25 million minority owned
businesses that generate $495 billion in sales revenue and employ 4 million people
(NAPM InfoEdge 2001). Minority-owned businesses have clearly become a fast-growing
segment of the U. S. economy, growing from less than 7 percent of businesses in the U.S.
to almost 15 percent by 1997 (U. S. Small Business Administration, 2001). Yet, despite
these robust figures and the economic contributions of minority businesses, little 2
academic research has been conducted about the role of supplier diversity in helping to
support the functioning of the enterprise.
Supplier diversity is defined as a proactive business process that seeks to provide
all suppliers equal access to supply management opportunities (NAPM, InfoEdge 2001).
It promotes supplier participation representative of a diverse business community and
encourages economic development. Although supplier diversity programs have been
around for over 30 years, few have been fully institutionalized, and many have not
succeeded as planned. For example, minority suppliers face higher transaction costs,
experience difficulty in dealing with complex bureaucracy, and had to sometimes operate
in a hostile environment (Dollinger and Dailey 1989). Other major problems include
communication (Krause et. al 1999; Kauffman 2001) and corporate commitment (Krause
et. al 1999). As interest in supplier diversity mounts, it brings with it an opportunity to
increase the amount of scholarly work.
While researchers have noted the importance of corporate culture for
implementing supplier diversity programs (Min 1999; Carter, Auskalnis and Ketchum,
1999), there are no studies about the complexities between culture and supplier diversity.
To date, no empirical research has been conducted to establish a relationship between
culture and supplier diversity. This dissertation research takes an important step toward
establishing the link between a buying firm’s culture and the effectiveness of supplier
diversity programs of that firm.
3
Primary Research Questions
There has been a great deal of discussion about diversity and the prolific growth
of minority-owned businesses in academic literature and the popular press. Increased
workforce and population diversity, and the growth rate of minority-owned businesses
has brought with it unique interdependencies among differing cultures, people and social
systems. The growth rate of minority-owned businesses may present unprecedented
opportunity for firms to use innovative ways of partnering with minority suppliers to
access new markets and adapt to a changing external environment.
Supplier diversity was first introduced to U.S. businesses in the early 1970's in
response to federal legislation. Although the concept of supplier diversity has existed for
over three decades, few minority firms have found their way into the mainstream
processes of buying organizations (Dollinger, Enz and Dailey 1991.) Previous studies
have identified corporate culture as an important component of supplier diversity, but
unfortunately researchers have not conducted any empirical studies that have sought to
operationalize culture. This dissertation builds on the findings of previous studies, and
seeks to provide insight about how organizational culture affects the level of spending
with minority suppliers.
The goal of this dissertation is to investigate the linkage between culture and
supplier diversity effectiveness by answering (a) what types of organizational culture
exist among buying units (b) is there a relationship between a unit’s organizational
culture and the level of spending with diverse suppliers and (c) if there is a relationship,
what is its nature?
4
The question of effective supplier diversity initiatives is an important one to
consider as demographics shift, minority-owned businesses increase, and the challenge of
managing scare resources in an ever-changing global economy escalates. Studies have
shown that supplier diversity may provide unprecedented business opportunities for firms
seeking to enter new markets and for economic empowerment of communities. Supplier
diversity processes can result in job development and economic growth in declining
urban areas, and indirectly they may lead to additional customers for the buying firm
(Saddler 1994). Furthermore, as minority businesses are strengthened, neighborhoods and
cities improve because minority businesses provide jobs for citizens and economic
vitality to the community (Makower 1994). This research makes a scholarly contribution
by investigating the theoretical linkage between organizational culture and supplier
diversity effectiveness.
The culture of organizations is reflected in shared values and beliefs and guides
the behavior of organizational members such as buyers. Culture sets the pattern for
activities such as supplier diversity programs and it influences the personal styles
exhibited by members. In this research, these culture styles range from cooperative and
achievement-oriented to competitive and dependent.
In organizations with constructive cultures, members are encouraged to interact
with others and approach tasks in ways they help them meet higher order needs such as
satisfaction. In passive-defensive cultures members believe they must interact with others
in defensive ways that will not threaten their own security. In aggressive-defensive
cultures, members are expected to approach their work in forceful ways to protect their
status. The behaviors promoted by defensive cultures are generally less productive than 5
those being classified as constructive; moreover, they are less likely to be associated with
the effective management of diversity (Cooke 1995).
The primary purpose of most supplier diversity programs is to increase the
number of diverse suppliers and to improve the amount spent with those suppliers. In
order to determine how well a supplier diversity program is performing, it is imperative
that one consider the level of spending as one indicator of successful programs. This
research defines supplier diversity effectiveness as the level the spending with diverse
suppliers. It is recognized that other factors such are development, supplier perception
and long-term alliances may influence effectiveness, but this research will focus on level
of spending.
Theoretical Framework
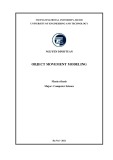
The conceptual model in Figure 1 below displays the theoretical framework for
this research. This conceptual framework will explain the main things that will be
studied, the key constructs, factors and variables, and the presumed relationships among
them.
6
Constructive Cultures for Diversity
High Levels of Spending
Moderate Levels of Spending
Passive-Defensive Cultures for Diversity
Low Levels of Spending
Agressive- Defensive Cultures for Diversity
Figure 1. Conceptual Model
This research will test the theory that level of spending is dependent on the culture
of the buying unit. Constructive cultures should be related to high levels of spending with
diverse suppliers because this type of culture promotes diversity and productive
interpersonal relations among people with different backgrounds. When an organization’s
culture promotes diversity from within, those values will be reflected in the ways in
which buyers interact with external stakeholders such as minority suppliers. If buyers
work in an environment where all people are made to fit in and are valued, they will
reflect those values externally. Likewise, if the internal culture suppresses differences and
does not fully collaborate with people of diverse backgrounds as reflected in defensive
cultures, that attitude will be reflected in relationships with minority suppliers as well.
7
Research Methodology
The research questions were examined using a combination of techniques. A
survey designed to assess organizational cultures for diversity was used as well as
archival research and informal interviews. This integration of research techniques within
a single project has the potential to open up opportunities in all phases of the design, data
collection and analysis processes (Sieber 1992).
The survey measurement instrument, Organizational Cultures for Diversity
Inventory (Cooke 1989), is designed to determine an organization’s culture for diversity
in terms of the behaviors and norms that are expected of members. The inventory
presents a list of statements that describe some of the behaviors and ‘personal styles” that
might be expected or implicitly required of organizational members. Some of the
behavioral norms measured by the inventory promote diversity and productive
interpersonal relationships among people with different backgrounds. Other culture
norms that are measured are dysfunctional and lead to suppression of differences and
personal initiative.
In the Table 1 below, the Organizational Cultures for Diversity Inventory (OCDI)
measures 12 specific cultural norms or normative beliefs that are clustered into three
general types of cultures: Constructive, Aggressive-Defensive, and Passive-Defensive.
8
Constructive
CULTURE: STYLE:
Achievement
Passive-Defensive Approval
Aggressive- Defensive Perfectionist
Self-Actualizing
Conventional
Competitive
Humanistic/Encouraging
Dependent
Power
Affilliative
Avoidance
Oppositional
Table 1. Types of Cultures
As a part of organizational culture, behavioral expectations are considered to be
shared and enduring in nature. The expectations held in common by the members of a
group or organization determines the ways in which all members of the organization are
expected to approach their work and interact with others (Homans 1974). These
behavioral norms are typically considered an important part of groups or organizational
culture because they reflect the basic assumptions and values held in common by
members (Homans 1974; Martin & Schiel 1983; Schein 1985).
At the individual level, the strength of normative beliefs for these styles is
demonstrated by self-reporting the extent to which the behaviors associated with each
style is expected. At the level of shared behavioral expectations, the strength of the norms
is represented not only by members’ reports of the extent to which the behaviors are
required (based on aggregated responses), but also by the extent to which respondents
agree about these expectations. In organizations where there is a great deal of consensus
along these measures, these shared behavioral norms demonstrate a strong organizational
9
culture and a defined pattern of underlying values and ways of seeing things (Sathe 1985;
Kilmann et al. 1986; Cooke & Rousseau, 1988).
The effectiveness of supplier diversity was measured using archival methods and
was based on the amount of spending and the percentage of spending with diverse
suppliers. The idea underlying this research is that units that have constructive cultures
will value individual differences and consequently have effective supplier diversity
programs. On the other hand, defensive cultures suppress differences and don’t value
diversity.
The informal interviews and archival research revealed that it was possible for the
23 individual buying units within the firm to have different levels of spending with
diverse suppliers. As shown in Table 2, the units have minority-spending ranging from
UNIT
MINORITY SPENDING (Percentage of Total)
LEVEL (For Comparison)
2 4 5 1 2 8 7 3 6 9 11 10
22% 4.5% 3.6% 3.4% 3.0% 2.00 2.5% 2.5% 2.3% .6% .9% 1.4%
High High High High Moderate Moderate Moderate Moderate Moderate Low Low Low
Table 2. Unit Levels of Spending
less than one percent to twenty-two percent.
10
In an effort to distinguish variation in minority spending, the units were placed in
categories for the purpose of comparison. Eleven out of the twelve units had spending
levels under 5 percent. The unit with 22 percent spending could be considered an outlier.
The cut off points were determined by grouping numbers that were as close together as
possible.
Units with 3.4-22% minority spend were considered to have high spending levels.
Units with spend from 2-3.3% were considered to have moderate spending levels, and
units with less than 2% were considered to have low levels of spending in supplier
diversity. A sample of three to five units at each spending level was targeted. There were
23 units overall. Table 2 identifies the twelve units that comprise the sample. This
includes three units with high spending levels, five units with moderate and three with
low.
Scope of the Dissertation
The concepts in Figure 1 are not all inclusive. All of the relevant factors and
linkages that influence effective supplier diversity programs have not been identified.
This dissertation will investigate the presence of a relationship between cultures for
diversity in a multi-unit organization and the levels of supplier diversity spending within
those units. This dissertation will not investigate other factors such as buyer’s personal
bias that may influence supplier diversity effectiveness beyond culture.
11
Contribution of the Research
Although there are issues that this dissertation will not examine, what this
research does investigate is important for several reasons. First, the proliferation of
minority business growth and population increases has created new challenges and
opportunities for competing and managing resources. Second, little academic research
had been conducted in this area and the need for understanding supplier diversity is
important because of the new competitive landscape within which firms operate. Third,
while culture has been casually linked to supplier diversity, it has not been empirically
tested. This dissertation will take a critical step towards investigating the theoretical
linkages between a firm’s culture and the success of supplier diversity programs. The
primary purpose is to uncover the cultural reality of each unit in the firm, determine the
effectiveness of their supplier diversity program and analyze the relationship between
organizational culture and supplier diversity effectiveness.
12
CHAPTER II
LITERATURE REVIEW
Introduction
This research spans a number of different areas that are both distinct and
interrelated. Literature reviews were conducted in purchasing, supply management,
minority businesses, supplier diversity and organizational culture. The reviews revealed a
number of interesting trends and environmental factors that present challenges and
opportunities for firms seeking competitive advantage.
Purchasing and Supply Chain Management
Today, a typical manufacturing firm procures thousands of products from
hundreds of suppliers, resulting in a complex procurement process. Purchasing, as a
business function, has a significant impact on many key components of a firm’s
operations such as acquisitions, raw materials, invoicing and logistics. The purchasing
function helps to create a competitive advantage by developing successful relationships
with suppliers and internal clients. These strategic relationships help improve new
product development, speed up market cycle times, drive out costs from both the firm and
their suppliers’ operations, and achieve strategic financial results (Wisner and Tan 2000).
13
A buyer is a purchasing professional who understands the industry in which he
competes and manages resources and relationships to achieve organizational goals such
as getting the right products at the right time for the right prices. Buyers achieve these
outcomes through effective negotiations and contracting, practices which have evolved
dramatically over the last 90 years.
It is difficult to establish, with complete accuracy the first occurrence of
commercial negotiations, however, early negotiations can probably be traced back to
transactions along the Chinese trading route. By the 1920’s, the principal function of
purchasing was to buy for less, with the initial first cost being the primary function for
many firms (Cavinato 2000). The oil shock of the 1970’s, however, resulted in significant
changes in the development of supply chain planning and shifted the focus from buying
for less to the total cost of ownership (Cavinato 2000).
Many firms reacted to this shift with a short-term focus in order to ensure cost,
reliability and continuity, resulting in win/lose negotiations with suppliers. Soon,
however, buyers realized that more cooperation and collaboration was needed to achieve
continuous improvements. The need for total cost to market improvements and
responsiveness to markets, and the need for increased levels of integration and
collaboration among suppliers and purchasing firms, gave rise to the term “strategic
purchasing”. Today many say that purchasing has evolved into supply chain
management, which implies a broader range of responsibility as well as many layers of
negotiation.
14
For the purposes of this dissertation, supply chain management has been defined
as the integration of supply chain activities to achieve sustainable competitive advantage
(Handfield and Nichols 1999). It integrates several key functions including purchasing.
While the concept of supply chain management may still be evolving, the term was
initially coined to describe the integration of logistics and physical distribution functions
used in wholesaling and retailing to reduce delivery lead times. A widely accepted
approach to supply chain management is an integrated one whereby within firm and
between firm integration is emphasized in order to provide value to the end user.
Manufacturers and service providers are now using the term to describe
integration efforts and collaboration between buyers and suppliers. Overall, however, it
can be said that the goals of integrating supply chain activities are to reduce cost and to
improve quality and delivery timing, which requires good relationships with suppliers.
The concept of the supply chain management appeared in literature only as
recently as the 1980’s. However, the assumptions that support the concept can be traced
back to the 1960’s when the flow of materials began receiving a lot of attention.
Researchers and practitioners recognized the linkages that exist in the supply of materials
and the flow of information. They began to consider all members in this chain as
critically important. The short-term objective of supply chain management is
concentrated primarily on increasing productivity and reducing inventory and cycle
times. The long-term goals are more strategic in nature and include customer satisfaction,
increased market share and profits.
15
Purchasing is a critical link in the chain because it connects the sources of supply
with the organization. For example, if suppliers are involved early in production design,
manufacturers can select the best and most economical components, materials and
technologies from alternatives (Burt and Soukup 1985). Further, supplier involvement in
product design and continuous improvement activities can have a positive impact on
competitive advantage and firm performance (McGinnis and Vallopra 1999;
Vonderembse and Tracey 1999).
The term “supply chain management” is a new management philosophy that fully
enables firms to compete in an evolving landscape. The intensity of global competition
and the gaining popularity of the Internet as a business tool has created a competitive
environment dominated by low cost, high quality products and services in a highly
innovation competitive environment. Manufacturers have had to incorporate supplier
strengths and technologies in new product development into their processes (Morgan and
Monczka 1995). Hence, supply chain management has been adopted to conceptualize the
focus on integrating and partnering with suppliers, and integrating the logistics and
transportation functions to effectively manage the supply chain.
A great deal of the recent literature on supply chain management focuses on
integration processes and supplier alliances to create customer satisfaction and realize
business goals (Carter 2000). The increased need for supplier integration and partnering
has important implications for supplier diversity since it is estimated that the majority of
new business starts will originate in the minority community. It will become increasing
16
important for firms to develop partnerships with a diverse base of suppliers in order to
compete in the newly emerging landscape.
Minority Business in the U.S.
The force of minority businesses has changed dramatically in the last 20 years.
Minorities owned fewer than 7 percent of all firms in the U.S. in 1982, but by 1997 this
number soared to 15 percent. Minorities owned more than 3 million businesses in 1997
and generated more than $591 billion in revenues. Of that 15 percent, 5.8 percent were
owned by Hispanics, 4.4 percent by Asians, 4.0 percent by Blacks and 0.9 percent by
Native Americans. Of minority owned businesses, 39.5 percent were Hispanic-owned, 30
percent were Asian-owned, 27.1 percent Black-owned, and 6.5 percent American Indian-
owned. What has led to this prolific business growth? In part, it can be explained by
recent demographical trends.
As the 2000 census figures in Table 3, page 18, indicate, minorities comprised
30% of the U.S. population. During the later part of the last century, many Asians and
Hispanics immigrated to the U.S., and some apparently brought an entrepreneurial spirit
along. Table 3.0 shows that in 1997, about 15 percent of the firms in the U.S. were owned
by minority business owners. This is up from just seven percent in 1982.
Like other businesses, minority-owned businesses produce goods and services,
make innovative contributions, create jobs, provide wages and contribute to the support
of government through taxes. These are important businesses activities that contribute to
the health of the American economy.
17
Race/Ethnic Group Population Population Percent
All U.S. Non-Minority All Minorities Black Hispanic Native American Asian
100.0 69.1 30.9 12.3 12.5 0.9 3.78
281,421,906 194,552,774 86,869,132 34,658,190 35,305,818 02,475,956 10,641,833 Table 3. Minority Population, 20001
FIRMS BY NUMBER FIRMS BY PERCENT
Total U.S. Firms
20,821,934
100.0
Non-minority Owned
17,782,901
85.40
All Minority-Owned
3,039,033
14.60
Black-Owned
823,499
3.96
Hispanic-Owned
1,199,896
5.76
Native-American-Owned
197,300
0.94
Asian-Owned
912,959
4.38
Table 4. Firms by Race and Ethnic Origin, 1997 2
Minority-owned firms were represented well in many industries in 1997 as
displayed in Table 5. At the national level, the largest proportion of businesses was in the
services industry (42.7 percent). Following the service industry is retail trade (14.0),
construction (11.2 percent), and finance and insurance (10.8). Hispanic-owned businesses
were distributed similarly to the average business distribution. Black-owned businesses
were more heavily concentrated in the transportation, communications, public utilities
1 The percentages may not sum to 100 because some people classify themselves as bi-racial (US Dept. of Commerce, Bureau of Census, Population Data 2000). 2 The percentages may not sum to 100 because Hispanics may be of any race and may be double counted. (US Dept of Commerce, Bureau of Census, 1997). 18
and service sectors. A good proportion of the Native-American-owned firms were
concentrated in agricultural, construction and manufacturing industries. Asian-owned
firms tended to have greater than average proportions in the retail, wholesale and services
Major Industry Total Black Hispanic Native America Asian
All
100.0 3.95
5.76
0.95
4.38
Agriculture
2.38
1.51
3.34
4.53
1.42
Mining
0.61
0.03
0.16
0.48
0.07
Construction
11.21 6.86
12.72
13.91
3.04
Manufacturing 3.31
1.27
2.13
3.40
2.55
Transportation 4.42
8.69
7.05
3.19
4.11
Wholesale
3.83
.99
2.62
2.21
5.52
Retail
13.87 10.63 12.92
7.49
21.43
Finance
10.75 4.61
4.72
2.34
7.53
Services
42.70 53.14 41.71
17.31
44.47
Unclassified
7.11
12.28 12.66
45.23
9.91
Table 5. Minority-Owned Firms by Industry, 1997.
industries.
The number of minority-owned businesses has grown dramatically since 1982, as
shown in Table 6. Minority-owned firms increased at rates from three to seven times
those of non-minority owned firms, by 55 percent from 1982 to 1987, 68 percent between
1987 and 1992 and 30 percent from 1992 to 1997. One reason for the growth in minority-
owned firms is the rate of minority population growth. In addition, the minimal growth
19
rates of non-minority owned firms match the low growth rates of the non-minority
FIRMS
GROWTH RATES (Percent)
1982-1987
1987-1992
1992-1997
All U.S. Firms
14
26
7
Non-minority Owned
11
22
4
All Minority-Owned
55
68
30
Black-Owned
38
46
26
Hispanic-Owned
73
76
30
Native American-Owned
46
310
84
Asian-Owned
72
46
30
Table 6. Growth in Number of Minority-Owned Firms, 1982-1997.3
population.
Table 6 also shows the rapid business growth that occurred across minority
groups. Black-owned businesses increased their numbers by 38 percent from 1982 to
1987, by 46 percent from 1987 to 1992, and by an additional 26 percent from 1997-1992.
The 15-year growth rates for Hispanic-owned businesses were 73 percent, 76 percent and
30 percent. Asian-owned businesses increased by 72 percent, 46 percent and 30 percent
over the same three periods. The most noticeable percentage increases were in Native
American-owned businesses, which grew at about nine times the rate of U.S. firms
overall. It is estimated that these businesses grew 47 percent from 1982 to 1987, 310
percent from 1987 to 1992, and 84 percent from 1992 to 1997.
3 Source: U.S. Small Business Administration, Office of Advocacy, based on data from U.S Dept. of Commerce, Survey of Minority-Owned Business Enterprises. 20
The prolific growth in Native American-Owned firms appears to reflect strong
growth from a comparatively small base of firms. The growth may be attributable, in
part, to specific government policies supporting business growth. The 1988 Indian
Gaming Regulatory Act made it possible for federally recognized tribes to legally run
casinos on Indian lands.
In the black community, business growth exceeded population growth over the
three periods listed. The growth in Black-owned businesses may reflect increased
opportunity, greater equality, better education, and government policies and laws.
Activism for greater equality in government contracting processes, and the civil rights
movement pushed African Americans toward greater equality in business opportunities
and resulted in the creation of supplier diversity programs to facilitate relationships
between minority-owned firms and larger corporations.
Minorities made up about 30.9 percent of the total U.S. population in 2000 but
owned just 15 percent of all businesses in the U.S. in 1997. Blacks and Hispanics were
underrepresented in the minority business population: Hispanic Americans accounted for
12.5 percent of the population in 2000, but owned only 5.8 percent of the U.S. firms in
1997 while Blacks, comprised 12.3 percent of the U.S. population but only 4 percent of
business owners. On the contrary, Asians and American Indians had business
representation equal to or greater than their population numbers. American Indians and
Alaska Natives constitute 0.9 percent of the population and 0.9 percent of businesses,
while Asian and Pacific Islanders constitute 3.6 percent of the population and 4.4 percent
of businesses.
21
Clearly minority-owned businesses have become a fast growing segment of the
U.S. economy. The minority-owned business population grew dramatically since the
1980’s, more than doubling their share of U.S. firms. The fast growth rate of Hispanic-
owned businesses corresponds with the fast growth of that population, and growth in both
is expected to continue. The significant growth rate of Native American-owned
businesses may be the result of a low initial rate of business ownership and or strong
governmental support. Despite the strong growth rates for Hispanic and Native American
business owners, blacks remain the least represented in the U.S. business sector as
reflected in the number of black-owned businesses, the dollar value of Black-owned
business receipts per Black population and survival rates of new businesses owned by
Blacks when compared with other business groups (U.S. Small Business Administration,
2001)
Supplier Diversity
As a strategy to attract a diverse supplier base and possibly gain additional market
share, many buying firms have established supplier diversity programs. A supplier
diversity program is a proactive business process that seeks to provide suppliers equal
access to supply management opportunities (NAPM, InfoEdge 2001). It promotes
supplier participation representative of the diverse business community and encourages
economic development. For example, firms with supplier diversity programs develop and
implement processes aimed to seek out diverse suppliers. The purpose of these programs
22
may include developing new suppliers, strengthening the minority business community
and or corporate social responsibility.
But despite their salutary goals, not all supplier diversity initiatives have
succeeded as planned. The small amount of research conducted on supplier diversity has
focused mainly on problems and secondarily on best practices (Giunipero, 1980;
Dollinger and Dailey 1989; Dollinger, Enz and Dailey 1991; Krause, Ragatz and Hughley
1999). The trade literature in periodicals such as Purchasing Magazine has also centered
primarily on the problems in supplier diversity (Purchasing 1994).
A study conducted by Dollinger and Dailey in 1989 found there were major
impediments to successful transactions between large corporations and minority suppliers
and that there were many differences between minority suppliers and non-minority
suppliers. For example, minority suppliers do not face the same conditions and
transaction costs as non-minority suppliers and corporate purchasing personnel.
Transaction costs are the administrative costs of doing business (opportunity costs, small
numbers, business uncertainty, negative atmosphere, etc.). Additionally, the study found
that minority suppliers experienced difficulty in dealing with the complex bureaucratic
nature of large purchasing units and sometimes have to deal in a hostile and unfriendly
environment.
Minority suppliers also have to contend with insuring the survival of their
businesses and maintaining quality performance. Dollinger and Dailey’s study also found
that many minority suppliers experienced difficulty marketing their businesses to the
purchasing firm and had problems sending and receiving critical business information. In
23
addition, the study revealed that minority suppliers tended to favor multiple criteria for
evaluation at higher rates than did buyers. In other words, minority suppliers wanted to be
evaluated in several areas as opposed to a single area. Buyers were also less enthusiastic
about corporate programs aimed at identifying, developing and training minority
suppliers than were the buyer’s managers and other senior-level personnel. These finding
confirmed results from an earlier study that compared differences between minority and
non-minority suppliers (Giunipero 1980).
Early on, the problems that were identified were lack of minority vendors to
supply products, lack of minority vendors near operating units, and lack of qualified
engineering, management and sales personnel in minority firms (Giunipero 1980). An
additional problem identified was the unjustified perception that conducting business
with minority suppliers resulted in lower quality products. The results showed that poor
quality ranked low as a problem buyers experienced with minority suppliers. The
research also disclosed that firms that acknowledged the problem differences between
minority and non-minority suppliers had more successful supplier diversity programs.
This implies that specific issues with minority firms could be quickly defined and
remedied.
Nearly two decades later, research was conducted from the perspective of the
minority supplier (Krause, Ragatz and Hughley 1999). This study sought to gain insight
about what might undermine a buying firm’s supplier development efforts with minority
suppliers. Supplier development was defined in this study as the effort a buying firm
expends in order to increase supplier performance and capabilities to help meet the
24
buying firm’s supply needs (Krause 1997). The study revealed that minority suppliers
with smaller sales volume and less dependency on the buying firm gave lower ratings to
the effectiveness of supplier development programs and perceived less corporate
commitment from the buying firm. Both large and small suppliers felt the buying firm
used minority suppliers for governmental compliance and reporting purposes only and
felt powerless to negotiate with buyers. Results were neutral in response to a statement
about racial biases hurting minority supplier development programs. In terms of the
effectiveness of the supplier development program, the minority suppliers did not feel
that supplier development programs reduced obstacles to doing business with the buying
firm.
Another finding identified in Krause’s 1999 study was the need for improvement
in communication. Specifically, suppliers with smaller sales volume felt they experienced
difficulty advertising their products, and obtaining information about the buying firm and
their bidding process. Those with shorter-term business relationships with the buying
firm also felt that it was difficult to obtain bidding information. Research conducted as
recently as 2001 also points to the importance of communication systems for successful
supplier diversity programs (Kauffman 2001).
The stream of research related to best practices cites the importance of top
management commitment as a key success factor for supplier diversity programs
(Gumpert 1979; Giunipero 1981; Kauffman 2001; Min 1999; Carter, Auskalnis and
Ketchum 1999.) Top management commitment includes, for example, direct
communication with suppliers and attendance at prominent conferences and meetings.
25
Other success factors that were cited in the studies included goal setting, dedicated
resources and personnel, effective feedback, rewards and adequate evaluation processes.
Min’s 1999 study stressed that many points of integration need to be monitored such as
operational processes, procedures, practices, and interfaces, as well as communication
systems. The research concluded that corporate culture should encourage buyers to view
supplier diversity as an ingrained way of doing business, but it falls short of providing
any insight about how this can be accomplished.
The purpose of this dissertation is to examine how organizational culture
influences the effectiveness of supplier diversity programs. This is an important
contribution to supply chain literature because it will seek to confirm the recent research
finding that misaligned corporate culture is a potential obstacle for implementing a
supplier diversity program (Min 1999).
Organizational Culture
Organizational culture is an important consideration for firms seeking to adapt to
external forces such as the changing demographics and supplier diversity issues outlined
in the previous chapters. A successful firm manages its organization by adapting itself to
the external environment and translating those adaptations into behavioral expectations
for organizational members. For example, as a firm develops and copes with the issues
related to changing demographics, members of the firm learn how to view and adapt to
increased diversity.
26
In the 1980’s, scholars began to recognize the importance of organizational
culture in the field of organizational behavior. We saw a major emphasis in theoretical
modeling and empirical research on this topic (Hofstede 1986; Jelinek, Smircich and
Hirsch 1983; Kilmann, Saxton, and Serpa 1985; Sathe 1983). Although interest in the
area of organizational culture grew in the 1980’s, no strong consensus among behavioral
scientists and practitioners has been developed about a definition of this concept.
Ed Schein, however, was especially influential as management scholars began
adopting the concept of culture. Schein was influential because he, more so than others,
articulated a conceptual framework for analyzing the culture of organizations (Hatch
1993). Schein defines culture as the shared values, beliefs and assumptions that shape and
guide social systems, group relations and communication processes (1992). Schein
claimed that beliefs and values are taught to new members and if validated by success,
undergo cognitive transformations into assumptions. He also believes that culture is
embedded into environments and that through culture organization members are taught
about the organization's preferred values, beliefs, expectations and behaviors (Schein
1983).
Schein believes there are three basic functions that organizational culture
performs (1985):
1. 2.
Survival in and adaptation to the external environment Integration of its internal processes to ensure the capacity to continue to survive and adapt Anxiety reduction
3. According to other scholars, culture, conceived as shared values and beliefs,
fulfills several other functions. First it creates a sense of identity for organizational
27
members (Deal and Kennedy 1982). Second, it generates commitment to macro-ideas
(Martin and Siehl 1983; Peters and Waterman 1984). Third, culture enhances social
system stability (Louis 1982) and lastly, it can serve as a sense-making device to guide
and shape behavior (Louis 1982; Meyer 1981; Pfeffer 1981; Martin and Siehl 1983).
Moreover, organizational culture may be a lever or key by which strategic managers can
influence and direct the course of their organizations (Tichy 1982). The belief is that
firms that have internal cultures that are supportive of their strategies are more likely to
be successful (Smircich 1993).
Scholars have acknowledged that there may be multiple organizational
subcultures, or even countercultures, competing to define the nature of the organization.
For academics, culture provides a conceptual bridge for micro and macro levels of
analysis, as well as a bridge between organizational behavior and strategic interests
(Smircich 1993).
In addition, interest in the topic of culture by practitioners can be seen by the
success of books stressing the cultural determinants of corporate performance (Deal and
Kennedy 1982; Ouchi 1981). In studies of difficulties in strategic implementation, and
comparisons of the performance of American firms with that of European and Japanese
competitors, researchers began to include the concept of culture as a plausible
explanation for the differences in effectiveness when few structural characteristics of the
organizations were visible (Pascale and Athos 1981).
This dissertation seeks to uncover how an organization’s culture for diversity
shapes buying behavior and consequently influences the firm’s ability to adapt to
28
changing external forces of changing demographics. The research argues that firms that
have cultures that promote diversity will have effective supplier diversity programs.
29
CHAPTER III
RESEARCH DESIGN
Introduction
In 2002, this research framework was presented to several organizational
members attending an Executive Council meeting of the Integrated Supply Management
Program at Western Michigan University. This council is comprised of business
executives and academics that meet regularly to advance the curriculum of the Integrated
Supply Management Matrix Program in the Department of Management at Western
Michigan University. The business executives assist with developing the curriculum,
recruiting students, and identifying internship and career opportunities in the supply chain
management field. It has included representatives from such organizations as
DaimlerChrysler Corp., Ford Motor Co., Harley-Davidson Motor Co., Haworth Inc.,
Johnson Controls, Kellogg Co., Pharmacia Corp., and Stryker Corp. and others.
One firm from the Executive Council had recently begun efforts to improve their
supplier diversity program. This firm expressed a particular interest in participating in
this dissertation research. Interviews were conducted with two managers from the firm to
discuss organizational structure, supplier diversity issues and information requirements.
Based on the interviews with managers, the researcher believed their firm would
be an excellent object of study because of the many buying units that existed within the
30
firm. Similar to much of the past research in supplier diversity, one firm from a single
industry was chosen for this dissertation. Focusing on a single industry controls for the
variance that may result from specific industry conditions. However, in order to
generalize outside of this specific firm, other firms in the industry would need to be
studied.
Research Propositions
This research’s first proposition is that there are different cultures within the
buying units of this firm, and levels of spending with diverse suppliers will vary with an
individual unit ‘s culture. The second proposition is that the presence of a constructive
culture will be associated with high levels of spending with diverse suppliers. The third
proposition is that the presence of a passive-defensive culture will be associated with
moderate levels of spending with diverse suppliers. The fourth proposition is that the
presence of an aggressive-defensive culture will be associated with low levels of
spending with diverse suppliers.
Measures
A preexisting measure, Cooke’s Culture for Diversity Inventory, was identified
and adapted. This self-reporting attitude scale measures 12 sets of normative beliefs.
Each of the 12 styles is measured by ten items describing behaviors that might be
expected or implicitly required of members in the organization under study. On a Likert
scale, respondents are asked to indicate the extent to which the particular behavior “helps
people fit it” and “meet expectations” in the organization. There are multi-item scales for 31
each construct. The scale is 1 to 5 with 1 representing ‘not at all” and 5 representing ‘to a
very great extent’. Scale scores range from 10 to 50. In addition to an overall aggregate
culture for the firm, responses from members within each of the twelve units will be
determined by taking an average of the cultural profile for each unit. In other words,
scores for each of the twelve styles with be averaged for each unit to determine the
culture type of the individual units.
The inventory is being used to measure shared and enduring behavioral
expectations as well as individual normative beliefs. Shared behavioral expectations are
those normative beliefs that are held in common by members of a group or organization.
(Homans 1974) According to Cooke and Szumal (1993), as components of organizational
culture, behavioral expectations are considered to be shared and enduring in nature.
These expectations specify the ways in which members of an organization are expected
to approach their work and interact with others. The shared behavioral expectations in the
measure are associated with three general types of cultures: Constructive, Passive-
Defensive and Aggressive-Defensive.
Empirical justification for grouping the styles into the Constructive, Passive-
Defensive and Aggressive-Defensive clusters is provided by extensive research on the
Life Styles Inventory upon which Cooke’s measure was based (Cooke & Szumal 1993).
Studies based on principal components analysis, cluster analysis and smallest space
analysis have identified these three underlying factors or empirical clusters (Cooke &
Lafferty 1982/1989). Clinical analysis of organizations, studies based on critical incidents
methods, and statistical analysis of earlier versions of the culture inventory support the
clustering norms for these styles into three categories (Cooke & Fisher 1985, Gundry 32
1993, Cooke & Rousseau 1988). As outlined in Chapter 4, the results of this research also
support the clustering norms for these styles.
The instrument has 120 questions designed to assess 12 types of constructs in
three broad culture categories:
Constructive Cultures:
Reflects an organization that promotes diversity, productive interpersonal
relations among people with different backgrounds, and the
accomplishment of individual and organizational goals.
Passive-Defensive:
Reflects an organizational culture that emphasizes differences but does not
integrate diverse groups and individuals in a collaborative manner.
Aggressive-Defensive:
Reflects a culture in which behavioral norms suppresses diversity,
individual differences and personal initiative.
As noted in Table 7, page 33, constructive cultures exist when organizational
members are encouraged to interact with others to meet higher-order satisfaction needs.
In aggressive-defensive cultures, members are expected to approach tasks in forceful
ways to protect their status and security. Members in passive-defensive cultures believe
they must interact with people in ways that will not threaten their own security.
33
Culture Type
Culture Style
Description
Constructive
Achievement
Self-Actualizing
Members are encouraged to interact with others to meet higher-order satisfaction needs
Humanistic/Encouraging
Affiliative
Passive-Defensive
Approval
Conventional
Members believe they must interact with people in ways that will not threaten their own security
Dependent
Avoidance
Aggressive-Defensive Oppositional
Power
Members believe they are expected to approach tasks in forceful ways to protect their status and security
Competitive
Perfectionistic
Table 7. Description of Culture for Diversity Instrument
Research Design and Data Collection
Data was collected using a mixed methods approach. A survey was conducted to
measure the attitudinal constructs associated with Cooke’s Cultures for Diversity
Inventory. A survey was selected for collecting culture data because no published studies
have been done to empirically test propositions associated with organizational culture and
supplier diversity. Empirical research of this nature is necessary if supplier diversity is to
be fully evaluated and understood. Although culture has been identified as being
important, no empirical tests on culture and supplier diversity have been published as of
yet. Currently, supplier diversity research has focused on best practices and problems.
Archival research and personal interviews was conducted to collect data on the
effectiveness of the firm’s supplier diversity programs. Informal personal interviews were
34
conducted with the Director of Supplier Diversity and the Manager of Corporate
Relations at this firm. The archival data collected from organizational records, web sites,
and supplier diversity program material. Information researched included data on
numbers of buyers and minority suppliers, amount of spending with minority suppliers at
each unit, percentage of total spending contracted with minority suppliers and training
and development conducted with minority suppliers.
Design Issues for Mixed Methods
Over the last three to four decades we have seen research designs incorporating
both quantitative and qualitative orientations. These approaches were developed in
several fields, and they were, to a large degree, an outgrowth of the popularization of
triangulation methods (Tashakkori and Teddlie 1998). Denzin, in 1978 applied the term
triangulation in a book on sociological methods, referring to the concept as a method of
combining data sources to study the same social phenomenon. He discussed four types of
triangulation:
1. 2. 3.
4. Data Triangulation- the use of a variety of data sources in a study. Investigator Triangulation – the use of several different researchers. Theory Triangulation – the use of multiple perspectives to interpret the results of a study. Methodological Triangulation - the use of multiple methods to study a research problem.
Authors from multiple fields initially defined mixed methods designs under the
general heading of method triangulation, but mixed method designs now serve purposes
beyond triangulation (Tashakkori and Teddlie 1998). According to Tashakkori and
35
Teddlie, the term mixed methods typically refers to both data collection and data
analysis.
This research involves using a variety of sources to collect data as well as
quantitative and qualitative methods for analyzing the data. The data on effectiveness of
supplier diversity was categorized using deductive analysis and coding. The larger set of
data was deduced down to three categories based on levels of spending. Each of the
twelve units was then coded as having low, moderate or high levels of spending. The
survey was analyzed using factor analysis and clustering. Both sets of data were then
included in a partially-ordered meta-matrix for further analysis.
Sample
A list of buying units was obtained from the firm. The list represented
approximately 23 units and 200 buyers. In order to control the size of the sample, a
stratification technique was used to reduce the number of units in the sample. Based on
the design of the research in this case, it was practical for the sample to be stratified in
order to test the hypothesis (Crano & Brewer 2002). The 23 units were stratified into
three groups according to spending levels. A sample of 3-5 units from each group was
randomly selected for the sample.
The buying units were grouped according to their level of spending with diverse
suppliers to make comparisons. The spending levels were identified as high, moderate
and low. Spending levels were based upon the natural variance in the spending amounts.
As indicated earlier, sampling units were chosen randomly from within each stratum.
36
Three to five units from each stratum were selected, although the number of buyers in
each of the units varied.
Once the sample population from the buying units was identified, the supplier
diversity coordinators at each unit was contacted and asked to provide a list of the names
and e-mail addresses of all of the buyers in their units. The final target sample was 112
buyers from 12 buying units. As noted in Table 7 below, the number of suppliers at each
NUMBER OF BUYERS
DIVISION
1 9 13 11 16 7 10 17 9 7 11 1 112
NUMBER RESPONDING TO SURVEY 4 9 4 9 13 1 9 5 9 9 5 2 79
1 2 3 4 5 6 7 8 9 10 11 12 TOTAL Table 8. Buyer Data
site ranged from 1 to 12 with an average of 9 buyers per division.
The unit of analysis is the division. The unit level is where implementation of
supplier diversity programs occurs and unit-level analysis may provide meaningful
information to draw conclusions and make reasonable inferences. Where possible,
information was gathered from multiple respondents from each division to minimize the
potential for bias from a single respondent.
37
Research Methodology
The primary goal of this dissertation is to specify the nature of the relationship
between the two variables of interest; culture and supplier diversity effectiveness. A
simple two variable relationship was chosen in order to have a good understanding of the
scientific results on the phenomenon. According to Crano & Brewer (2002), techniques
of quantitative synthesis are most effective when they are focused on a relationship
between variables that can be specified with a high degree of precision (usually two).
This research begins with a specific hypothesis linking culture with supplier diversity
effectiveness and future research will explore the moderating or mediating effects of
other variables such as communication and community involvement.
In order to determine the significance of the relationships in the model, it was first
determined whether there was a sufficient level of validity and reliability with the
measure. Crano & Brewer (2002) have pointed out that constructs must be un-
dimensional and reliable before assessing the relationships between them. Therefore, in
this study each first order factor was tested for internal reliability by running a reliability
test using Cronbach’s Alpha. A factor analysis was performed to determine the
correlations and factor loadings of the constructs.
Data Collection
A survey questionnaire was selected because of the structure it provides. A
structured data collection method was desirable in this research in order to have
consistency across 12 buying units. The survey had structured stimuli structured
responses. An Internet-mediated approach was used to administer the survey. Just prior to 38
the survey being sent, the corporate manager at the firm was asked to send an e-mail to
the target sample to notify them that a survey was coming and to encourage their
participation.
The survey (via Internet link) was sent a week later and included a cover letter
that explained the purpose of the survey and what the participating firm hoped to
accomplish. The participants were asked to complete the survey in 10 days. At the end of
the 10 day period, a reminder email was sent to all participants who had not responded
and they were given an additional 5 days to complete and return the survey. A final email
was sent to participants on the last day reminding them that the Internet link would be
closed at midnight. In total, there were 79 surveys returned for a 70.5% response rate as
indicated in Table 8.
Internet-Mediated Research
The Internet is gaining popularity for use in conducting primary social scientific
research. Internet-mediated data collection as several advantages compared with
traditional ways of administering a survey questionnaire. First, the Internet dramatically
improved the time and cost efficiency of the research. The costs of postage and printing
and was eliminated, and the time and cost of data collection was reduced. Second, the
Internet survey reduced the time associated with converting the data into a usable format.
The respondents sent data directly to a database, eliminating the time-consuming tasks
and potential errors of data entry. Non-respondents were easy to identify and it was time
efficient to send reminders via e-mail. Third, participants were able to complete the
process at a time that was convenient for them. Finally, there is novelty value of 39
responding to an Internet-based survey, which may have enhanced its appeal to
prospective participants (Hewson et. al. 2003) The Internet-based approach allowed large
numbers of participants to be contacted with less time and expenditures, while still
allowing for anonymity.
The Internet is a newer medium for conducting research. Very little information
about published empirical investigations of Internet survey methodology exists. There
have been many issues raised about how Internet survey response rates compare with
postal mail response rates. The main empirical findings show that sending an initial
participation request message can increase response rates (Smith and Leigh 1997). Also,
Internet surveys have been found to be more time consuming than paper and pencil, by
virtue of the medium, and consequently survey length may be a factor in response rates.
(Smith and Leigh 1997)
There is support for the validity of Internet sampling procedures and it comes
from studies that have compared data from Internet and non-Internet samples. Buchanan
and Smith (1999) administered a personality test to an Internet and non-Internet sample
and found that both sets of data displayed similar psychometric properties. Stanton
(1998) also conducted a study which used company employees and found similar
psychometric properties of a survey instrument administered to both Internet and non-
Internet samples.
A common assumption is that the Internet-user population is not representative of
the general population. However, the sample population in this dissertation research is
buyers at the target firm. The sample was not obtained on a random volunteer basis, but
rather was identified from a narrow predetermined population. 40
Validity Issues
Construct validity refers to the question of whether a measure yields results
consistent with theoretical predictions about the construct being measured. When a new
measure yields results that confirm theoretical predictions, both the construct validity of
the measure and the validity of the theory are strengthened. Construct validity can be
divided into two categories: convergent validity is demonstrated by substantial positive
correlations between different measures of the same construct; and discriminant validity
is simultaneously demonstrated by near-zero correlations between different constructs
measured by the same method. Table 12 shows the construct validity of the 12 scales
measured by this inventory.
The factor analysis shown is generally supportive of the construct validity of the
inventory. As noted, the analysis identifies a three-factor solution –Constructive,
Aggressive-Defensive, Passive-Defensive which together accounts for 72.9% of the
variance in scale responses and strongly supports the construct validity of the
constructive scales.
The results for construct validity based on factor analysis indicate that the
inventory does indeed measure what it is designed to measure. The factor structure of the
instrument seems to be acceptable, with the scales consistently loading on three factors
corresponding to Constructive, Passive-Defensive and Aggressive-Defensive. The scales
that show dual loadings (conventional, avoidance, oppositional, perfectionistic) may
41
Constructive Passive-Defensive 4
Aggressive-Defensive 5
Humanistic
.85
-.16
-.07
Affiliative
.87
-.21
.15
Approval
.05T
.29
.80
Conventional
-.20
.32
.80
Dependence
-.03
.21
.85
Avoidance
-.39
.48
.49
Oppositional
-.01
.73
.22
Power
-.03
.85
.21
Competitive
-.09
.81
.21
Perfectionistic
.18
.68
.40
Achievement
.84
.19
-.12
Self-Actualizing
.88
.12
-.14
21.7%
Variance Explained
26.6%
24.6%
26.6%
51.2%
Cumulative Variance Explained 72.9% Table 9. Construct Validity of the 12 Scales of the Organizational Culture Inventory.6
INVENTORY SCALES: FACTORSa:
indicate weakness with respect to discriminate validity or may suggest that the norms
associated with Aggressive-Defensive and Passive-Defensive are loosely tied to certain
settings (Cooke 1988).
4 Based on factor analysis with varmix rotation 5 Cross-sectional research sample Form III (n=859) 6 Source: Psychological Reports 1993 42
Reliability Issues
Good measurement must have reliability as well as validity (Herzog 1996).
Reliability deals with whether a variable has been measured with precision. A reliable
measure is one that does not have much systematic error in it. Systematic error in a
measure means that the observed score may differ from the true score. Because a reliable
measure contains little systematic error, the reported score is close to the true score.
Reliability was assessed for this survey using an internal-consistency approach.
The approach involved computing the average correlations among all possible pairs of
individual items measuring the same variable (Herzog 1996). The final result, coefficient
alpha, provides a measure of the degree to which the full-scale score derived from a set of
items is free from systematic error. The general rule of thumb for reliability is the higher
the better. An alpha coefficient of .7 or higher suggests that the scale is reasonably
reliable (Crano & Brewer 2002).
As can be seen from Table 10, the results indicate that acceptable consistency
among items within scales has been maintained. Most of the scales in the previous study
have alphas coefficients above .80. In this dissertation research the alphas improved with
a range from .81 to .92.
43
INVENTORY SCALES
ALPHA COEFFICIENT (Current Study)
ALPHA COEFFICIENT (Previous Study)a7
Humanistic/Encouraging
.90
.90
Affiliative
.91
.93
Approval
.84
.82
Conventional
.85
.92
Dependent
.77
.91
Avoidance
.85
.84
Oppositional
.75
.81
Power
.84
.89
Competitive
.86
.88
Perfectionistic
.79
.84
Achievement
.85
.91
Self-Actualizing
.83
.91
Table 10. Cronbach Alpha Coefficients for Scales 8
7 Cross sectional research sample (n=859) 8 Source: Psychological Reports June 1993 44
CHAPTER IV
DATA ANALYSIS
Introduction
The purpose of Chapter Four is to analyze the data in light of the propositions that
were outlined in Chapter Three. This chapter will use factor analysis to develop and
validate the measurement model and test the proposition that there are different types of
types of cultures among the twelve units. This chapter will then examine the association
between culture type and level of spending with minority suppliers.
Summary Statistics
In addition to measuring the culture scales, demographic data was also collected.
In summary, the average buyer surveyed was white male with 15 years or more of
employment with the firm. The buyers were also well educated with nearly 85 percent
having at least bachelor’s degrees. Several graphs have been constructed to visually
represent some of these demographical characteristics. The graphs begin with the unit of
affiliation in Figure 7 below.
45
Respondent's Unit Affiliation
Unit One
Unit Twelve
1.3%
5.1%
Unit Two
Unit Eleven
11.4%
11.4%
Unit Three
Unit Ten
6.3%
5.1%
Unit Four
Unit Nine
11.4%
11.4%
Unit Five
Unit Eight
11.4%
16.5%
Unit Six
6.3%
Unit Seven
2.5%
Figure 2. Unit Affiliation of Respondents
Figure 2 displays the units that the buyers represented. The largest number of
buyers came from unit number eight at 16.5%. This unit also had the largest number of
buyers who were asked to complete the survey (17). Five units (numbers eleven, nine,
two, four and five) represented the next largest percentage. Each of these 5 units
represented 11.4% of the sample. The remaining half of the units represented from 1.3 to
6.3% of the sample.
46
The ethnic background of a vast majority of the buyers surveyed was white. As
outlined in Figure 3, white buyers represented 84.9 percent of the respondents. The next
largest percentage was those buyers who preferred not to specify their ethnic background.
These buyers represented 7.6 percent of the sample. The next largest ethnic group
represented was black, at 3.8 percent, and Hispanics and American Indians represented
Ethnic Background:
American Indian
1.3%
Black
Prefer No Response
3.8%
7.6%
Hispanic
2.5%
White
84.8%
Figure 3. Ethnicity of Respondents
2.5 and 1.3 percent respectively.
47
According to Figure 4, below, nearly half the buyers have been with the
organization more than fifteen years. 6.4 percent have been with the organization 6 to 15
years. Thirty-eight percent have been with the organization between 2 and 6 years. And
only 1.3 percent has been with the organization two years or less.
Years with Organization:
1 to 2 Years
1.3%
Prefer No Response
2 to 4 Years
10.1%
17.7%
4 to 6 Years
More than 15 Years
20.3%
44.3%
6 to 10 Years
5.1%
10 to 15 Years
1.3%
Figure 4. Years with Organization
48
Figure 5, below, shows that over 50 percent of the buyers surveyed were male. A
little less than 30 percent were female, and nearly 20 percent preferred not to identify
Gender:
Prefer No Response
19.0%
Female
27.8%
Male
53.2%
Figure 5. Gender of Respondents
their gender.
49
Figure 6, below, shows that nearly 85 percent of the respondents have at least a
Education:
Prefer No Response
Some College
5.1%
7.6%
Doctoral Degree
Associate's/Technica
1.3%
2.5%
Master's Degree
30.4%
Bachelor's Degree
40.5%
Some Graduate Work
12.7%
Figure 6. Educational-Level of Respondents
bachelor’s degree, and over 30 percent have master’s degrees.
Analysis at the Organizational-Level
Based on the 79 cases, aggregate scores for the 12 culture styles were compiled
along with the primary and secondary styles of the overall firm (organizational level) and
for each individual unit. The scores are listed in Table 6.
50
CULTURE TYPE
MEAN: ORGANIZATIONAL- LEVEL
CULTURE STYLES (SCALES) Affiliative Achievement Perfectionistic Humanistic Self-Actualizing Conventional Dependence Avoidance Power Competitive Approval Oppositional
Constructive Constructive Aggressive-Defensive Constructive Constructive Passive-Defensive Passive-Defensive Passive-Defensive Aggressive-Defensive Aggressive-Defensive Passive-Defensive Aggressive-Defensive
35.4262 34.7595 32.4177 31.3291 29.2658 28.8703 28.5696 24.7975 24.4346 23.7215 23.6456 17.6567
Table 11. Scale Means at the Organizational Level
The primary style for the overall organization is affiliative. As demonstrated in
Affiliative
7
6
5
4
3
2
1
0
y c n e u q e r F
18.00
22.00
27.00
31.00
35.00
38.00
42.00
46.00
20.00
24.00
29.00
33.00
36.67
40.00
44.00
49.00
Affiliative
Figure 7. Frequency for Affiliative Scale at Organizational Level
Figure 7, the frequency for the affiliative style ranged from 18 to 49.
51
Affiliative cultures exist when organizations place a high priority on constructive
interpersonal relationships. Members are expected to be friendly, open, and sensitive to
the satisfaction of their work group. Affiliative cultures can enhance organizational
performance by promoting open communication, good cooperation and the effective
coordination of activities.
This firm’s secondary style is achievement. Figure 8 shows the frequency for the
Achievement
10
8
6
4
2
0
y c n e u q e r F
12.00
22.00
28.00
32.00
35.00
38.00
42.00
48.00
20.00
24.00
30.00
34.00
36.00
40.00
45.00
Achievement
Figure 8. Frequency of Achievement Scale at Organizational Level
achievement style which ranges from 12 to 48.
Achievement cultures are characterized by organizations that do things well and
value members who set and accomplish individual goals. Members of these organizations
set challenging but realistic goals, establish plans to reach these goals and pursue them
52
with enthusiasm. Achievement organizations are effective; solve problems appropriately,
serve clients and customers well, and orient organizational members in a healthy way.
In addition to scoring high in affiliative and achievement, the firm also scored
high in the other styles associated with a constructive culture. Those styles are self
actualizing and humanistic. The frequencies for these styles are shown in Figures 9 and
Self-Actualizing
7
6
5
4
3
2
1
0
y c n e u q e r F
12.00
16.00
20.00
25.00
29.00
33.00
37.00
41.00
14.00
18.00
23.00
27.00
31.00
35.00
39.00
46.00
Self-Actualizing
Figure 9. Frequency for Self-Actualizing Scale at Organizational Level
10. The scores ranged from 12 to 46 for self-actualizing and 15 to 48 for humanistic.
53
Humanistic
7
6
5
4
3
2
1
0
y c n e u q e r F
15.00
20.00
25.00
29.00
33.00
37.00
41.00
48.00
18.00
23.00
27.00
31.00
35.00
39.00
43.00
Humanistic
Figure 10. Frequency for Humanistic Scale at Organizational Level
The culture styles that ranked the highest in this firm are affiliative, achievement,
perfectionist, humanistic, and self-actualizing (in order from greatest to least). With the
exception of perfectionistic, all of these styles are associated with a Constructive culture.
As indicated previously, Constructive cultures promote diversity and productive
interpersonal relations among people with different backgrounds.
54
However, the perfectionistic style is associated with Aggressive-Defensive
cultures, which don’t promote collaboration and integration. Table 11 shows the high
frequency in which the perfectionistic style was demonstrated in the overall culture of
Perfectionistic
12
10
8
6
4
2
0
y c n e u q e r F
17.00
23.00
27.00
31.00
35.00
40.00
44.00
19.00
25.00
29.00
33.00
38.00
42.00
49.00
Perfectionistic
this firm.
Figure 11. Frequency of Perfectionistic Scale at Organizational Level
55
Figure 12 shows the results of respondents being asked if top management was
committed to making diversity work at this firm. The overall organizational mean is 3.1
on a scale from one to five with a standard deviation of 1.12.
Top Management's Commitment
40
30
20
10
Std. Dev = 1.12
Mean = 3.1
N = 78.00
0
y c n e u q e r F
1.0
2.0
3.0
4.0
5.0
Top Management's Commitment
Figure 12. Management’s Commitment to Diversity
56
Figure 13 shows the result of respondents being asked about employees
themselves being committed to making diversity work at this firm. The mean was 3.2
with a standard deviation of .93. The buyer‘s perceptions of employee commitment and
Employees' Commitment
40
30
20
10
Std. Dev = .93
Mean = 3.2
N = 78.00
0
y c n e u q e r F
1.0
2.0
3.0
4.0
5.0
Employees' Commitment
management commitment to diversity appear to be very similar.
Figure 13. Employee’s Commitment to Diversity
57
Results of Factor Analysis
Principal component factor analysis was conducted to determine the pattern of
correlations among the twelve culture styles. As outlined in Table 12, the principal
component explained approximately forty percent or more of the variance for each style.
Culture Cluster
Alpha
Culture Styles
Percent Variance Explained
Eigenvalues for Principal Component
5.677 5.521
56.777 55.206
.9102 .9069
Passive-Defensive
5.310 6.246 3.985 6.057 5.598 4.178 4.100 4.934 5.147 4.255
53.104 62.455 39.851 60.566 55.981 41.780 41.003 49.338 51.470 42.550
.8994 .9303 .8220 .9245 .9113 .8369 .8361 .8830 .8915 .8160
Achievement Constructive Self- Actualizing Humanistic Affiliative Approval Conventional Dependent Avoidance Perfectionist Aggressive-Defensive Competitive Power Oppositional Table 12. Factor Analysis for Culture Styles
The constructive cluster had the largest amount of variance explained.
The secondary purpose for conducting the factor analysis was to confirm that the
factor loading results were similar to what had been found in previous studies using the
same instrument. The alphas were very similar. Moreover, when limiting the factor
correlations from this survey to .65 or higher, the alpha scores moved very little.
58
Results of Reliability Test
Reliability tests were also conducted and resulted in reasonably high alphas for all
clusters. The constructive cluster had the highest alphas ranging from .89 to .91. as noted
in Table 12. The passive-defensive cluster ranged from .83 to .92 and the aggressive-
defensive,.81 to .89. These alphas were similar to what had been found in previous
studies, further strengthening the reliability of the instrument
Analysis for Individual Units
In addition to organizational-level analysis, unit-level analysis was also
conducted. The unit-level is where comparisons were made to test the propositions. First,
the means for each of the twelve styles was calculated for all of the buying units. Table
Unit 12
Unit 3
Unit 11
Unit 10
Unit 4
Unit Unit Unit 6 8 7 28.2 27.5 29
13 below outlines the scale mean scores for units one through twelve.
24.6
Unit Unit 2 5 36.8 24.4 30.8 31 38.6 30.2 34.5 33.4 30.4 34 33.3 33.2 31.6 33 29.8
30.4
28.5
28.7
23
Unit Unit 9 1 31.4 35.2 32.1 35.7 35 35.7 35.5 39 37.8 36.7 39 34.6 34.5 36.7 37.7 37.7 35.5 38.6 28 31.4 30.3 28.9 28.7 32.4 28 21.9 27.1 22 24.2 24.3 21.5 26.6 21.6 25.3 21.4 31 17 24.9 33.1 25.3 29.6 30.5 26.5 29.7 35.2 39 24.2 35 15 24.7 36.2 26.5 26.3 37.8 32.5 24.1 32.5 25.7 30.2 32.0 13 20.8 28.6 23.5 24.3 33 11 23.7 24.7 24.7 25.2 24.7 32 16.5 24.4 17.7 18.4 17.4 20.5 16.7 14.2 14.5 21.0 17.0 10 21.3 23.1 24.3 27.6 27.0 24.7 33.8 22.9 22.8 18.4 29 12 24.3 31.2 21.4 23.3 25.2 31.5 20.8 25.4 17.5 24.8 25.0 13 37.5 29.5 33.7 31.3 34.8 36.3 27.5 35.6 29 23
28.6 39
Conventional Dependent Avoidance Oppositional Power Competitive Perfectionistic Table 13. Means for Individual Units
CULTURE STYLE Humanistic Affiliative Achievement Self-Actualizing
59
Next, for each of the twelve units, an average was taken for the four styles that
comprise constructive cultures, the four styles that comprise passive-defensive cultures,
and the four styles that comprise aggressive-defensive cultures. Once the aggregated
means were calculated, a primary culture style was designated for each unit. Table 14
Culture Cluster
Average : Constructive
Average : Passive-Defensive
Average: Aggressive-Defensive
Unit 1 2 3 4 5 6 7 8 9 10 11 12
Constructive Passive-Defensive Constructive Constructive Passive Defensive Passive-Defensive Constructive Constructive Constructive Constructive Constructive
34.38 36.6 26.8 32.16 32.03 28.3 30.75 32.076 32.58 34.937 34.80 35.125
15.97 22.86 31.6 24.56 26.44 31.85 33.62 23.69 29.388 24.45 27.33 27.875
14.5 22.42 31.25 22.78 23.33 25.0 29.62 22.096 24.13 21.87 27.11 26.31
Table 14. Aggregate Means for Culture Clusters
summarizes the aggregate means for each culture style and unit.
A primary style is defined as the most dominant culture style. The dominant
culture style is determined by the style that has the highest mean within each division.
Most units had styles scores that were close, and therefore a secondary style was
identified as well.
As mentioned in previous chapters, the styles have been grouped together in three
clusters; constructive, aggressive-defensive and passive-defensive. Based on the highest 3
or 4 style scores and their pattern of clustering, units have been designated to one of these
three clusters.
60
Units one, two, four, five, eight, nine, ten, eleven and twelve’s primary and
secondary styles are in the constructive cluster. Because both primary and secondary
styles were clustered in the constructive culture, all of these units were designated as
having constructive cultures. However it is noted that division ten’s third and fourth
highest mean styles were in the passive-aggressive cluster making it the weaker of the
constructive cultures. Because the overall, organizational-level culture was constructive,
as expected, three of the four highest means for unit-level culture styles were reported in
the constructive cluster. However, the third highest mean was in the perfectionist style
indicating that buyers perceive they are expected to be perfect in order to fit in the
organization.
Units three, six and seven had primary styles in the passive-defensive cluster and
secondary styles in the aggressive defensive cluster. The aggregate mean scores,
however, for these three units designated them to the passive-aggressive cluster.
Qualitative and Quantitative Data Analysis: A Combined Approach
Once the culture cluster was designated from the survey, this information was
compared to the levels of spending at the unit level to test the propositions. As outlined in
Chapter 3, the design of this research involved combining qualitative and quantitative
methods. The culture style was obtained by an attitudinal survey. The level of spending
with minority suppliers was gathered using archival research and interviews.
Increasingly we see multi-site, multi-method studies that combine qualitative and
quantitative inquiry (Smith & Louis 1982). By combining methods from different
approaches it is possible to elicit important new insights into the causes and 61
consequences of social behavior (Axinn & Pearce 2002) According to Pearce, each
research problem in which we engage has specific goals and the selection of an
appropriate research design and data collection method depends entirely on the goals of
the research. However, the different strengths and weaknesses of the data collection
method may indicate that combining methods could be advantageous.
Data Displays
The use of network and matrix displays is becoming common methodological
techniques for crafting analysis (Miles & Huberman 1994). The goal of this research is to
shift through data from 12 units to identify similarities, relationships between variables,
patterns, themes, and distinct differences between subunits to gradually elaborate a small
set of generalization that can cover the consistencies discerned in the data.
The qualitative and quantitative data obtained in this study will be displayed to
organize and compress the information. Looking at displays helps to permit conclusion
drawing and helps us to understand what is happening by simplifying information
processing and patterns (Miles & Huberman 1994).
Meta matrices are master charts assembling descriptive data from each of several
units in a standard format. The basic principle is inclusion of all relevant condensed data
into a chart (Miles & Huberman 1994). Partially-ordered meta matrices display some
internal order but not complete order. Because this research involves cross-unit analysis,
the aim in this instance is to uncover and describe what is happening in a local setting
A partially ordered display will help to determine similarities and differences, and
draw meaningful conclusions. According to Miles and Huberman, the display can make 62
all the data comparable by standardizing them into the same metric and reducing the
overall amount of data by assigning data to fewer distinct sets; in this case, spending
levels, clusters and scale scores.
This data display and analysis method is being used in order to analyze and
synthesize the outcomes across the twelve units. According to Miles and Huberman,
cross-unit or cross-case displays for exploring and describing data can enhance
generalizability (1994). It can help us to determine whether the findings make sense
beyond a specific case, or in this instance, unit. Multiple units or cases can also help find
negative cases to strengthen a theory, and build theory through examination of
similarities and differences across units or cases. Multiple units not only pin down the
specific conditions under which a finding will occur but also help us form the more
general categories of how those conditions may be related (Miles and Huberman 1994).
Unit Level Display for Partially-Ordered Meta Matrix Minority Suppliers Buyers Minority Spending Level Culture
1 9 5 9 9 5 2 13 9 4 9 4
High Moderate Moderate High High Moderate Moderate Moderate Low Low Low High
Constructive Constructive Passive-Defensive Constructive Constructive Passive-Defensive Passive-Defensive Constructive Constructive Constructive Constructive Constructive
Unit 1 One 6 Two 16 Three 2 Four 9 Five 1 Six 5 Seven 17 Eight 7 Nine 6 Ten 6 Eleven Twelve 1 Table 15. Partially-Ordered Meta Matrix
The results of this research have been displayed in Figure 15.
63
Results
Test of Proposition One: There is variance in the types of culture among the 12
buying units.
Findings:
The study revealed that there is variance in the types of cultures found within the
buying units at this firm, however the variance is slight. The majority of the units fall
within a single cluster. Seventy-five percent of the units (nine out of twelve) are
classified as constructive. The remaining units (3, 6 & 7) were classified as having
passive-aggressive cultures.
Test of Proposition Two: The presence of constructive cultures will be associated
with high levels of spending.
Findings:
The study did not find a clear relationship between constructive cultures and high
levels of spending. Of the nine constructive cultures identified among buying units, four
of the units had high levels of spending with minority suppliers, two units had moderate
levels, and three units had low levels.
Test of Proposition Three: The presence of passive-defensive cultures will be
associated with moderate levels of spending.
64
Findings:
The research findings support this proposition. Of the three units that were
identified has having passive-defensive cultures, all of them have moderate levels of
spending. However, it was observed that unit two had moderate levels of spending, but in
a constructive culture rather than a passive-defensive culture.
Test of Proposition Four: The presence of aggressive-defensive cultures will be
associated with low levels of spending.
Findings:
No cultures were identified as being aggressive-defensive and all low spending
levels were associated with constructive cultures. Although no culture was identified as
falling into the aggressive-defensive cluster, every unit’s mean for the perfectionist style
ranked very high. Out of mean scores for each the twelve styles, the mean score for
perfectionist was always in the top 50 percent. Nearly 60 percent (7 out of 12 units) had
scores on the perfectionist style that ranked in the top three of their mean scores.
65
CHAPTER V
DISCUSSION OF THE RESULTS
Introduction
Chapter 5 builds on the findings and analysis of previous chapters by discussing
the results and possibilities for future research. This chapter discusses the implications for
the firm that was studied, for supply chain management professionals, and for academics
interested in supplier diversity. The chapter concludes by highlighting the limitations of
the research and possible directions for future research.
Managerial Contributions
The research was designed to detect the presence of different subcultures within a
single organization. The results showed that overall this firm has a strong constructive
culture which promotes diversity. There were, however, passive-defensive subcultures in
three individual units. Passive-defense cultures suppress diversity and individual
differences. Moreover, it was also observed that no units with passive-defensive cultures
had high levels of spending with diverse suppliers, as was predicted in the research
design.
There were no aggressive-defense cultures identified among the twelve units
surveyed. This should be considered a positive observation since this type of culture does
66
not promote collaboration and integration, which are key ingredients for making supplier
diversity programs work. It was observed however, that this firm had a strong presence of
the perfectionist style, which is considered an aggressive-defensive behavior. This was
observed across the organization as well as in particular units. Management should aware
of the perception that some buyers feel they have to do things perfectly.
A perfectionist style is a culture where members feel the need to appear
competent, independent and be precise while never making a mistake. Perfectionist styles
may prevent members from asking for help with identifying diverse suppliers for fear of
appearing imperfect or uncertain.
This aggressive-defensive style can stifle integration and collaboration among
units and with external stakeholders such as diverse suppliers. Perhaps collaboration
between those units with lower spending levels and those with higher spending levels
would result in increased firm-wide supplier diversity effectiveness.
Moreover, the results showed that the buyers surveyed felt that managerial and
employee commitment to diversity was about average. To improve commitment, the firm
may want to consider dedicating more human and financial resources to supplier
diversity, tying evaluation and rewards to supplier diversity goals, and targeting specific
programs and media to minority suppliers.
Academic Contributions
First, style clustering was evident from using Cooke’s Culture for Diversity
Instrument, which is consistent with previous uses of this instrument. In addition, the
findings of this research support the idea suggested by Min (1999), and Carter et. al 67
(1999) that corporate culture can have an impact on supplier diversity programs.
Specifically, this study found that in the absence of a culture that promotes diversity and
productive interpersonal relations, units did not have high levels of spending with
minority suppliers. Moreover, of those units identified has having high levels of spending
with minority suppliers, all of them were associated with constructive cultures.
There were units with constructive cultures and low to moderate levels of
spending with minority suppliers. This may be due to other factors affecting the unit’s
ability to increase spending with minority suppliers. For example, the buying units had
different numbers of minority suppliers that they worked with. This may be because some
units are more effective at locating and developing minority suppliers than others. It may
also be because some units with constructive cultures and low to moderate spending
levels may not have minority suppliers available in a particular spending area.
For example, the firm that was studied in this research is a heavy equipment
manufacturer. The 1997 U.S. Department of Commerce study outlined in Chapter 2
showed that only 3.31 percent of minority-owned businesses were in manufacturing. In
contrast, the largest area of minority-owned business is the services industry at 42.7
percent followed by retail businesses at 13.87 percent. Consequently, the effectiveness of
the supplier diversity program at units with low to moderate spending in constructive
cultures may be impacted by the unavailability of minority businesses in manufacturing.
Finally, another explanation for units with constructive cultures and low to
moderate spending levels may be the amount of effort expended to locate diverse
suppliers. In addition to collaborating with units that have higher levels of spending with
minority suppliers, units can purposefully and aggressively seek to affiliate with minority 68
business associations, and attend vendor fairs. Firms may also invest in minority business
communities and pursue unique and creative ways to partner with and develop minority
suppliers.
Limitations of Research
In order to make further generalizable statements about the firm, it would be
necessary to survey the remaining buying units in the firm and compare the survey results
with the outcome of this study. A similar study should also be conducted in other
industries that have greater representation of minority-owned businesses, such as the
services industry.
Finally, this study does not take into account other factors that may influence the
effectiveness of a supplier diversity program such as communication processes, and
minority community involvement.
Future Research
In addition to studying other industries, future research in this area should
investigate specific buying processes and behaviors. For example, communication
procedures used to identify, contract with, and develop minority suppliers. The areas to
examine could be procedures for requesting proposals, electronic information and
registration, involvement with minority supplier conferences and networking events,
training, education, and supplier development programs.
69
BIBLIOGRAPHY
Axinn, William G., Pearce, Lisa D. Mixing Methods as a Data Collection Strategy, New Strategies for Social Research, Chapter 1. Institute for Social Research, University of Michigan, 2002.
Bales, W., Fearon, H. “CEO’s Perceptions and Expectations of the Purchasing Function”, Center for Advanced Purchasing Studies, 1993.
Babbage, C. On the Economy of Machinery and Manufacturers, Philadelphia, PA: Carey & Lea, 183
Blau, Peter M. The Dynamics of Bureaucracy, University of Chicago Press, 1955. Bolman, L.G. & Deal, T.E. Modern Approaches to Understanding and Managing Organizations, Jossey-Bass, 1984.
Burns, T., & Stalker, G.M. The Management of Innovation, London: Tavistock Publications, 1961.
Burt, D.N. and Soukup, W.R. “Purchasing’s Role in New Product Development,” Harvard Business Review, September 1985.
Buchanan, T. and Smith, J.L. (1999). Research on the Internet: Validation of the
World Wide Web Mediated Personality Scale. Behavior research methods, Instruments and Computers, 31
Carter, C., Auskalnis, R., Ketchum, C. "Purchasing from Minority Business
Enterprises: Key Success Factors", The Journal of Supply Chain Management, Winter, 1999.
Carter, J.R., Carter, P.L., Monczka, R.M., Slaight, R.H., Swan, A.J. ”The Future of Purchasing and Supply: A Ten Year Forecast”, The Journal of Supply Chain Management, Winter 2000.
Cavinato, J.L. and Kauffman, R.G. The Purchasing Handbook, National Association of Purchasing Management, McGraw Hill Publishing, 2000.
70
Assessing and Changing the Self-Concept of Organizational Member.” Lifestyles Inventory Leaders Guide. Plymouth, MI: Human Synergistics
Administration. Plymouth, MI: Human Synergistics.
Cherns, A. “The Principles of Sociotechnical Design”, Human Relations, 1976. Cooke, R.A., Lafferty, J.C. “Level One: Lifestyles Inventory-An Instrument for Cooke, R.A., Fisher, D.J. Organizational Culture of the Federal Aviation Cooke, R.A., Rousseau, D.M. "Behavioral Norms and Expectations: A Quantitative
Approach to the Assessment of Organizational Culture", Group and Organization Studies, 1988.
2nd Edition, Mahwah Publishers, 2002.
Cooke, R.A., Szumal, J.L. “Measuring Normative Beliefs and Shared Behavioral Expectations in Organizations,” Psychological Reports, June 1993. Crano, W. D., Brewer, M. B. Principles and Methods of Social Science Research, Deal, T., & Kennedy, A. Corporate Cultures, Addison-Wesley Publishing. 1982. Dollinger, M., and Daily, C. “Purchasing from Small Minority-Owned Firms: Corporate Problems”, Center for Advanced Purchasing Studies, 1989.
Dollinger, M. J., Enz, C. A., and Daily, C. “Purchasing from Minority Small Business”, International Journal of Purchasing and Materials Management, 1991
Journal of Purchasing and Materials Management, 1995.
Durkheim, E. Rules of Sociological Method, Free Press, 1938. Ellram, L. “Purchasing Management: Analysis, Planning and Practice”, International Emery, F. & Trist, E. "The Causal Texture of Organizational Environments,” Human Relations, 1965.
Emery, F. Document No. T.176 London, Tavistock Institute, 1963. Fayol, H. General and Industrial Management, London: Pittman Publishing Company, C. Storrs translation 1949.
Geertz, C. The Interpretation of Cultures, Basic Books Publishing, 1973. Giunipero, L. "Differences between Minority and Non-Minority Suppliers", Journal of Purchasing and Materials Management, Spring, 1980.
Giunipero, L. “Developing Effective Minority Purchasing Programs”, Sloan 71
Management Review, Winter 1981, pp. 33-42.
Gumpert, D.E. “Seeking Minority-Owned Business as Suppliers”, Harvard Business Review, Jan-Feb. 1979.
Psychology, 1993.
Hall, 1999.
Gundry, L. “The Culture Context of a Grievance Process,” Journal of Business and Handfield, R., Nichols, E. Jr. Introduction to Supply Chain Management, Prentice- Hassard, J. Sociology and Organization Theory: Positivism, Paradigms and Postmodernity, Cambridge University Press, 1993.
Hatch, Mary Jo, “The Dynamics of Organizational Culture”, Academy of Management Review, 1993.
Heide, J.B. and Miner, A.S. "The Shadow of the Future: Effects of Anticipated
Interaction and Frequency of Contact on Buyer-Seller Cooperation," Academy of Management Journal, June 1992.
HarperCollins Publishers, 1996.
Herzog, Thomas, R. Research Methods and Data Analysis in the Social Sciences, Hewson, C., et.al. Internet Research Methods, 2003, Sage Publications. Homans, G. Social Behavior, Its Elementary Forms, Harcourt, Brace, Jovanovich, Inc., 1974.
Kauffman, Ralph G. “A Triangulation Approach to Diversity Supplier Development,” CAPS Research, Best Practices in Purchasing and Supply Chain Management, June 2001.
Kilman R.H., Saxton, M.J., & Serpa, R. “Issues in Understanding and Changing Culture, California Management Review, 1986.
Krause, D.R. “Supplier Development: Current Practices and Outcomes,” International Journal of Purchasing and Materials Management, 1997.
Supplier's Perspective", The Journal of Supply Chain Management, Fall 1999.
Krause, D., Ragatz, G.L., Hughley, S. "Supplier Development from the Minority Lancioni, R. “New Developments in Supply Chain Management for the Millennium,” Industrial Marketing Management, 2000.
Landeros, R., Reck, R, Plank, R.E. "Maintaining Buyer-Supplier Partnerships,” 72
International Journal of Purchasing and Materials Management, 1995.
Lawrence, P.R. & Lorsch, J.W. Developing Organizations, Addison-Wesley Publishing, 1969.
Louis, Meryl, R. “A Cultural Perspective on Organizations: The Need for and
Consequences Viewing Organizations as Culture-Bearing Milieux.,” Proceedings, National Academy of Management Meeting, 1980.
March, J.G. & Simon, H.A. Organizations, Wiley & Sons, 1958. Makower, J. Beyond the Bottom Line, Simon and Schuster, 1994. Martin J. and Siehl C. "Organizational and Counter Culture: An Uneasy Symbiosis,” Organizational Dynamics, Fall 1983.
McGinnis, M.A., Vallopra, R.M. “Purchasing and Supplier Involvement in Process Improvement: A Source of Competitive Advantage,” The Journal of Supply Chain Management, Fall 1999.
Meyer, Alan, “How Ideologies Supplant Formal Structures and Shape Responses to Environments,”. Journal of Management Studies, 1981.
Miles, Matthew B. Huberman, A. Michael, Qualitative Data Analysis, Sage Publications, 1994.
Min, H. “Gaining Competitive Advantages Though a Supplier Diversity Program,” CAPS Research, Best Practices in Purchasing and Supply Chain Research, December 1999.
Minority Business Development Agency, “The Emerging Minority Marketplace,” U.S. Department of Commerce, White Paper, September 1999.
Morgan, Jim. “From War Zone to Empowerment Zone”, Purchasing, August 15, 1996.
National Association of Purchasing Management, “Developing a Minority Supplier Program,” InfoEdge, February 2001 .
Parsons, T. “A Paradigm for the Analysis of Social Systems and Change,” Systems, Change and Conflict, New York: Free Press, 1967.
Office Technology, 1984.
Peters, T.J., Waterman, R.H. “Nurturing Growth and Innovation,” Management 73
Pfeffer, Jeffrey. “Management as Symbolic Action: The Creation and Maintenance of Organizational Paradigms,” Research in Organizational Behavior, JAI Press, 1981.
Purchasing. “White Paper Report: Minority Supplier Development Part I-VI,” February 16, 1995.
Parsons, T. “Suggestions for a Sociological Approach to the Theory of Organizations,” Administrative Science Quarterly, June 1956.
Saddler, J. “Young Risk-Takers Push the Business Envelope,” Wall Street Journal, May 12, 1994, pp. B1-B2.
Sathe, V. Culture and Related Corporate Realities, Irwin, 1985. Schein, E. “The Role of the Founder in Creating Organizational Culture,” Organizational Dynamics, Summer 1983.
Schein, E. Organizational Culture and Leadership, Jossey-Bass, 1985. Shafritz, J. & Ott, J. S. Classics of Organization Theory, Dorsey Press, 1987. Sieber, J.E. Planning Ethically Responsible Research, Sage Publications, 1992. Simmel, G. Georg Simmel on Individuality and Social Forms: Selected Writings by Georg Simmel, Levine & Janowich, University of Chicago Press, 1972.
Simon, H.A. The New Science of Management Decisions, Harper & Row Publishers, 1960.
Science Quarterly, 1993.
Smircich, L. “Concepts of Culture and Organizational Analysis,” Administrative Smith, M.A. and Leigh, B. “Virtual Subjects: Using the Internet as an
Alternative Source of Subjects and Research Environment,” Behavior, Research Methods, Instruments and Computers, 1994.
Smith, A.G., & Louis, K.S. (Eds.), Multi-method Policy Research: Issues and Applications. American Behavioral Scientist, 1982.
Stanton, J.M. An empirical assessment of data collection using the Internet. Personnel Psychology, 1998.
Tashakkori, A., & Teddlie, C. Mixed Methodology: Combining Qualitative and Quantitative Approaches, Sage Publications, 1998. 74
Tichy, Noel. “Managing Change Strategically: The Technical, Political and Cultural Keys,” Organizational Dynamics, 1982.
Taylor, F. T. The Principles of Scientific Management, W.W. Norton, 1911. U.S. Small Business Administration, Office of Advocacy, Washington, D.C. “Minorities in Business”. 1999.
Vaonderembse, M.A., Tracey, M. “The Impact of Supplier Selection Criteria and
Supplier Involvement on Manufacturing Performance,” The Journal of Supply Chain Management, Summer 1999.
Walter A. “Value Creation in Buyer-Seller Relationships: Theoretical Considerations and Empirical Results,” Industrial Marketing Management, May 2001.
Weber, M. The Theory of Social and Economic Organization, A.M. Henderson and T. Parsons Translation, Oxford University Press, 1947.
Weber, M. Essays in Sociology, Edited and translated by H. Gerth and C. Wright Mills, Oxford University Press, 1946.
Journal of Supply Chain Management, Fall 2000.
Wisner, J. and Tan K.C. “Supply Chain Management and Its Impact on Purchasing,” Yu, L. “Do Relationships Matter?” MIT Sloan Management Review, Fall 2001. Zaheer, A., McEvily, B., Perrone, V. “The Strategic Value of Buyer-Supplier
Relationships,” International Journal of Purchasing and Materials Management, Summer, 1998.
75