Open Access
Available online http://ccforum.com/content/13/4/R128
Page 1 of 8
(page number not for citation purposes)
Vol 13 No 4
Research
Landmark survival as an end-point for trials in critically ill patients
– comparison of alternative durations of follow-up: an exploratory
analysis
Gopal Taori1, Kwok M Ho2,3, Carol George4, Rinaldo Bellomo1,5, Steven AR Webb2,3,
Graeme K Hart1 and Michael J Bailey5
1Department of Intensive care, Austin Hospital, Studley Road, Melbourne 3084, Australia
2Department of Intensive Care, Royal Perth Hospital, Wellington Street, Perth 6001 Australia
3Clinical Associate Professor, School of Population Health, University of Western Australia, Stirling Highway, Crawley 6009, Australia
4ANZICS CORE Group, Australian and New Zealand Intensive Care Society, 10 Ievers St, Carlton 3053, Australia
5ANZIC-RC, School Public Health & Preventive Medicine, Monash University Alfred Hospital, Commercial Road, Melbourne 3181, Australia
Corresponding author: Rinaldo Bellomo, rinaldo.bellomo@med.monash.edu.au
Received: 14 Nov 2008 Revisions requested: 26 Jan 2009 Revisions received: 16 Jun 2009 Accepted: 4 Aug 2009 Published: 4 Aug 2009
Critical Care 2009, 13:R128 (doi:10.1186/cc7988)
This article is online at: http://ccforum.com/content/13/4/R128
© 2009 Taori et al.; licensee BioMed Central Ltd.
This is an open access article distributed under the terms of the Creative Commons Attribution License (http://creativecommons.org/licenses/by/2.0),
which permits unrestricted use, distribution, and reproduction in any medium, provided the original work is properly cited.
Abstract
Introduction Interventional ICU trials have followed up patients
for variable duration. However, the optimal duration of follow-up
for the determination of mortality endpoint in such trials is
uncertain. We aimed to determine the most logical and practical
mortality end-point in clinical trials of critically ill patients.
Methods We performed a retrospective analysis of
prospectively collected data involving 369 patients with one of
the three specific diagnoses (i) Sepsis (ii) Community acquired
pneumonia (iii) Non operative trauma admitted to the Royal
Perth Hospital ICU, a large teaching hospital in Western
Australia (WA cohort). Their in-hospital and post discharge
survival outcome was assessed by linkage to the WA Death
Registry. A validation cohort involving 4609 patients admitted
during same time period with identical diagnoses from 55 ICUs
across Australia (CORE cohort) was used to compare the
patient characteristics and in-hospital survival to look at the
Australia-wide applicability of the long term survival data from
the WA cohort.
Results The long term outcome data of the WA cohort indicate
that mortality reached a plateau at 90 days after ICU admission
particularly for sepsis and pneumonia. Mortality after hospital
discharge before 90 days was not uncommon in these two
groups. Severity of acute illness as measured by the total
number of organ failures or acute physiology score was the main
predictor of 90-day mortality. The adjusted in-hospital survival
for the WA cohort was not significantly different from that of the
CORE cohort in all three diagnostic groups; sepsis (P = 0.19),
community acquired pneumonia (P = 0.86), non-operative
trauma (P = 0.47).
Conclusions A minimum of 90 days follow-up is necessary to
fully capture the mortality effect of sepsis and community
acquired pneumonia. A shorter period of follow-up time may be
sufficient for non-operative trauma.
Introduction
Mortality is the most clinically relevant and commonly used pri-
mary outcome measure for phase III trials in intensive care.
However, the optimal duration of follow-up for the determina-
tion of mortality in such trials is uncertain [1,2]. Interventional
ICU trials have followed up patients for different durations [3-
7]. Furthermore, some trials have censored follow up at time of
hospital discharge ignoring any subsequent out-of-hospital
deaths [8,9]. Such variability creates confusion, leads to con-
troversy and makes meta-analyses of trials with different times
of mortality assessment difficult to interpret. Measurement of
mortality at 28-days or censoring at hospital discharge have
logistic advantages but as many as one-third of critically ill
patients may still be in hospital after 28 days and deaths can
ANZICS: Australian and New Zealand Intensive Care Society; APACHE: Acute Physiology and Chronic Health Evaluation; APD: Adult Patient Data-
base; CI: confidence interval; CORE: Centre for Outcome and Resource Evaluation; GCS: Glasgow Coma Score; ICU: intensive care unit.
Critical Care Vol 13 No 4 Taori et al.
Page 2 of 8
(page number not for citation purposes)
still occur soon after hospital discharge [3]. Longer follow up
time, however, may make it difficult to distinguish between the
effects of critical illness (or the studied interventions) from
those of underlying age and co-morbidities [10]. Follow up for
longer time periods, especially where this extends beyond
hospital discharge, is more difficult and costly. The ideal
period of follow up would be up to a time point by which the
effects of critical illness remain powerful independent determi-
nants of outcome and before pre-existing factors, such as age
and co-morbidity, can have a marked and confounding impact
on survival [11].
The Australian and New Zealand Intensive Care Society
(ANZICS) Centre for Outcome and Resource Evaluation
(CORE) Adult Patient Database (APD) gathers information
about the vast majority of admissions of critically ill patients
from various intensive care units (ICUs) across Australia and
New Zealand but currently does not follow up patients beyond
hospital discharge [12]. However, in an embedded cohort of
ICU patients treated at the Royal Perth Hospital, which is a
large university teaching hospital in Western Australia (WA
cohort), such information is available [11]. Western Australia
is geographically isolated and has a low rate of emigration [11]
and, as such, loss to medium-term and long-term survival fol-
low-up by the Western Australian Death Registry is very low
[13].
We hypothesized that, if the characteristics and short-term
outcomes of patients in the WA cohort and the various ICUs
from Australia (as identified within the two databases) were
comparable, then the follow-up data of the patients in WA
cohort could be used to estimate the likely in-hospital and out-
of-hospital long-term survival of critically ill patients in Aus-
tralia.
Materials and methods
We conducted a retrospective analysis of prospectively col-
lected data from two large, related databases. Access to the
data was granted by the ANZICS CORE Management Com-
mittee in accordance with standing protocols. Data are col-
lected primarily for ICU Outcome Peer Review under Quality
Assurance Legislation of the Commonwealth of Australia (Part
VC Health Insurance Act 1973, Commonwealth of Australia).
Such data are collected and transferred from hospitals to the
database with government support and funding. Hospital data
are submitted by or on behalf of the ICU Director and results
are reported back to the Director. Each hospital allows subse-
quent data use as appropriate under the ANZICS CORE
standing procedures and in compliance with the ANZICS
CORE Terms of Reference [14] and waives the need for
informed consent. CORE does not hold individual patient
identifying data and as such informed consent has been
waived and specific ethical approval was not required. Hospi-
tal identifying data is held encrypted in the CORE database
and was not released for this study. The WA linked data had
the patient name and address removed and the Western Aus-
tralian Confidentiality of Health Information Committee
approved the study.
The study cohort consisted of all patients over 18 years of age
who were admitted to ICU from emergency departments
between 1 January, 2001 and 31 December, 2002 with one
of three acute physiology and chronic health evaluation score
(APACHE) II diagnoses [15]: sepsis of any etiology; commu-
nity acquired pneumonia or non-operative trauma.
The data for the WA cohort were extracted from the Royal
Perth Hospital ICU database. In this study, the survival out-
come after hospital discharge of the WA cohort was assessed
on 31 December 2003 by linkage to the WA death registry
[11,16]. The APACHE III-related physiology, diagnostic and
chronic health data of admissions from 55 Australian ICUs
were extracted from the ANZICS CORE adult patient data-
base (CORE cohort). In the CORE cohort, only ICUs that con-
sistently contributed data over a longer period (2001 to 2006)
were included, because the quality of the data from these con-
tributing sites was likely to be more consistent than from units
that were discontinuous contributors. Sites with missing data
for two or more years were also excluded. These CORE cohort
APACHE III data were converted to APACHE II data using a
specific algorithm [17,18].
The in-hospital and subsequent survival data of the WA cohort
at different time points after ICU admission was used to
assess whether a 'plateau' was observed. These data were
then further analyzed to determine the incidence of death after
hospital discharge and the quantum effect of various variables
on survival at different time points. A formal landmark survival
analysis was performed with the landmark time point chosen
as ICU discharge. The variables assessed included age, gen-
der, Charlson co-morbidity index [19], Acute physiology score
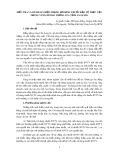
Figure 1
Kaplan Meier curves for time to death from intensive care unit admis-sion for the three types of diagnosisKaplan Meier curves for time to death from intensive care unit admis-
sion for the three types of diagnosis. Survival time is expressed in days.
Available online http://ccforum.com/content/13/4/R128
Page 3 of 8
(page number not for citation purposes)
component of the APACHE II score [15], and maximum
number of organ failure during ICU admission. The definition of
organ failure used for the study has been described previously
[11,20]. In the assessment of non-operative trauma, Glasgow
Coma Score (GCS) was also analyzed in addition to other var-
iables. The data analyzed had the patient name and address
removed and the study was approved by the Royal Perth Hos-
pital Ethics Committee and the Western Australian Confiden-
tiality of Health Information Committee, which waived the need
for informed consent. The in-hospital survival of the WA cohort
was then compared with the CORE cohort to look at the appli-
cability of its long-term follow-up data to a larger population.
Statistical analysis
Continuous data with a near normal distribution are presented
as mean and standard deviation and data with a skewed dis-
tribution were expressed as median and interquartile range.
Categorical variables and data with a skewed distribution are
analysed by chi-squared and Mann-Whitney test, respectively.
Kaplan-Meier survival analysis and log-rank test was used to
compare the difference in hospital survival between the WA
cohort and ANZICS APD cohort. Single variable and multivar-
iable analyses were performed using logistic regression for
binomial outcomes and reported using odds ratios (95% con-
fidence interval (CI)) and Cox proportional hazard regression
for time to death with results reported using hazard ratios
(95% CI). Survival analysis was performed with survival time
measured from both ICU admission and ICU discharge. Multi-
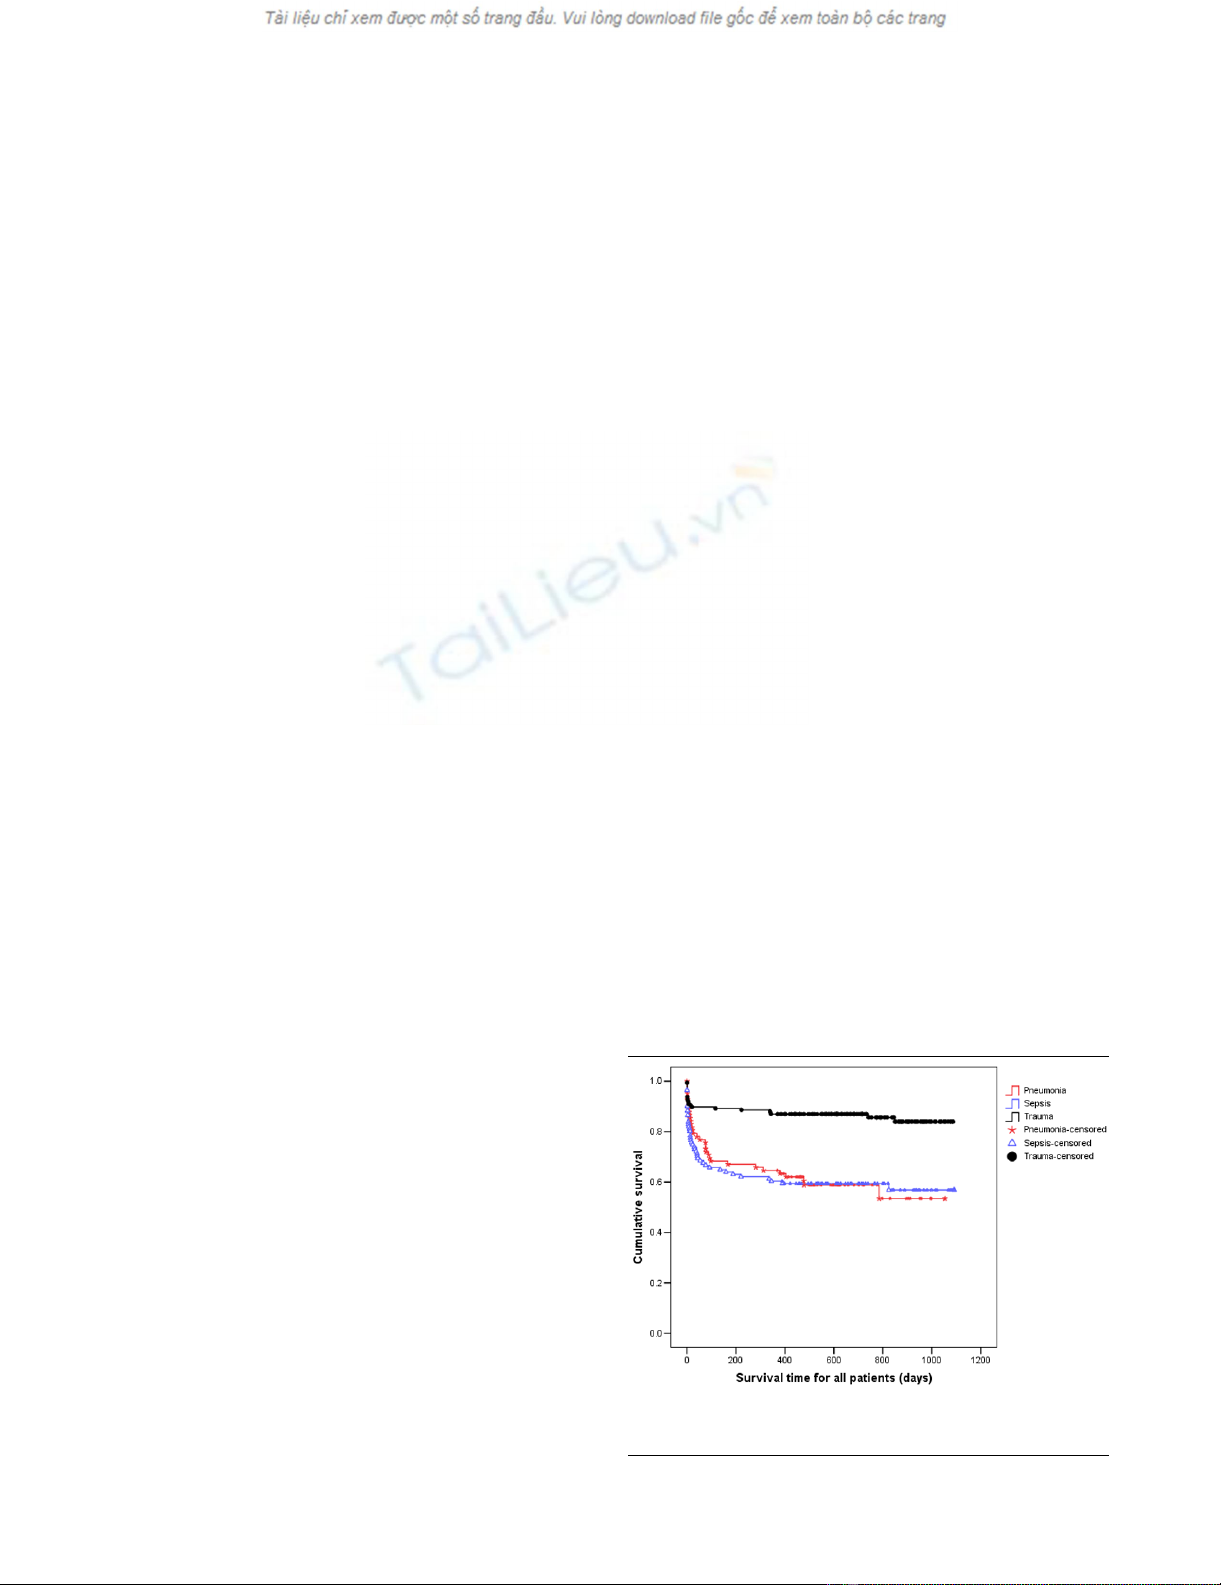
Figure 2
Cumulative hazard function for time to death from intensive care unit admission for the three types of diagnosisCumulative hazard function for time to death from intensive care unit admission for the three types of diagnosis. Note, for increased interpretability,
all survival times greater than 180 days have been truncated to 180 days.
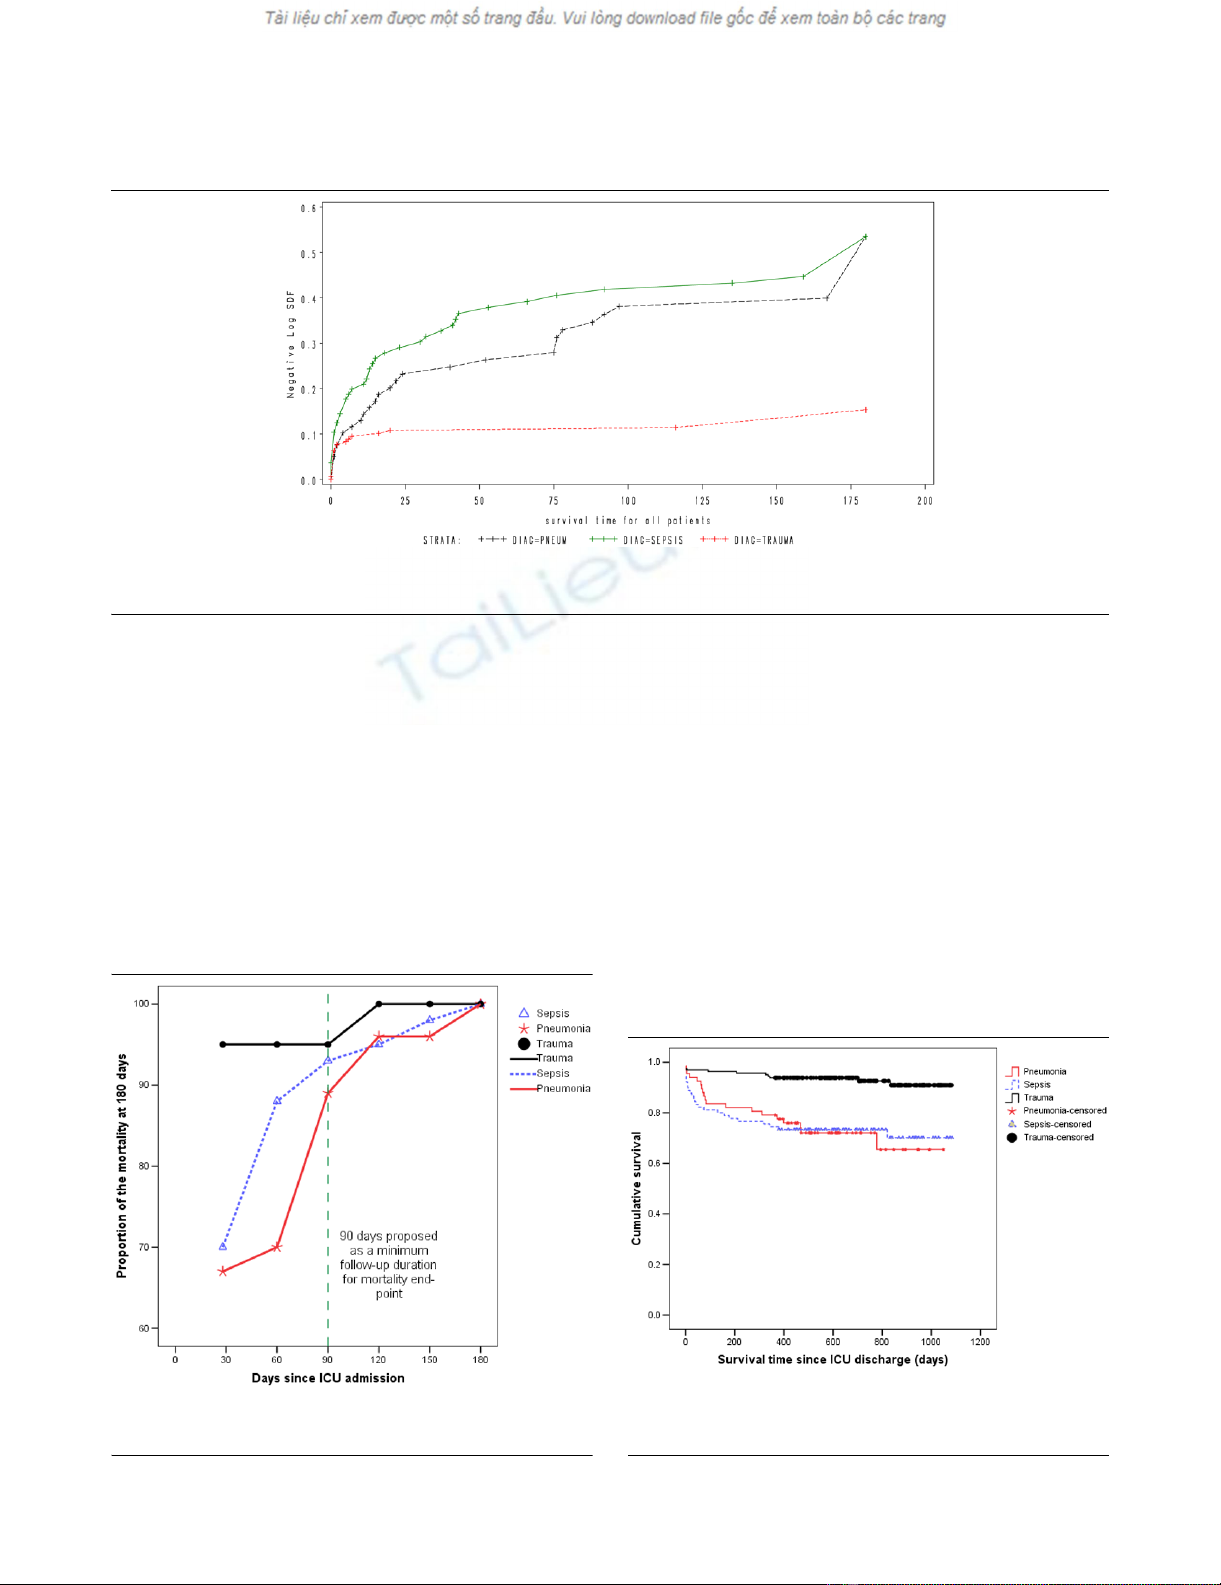
Figure 3
Mortality at different time point as a proportion of cumulative mortality at 180 days after ICU admissionMortality at different time point as a proportion of cumulative mortality at
180 days after ICU admission. ICU = intensive care unit.
Figure 4
Kaplan Meier curves for time to death from ICU discharge for the three types of diagnosisKaplan Meier curves for time to death from ICU discharge for the three
types of diagnosis. Survival time is expressed in days. ICU = intensive
care unit.
Critical Care Vol 13 No 4 Taori et al.
Page 4 of 8
(page number not for citation purposes)
variable models were constructed using both stepwise selec-
tion and backward elimination procedures before undergoing
a final assessment for clinical and biological plausibility. Statis-
tical analysis was performed using SAS version 9.1 (SAS Insti-
tute, Cary, NC, USA) and SPSS statistical software (version
13.0 for Windows, SPSS Inc., Chicago, IL, USA). A two-sided
P value of 0.05 was considered to be statistically significant.
Results
When considering patients with pneumonia or sepsis, 28-day
mortality only effectively captured 67% and 70% of deaths
that occurred within six months of ICU admission. By consid-
ering 90-day mortality, the proportion of deaths captured
increased to 89% and 93%, respectively (Figures 1 and 2).
The absolute increase in mortality between 90 and 180 days
in these two diagnostic subgroups was relatively small (2.7%,
95% CI = 15% to 9.7%; and 3.6%, 95% CI = 17.5% to
10.4%, respectively; Figure 3 and Table 1). As for the patients
with non-operative trauma, mortality rate appeared to 'plateau'
well before 28 days (Figure 2). These results remained con-
sistent when considering post ICU survival (Figures 4 and 5).
Single-variable analysis showed the APACHE score to be the
most consistent predictor of mortality but not a statistically sig-
nificant predictor of time to death after ICU discharge for either
pneumonia or sepsis (Table 2). GCS was a consistent predic-
tor of survival for trauma-related mortality, while patient age
was a consistent predictor for mortality in the pneumonia sub-
group.
Multivariable analysis showed that markers of acute illness,
such as the number of organ failure and APACHE score, were
the strongest predictors of mortality for sepsis, community
acquired pneumonia and non-operative trauma (Table 2).
Although age was also important in patients with community
acquired pneumonia and sepsis, co-morbidities did not
appear to have an independent predictive value across the
three diagnostic subgroups (Table 2).
When the two cohorts were compared patients from the WA
cohort were slightly younger, had less co-morbidity, and a
longer length of ICU and hospital stay across all three diagnos-
tic subgroups (Table 3). However, their APACHE II predicted
mortality and hospital mortality were not statistically signifi-
cantly different across the three diagnostic subgroups.
Discussion
Using the WA data, we found that the mortality of sepsis and
community acquired pneumonia reached a plateau by 90 days
and that mortality after hospital discharge was common. We
further found that at 90 days after ICU admission the severity
of acute illness on ICU admission was still the most important
predictor of mortality.
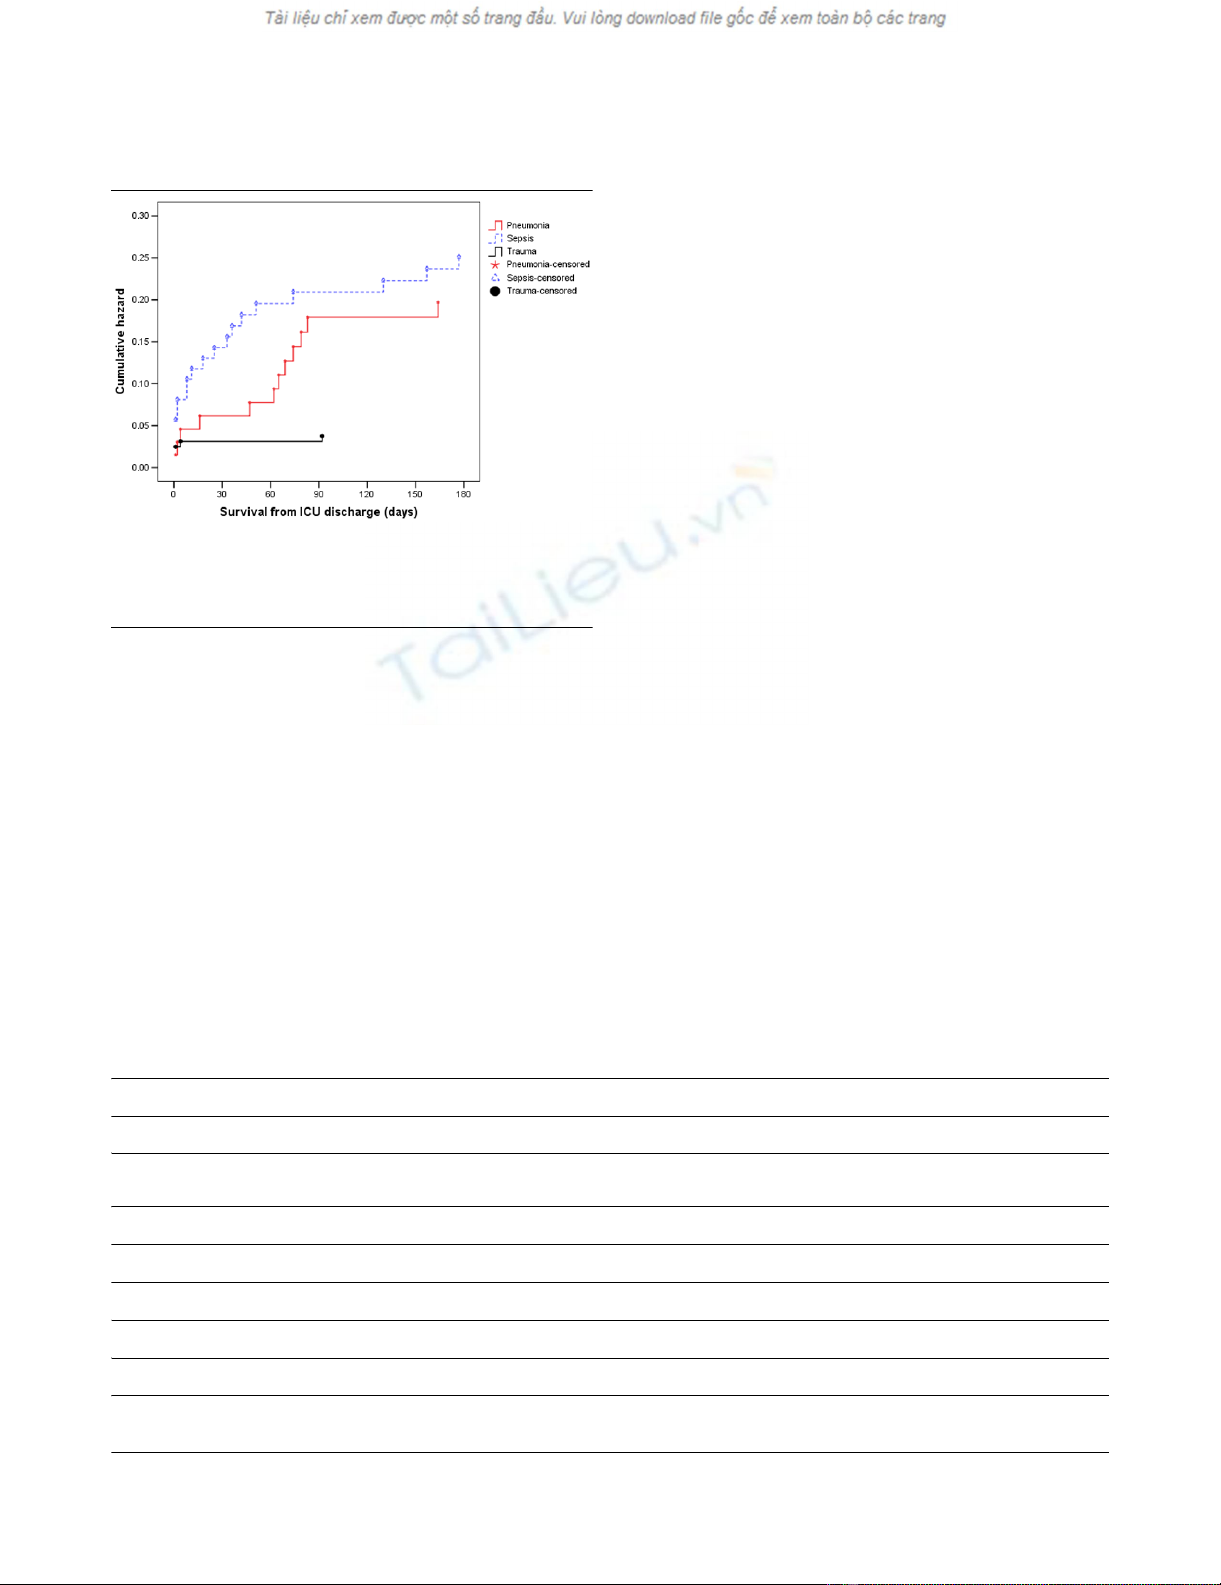
Figure 5
Cumulative hazard function for time to death from ICU discharge for the three types of diagnosisCumulative hazard function for time to death from ICU discharge for the
three types of diagnosis. Note, for increased interpretability, all survival
times greater than 180 days have been truncated to 180 days. ICU =
intensive care unit.
Table 1
Mortality at different time points and the percentage of deaths that occur within 180 days captured at each time point
Time period (days) Sepsis (n = 111) Pneumonia (n = 82) Trauma (n = 176)
Cumulative total number of deaths
(% of deaths captured)
Cumulative total number of deaths
(% of deaths captured)
Cumulative total number of deaths
(% of deaths captured)
28 28 (70) 18 (67) 18 (95)
60 35 (88) 19 (70) 18 (95)
90 37 (93) 24 (89) 18 (95)
120 38 (95) 26 (96) 19 (100)
150 39 (98) 26 (96) 19 (100)
180 40 (100) 27 (100) 19 (100)

Available online http://ccforum.com/content/13/4/R128
Page 5 of 8
(page number not for citation purposes)
Table 2
Single variable and multivariable analysis for prediction of death and survival (*P < 0.05)
Single variable analysis
Diagnosis Variables 28 day 90 day 180 day All mortality Time
to death (TTD)
TTD from
ICU discharge
Pneumonia Age 1.08
(1.03–1.13)*
1.09
(1.04–1.14)*
1.08
(1.04–1.13)*
1.07
(1.03–1.10)*
1.06
(1.03–1.09)*
1.05
(1.01–1.09)*
APACHE score 1.11
(1.02–1.21)*
1.08
(1.01–1.17)*
1.09
(1.02–1.18)*
1.07
(1.00–1.15)*
1.06
(1.01–1.11)*
1.04
(0.97–1.11)
Charlson 1.07
(0.88–1.29)
1.12
(0.94–1.33)
1.13
(0.95–1.35)
1.11
(0.93–1.33)
1.06
(0.96–1.18)
1.09
(0.96–1.22)
GCS 1.30
(0.82–2.05)
1.01
(0.81–1.26)
1.00
(0.81–1.23)
1.00
(0.82–1.23)
1.01
(0.87–1.19)
0.93
(0.80–1.09)
Organ score 1.44
(1.05–1.97)*
1.39
(1.04–1.84)*
1.56
(1.16–2.11)*
1.41
(1.07–1.86)*
1.30
(1.08–1.57)*
1.25
(0.96–1.62)
Male 0.68
(0.22–2.05)
0.74
(0.28–1.96)
1.11
(0.44–2.82)
1.11
(0.46–2.68)
1.03
(0.52–2.06)
1.19
(0.47–2.99)
Sepsis Age 1.01
(0.99–1.04)
1.02
(1.00–1.05)
1.02
(1.00–1.05)
1.03
(1.01–1.06)*
1.02
(1.00–1.04)*
1.05
(1.02–1.08)*
APACHE score 1.07
(1.01–1.13)*
1.07
(1.02–1.13)*
1.06
(1.00–1.11)*
1.05
(1.00–1.11)
1.05
(1.01–1.09)*
1.04
(0.99–1.10)
Charlson 1.04
(0.87–1.23)
1.00
(0.85–1.18)
1.07
(0.91–1.25)
1.15
(0.98–1.35)
1.08
(0.98–1.20)
1.15
(1.02–1.30)*
GCS 0.94
(0.84–1.04)
0.89
(0.8–0.99)*
0.9
(0.81–1.01)
0.9
(0.81–1.00)
0.93
(0.87–1.00)*
0.92
(0.84–1.00)
Organ score 1.67
(1.26–2.23)*
1.42
(1.12–1.8)*
1.38
(1.09–1.74)*
1.38
(1.10–1.73)*
1.28
(1.09–1.50)*
1.14
(0.92–1.41)
Male 0.77
(0.33–1.81)
1.00
(0.45–2.2)
1.07
(0.49–2.33)
1.06
(0.5–2.25)
1
(0.56–1.81)
1.03
(0.46–2.30)
Trauma Age 1.00
(0.97–1.03)
1.00
(0.97–1.03)
1.01
(0.98–1.04)
1.01
(0.99–1.04)
1.01
(0.99–1.03)
1.03
(1.00–1.07)
APACHE score 1.28
(1.16–1.41)*
1.28
(1.16–1.41)*
1.25
(1.15–1.36)*
1.22
(1.13–1.31)*
1.18
(1.12–1.24)*
1.13
(1.05–1.22)*
Charlson 0.87
(0.32–2.35)
0.87
(0.32–2.35)
0.85
(0.31–2.32)
0.72
(0.24–2.13)
0.74
(0.25–2.18)
0
(0–.)
GCS 0.62
(0.49–0.79)*
0.62
(0.49–0.79)*
0.70
(0.59–0.83)*
0.77
(0.69–0.87)*
0.78
(0.70–0.88)*
0.87
(0.76–0.99)*
Organ score 1.75
(1.30–2.36)*
1.75
(1.30–2.36)*
1.73
(1.29–2.31)*
1.66
(1.28–2.16)*
1.46
(1.22–1.75)*
1.44
(1.10–1.87)*


![Vaccine và ứng dụng: Bài tiểu luận [chuẩn SEO]](https://cdn.tailieu.vn/images/document/thumbnail/2016/20160519/3008140018/135x160/652005293.jpg)